Artificial Intelligent and meta-heuristic Control Based DFIG model
Considered Load Frequency Control for Multi-Area Power System
Shashi Kiran R
1, Veena H S
21
PG Student,
2Assistant Professor
1,2
Department of Electrical and Electronics Engineering, Banglore University/UVCE
minimization of settling time.
Intelligent Controls
Selection of controllers is important to make the response faster. Here PI controller, Fuzzy and PSO based tuning of Pi controllers are used and comparative performance analysis is made with setting time.
PI and Fuzzy based Control
In general, PI controllers are used in speed regulation of electrical drives. The output of the conventional speed regulator is expressed in equation (1).
( ) ( ) ∫ (1)
Where, E is the error which should be minimized by the PI controller. The output (out(t)) is the error minimized proportional signal. Kp is the proportional constant and Ki is integral constant.
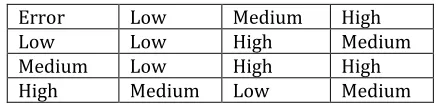
[image:1.596.325.543.602.654.2]The block diagram for fuzzy logic based speed regulation is shown in Fig.1. The fuzzy logic rules are developed by absorbing the characteristic of the PI controller performances.
Figure 1. Fuzzy logic control of speed regulation
Table 1. Fuzzy logic rules
Error Low Medium High
Low Low High Medium
Medium Low High High
High Medium Low Medium
The table 1 and figure shows the rules of the Fuzzy logic inference system and developed based on input and output parameters of FLC.
PSO Optimized PI based Controller
The random variation of PI controller parameters with fixed limits shows the change in Error (E) characteristics. So, there is infinite number of possibilities to choose the PI
E
Fuzzy
1/Z
Out
error
Ch.
© 2017, IRJET | Impact Factor value: 5.181 | ISO 9001:2008 Certified Journal
| Page 924
---***---Abstract— The penetration of wind energy conversion system in power system becomes very important because of green energy in recent power system. The incorporation of wind energy conversion system using doubly fed induction generator (DFIG) in load frequency control in multi-area power system is proposed with Area-1 and Area-2 consist of thermal reheat power plant where as area-3 and area-4 as hydro power plant. The performance evaluation is carried out using PI controller, PI-controller tuned with particle swarm optimization technique and fuzzy logic controller is presented. MATLAB software is used for evaluation and comparison of results.
Key words: DFIG, Control Scheme, Wind penetration, Artificial Intelligence, pi,pi-pso,fuzzy,4-area control.
INTRODUCTION
© 2017, IRJET | Impact Factor value: 5.181 | ISO 9001:2008 Certified Journal
| Page 925
controller parameters. The Kp and Ki are the variables,
which should be found with the objective minimization of Settling time.
Minimization of Setting Time
∑ ( ) (1)
with respect to constraints
(2) (3)
Where and are the minimum and the
maximum proportional gains, while and are
the minimum and maximum Integral gains obtained by experience while PI controller is used
Particle Swarm Optimization
Particle swarm optimization algorithm works on the behavior of swarm in food searching habit. The number of birds or fishes (Particle) searching for its food and the best particle shares it position to its neighborhood particle (entire population is considered as neighborhood particle) and the information is shared to entire swarm with best position in the search space. Here, food is the objective function, the particles are the population and swarm is the total population in every iteration As PSO is based on the behavior of the food search in a group of fish or bees or birds. The procedure of the algorithm is given as follows
Step 1. Assume the size of the swarm or particle (N). Usually size of 20 to 30 particles are used.
Step 2. Generate the initial population of X in the range X(l) and X(u), randomly as X1, X2, …XN.
Step 3. Evaluate the objective function value.
Step 4. Find the velocities of particles. All velocities are initially assumed as zero. All particles move towards the optimal point.
Step 5. Find the historical best value of the particles, which is known as local best, or particle best (Pbest) and find the
best particles of all the previous iterations called as global best or Gbest. Find the velocities of the particles j in ith
iteration as follows,
Vj(i) = Vj(i-1) + c1r1[Pbest – Xj(i-1)] + c2r2[Gbest-Xj(i-1)]
(13)
Where j = 1,2,…N.
c1, c2= learning factor assumed as 2
r1, r2 = Uniformly distributed random numbers
range 0 and 1.
Now find the position or coordination of the jth particle in
the ith iteration
Xj(i) = Xj(i-1) +Vj(i) (14)
Now evaluate the objective values of the above Xj.
Step 6. Check the convergence of the current solution, if the positions of all particles converge to the same set of values the method is assumed to have converged else increment the iteration number and evaluate step 5.
Results
Scenario 1 is considered as DFIG-4 area system implementation, scenario 2 is considered as 4-area, where thermal, hydro and DFIG are hybrid.
[image:2.596.310.557.353.702.2]Then for different controls considered as different cases. Case1 is applied with PI controller, case 2 is applied with PI-PSO controller and case 3 is applied with fuzzy controller.
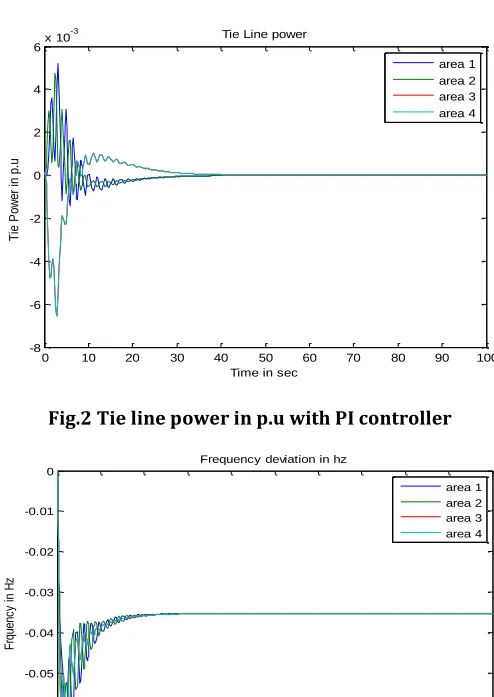
Fig.2, 5, 7,9,12,14,16,19 and 21 shows the tie line power of
three different scenarios and cases. Fig.
3,6,8,10,13,15,17,20 and 22 shows the frequency deviation of three different scenarios and cases. Here it can be seen that all the tie line power and frequency are made as zero which shows the controllability. But the settling time is different for all the scenarios and cases. Fig. 4,11 and 18 shows the convergence graph of PSO algorithm.
Scenario 1: DFIG, 4-area
Case 1: PI controller
Fig.2 Tie line power in p.u with PI controller
Fig.3 Frequency Deviation in hz with PI Controller
0 10 20 30 40 50 60 70 80 90 100
-8 -6 -4 -2 0 2 4 6x 10
-3 Tie Line power
Time in sec
T
ie
P
o
w
e
r
in
p
.u
area 1 area 2 area 3 area 4
0 10 20 30 40 50 60 70 80 90 100
-0.07 -0.06 -0.05 -0.04 -0.03 -0.02 -0.01 0
Frequency deviation in hz
Time in sec
F
rq
ue
nc
y
in
H
z
© 2017, IRJET | Impact Factor value: 5.181 | ISO 9001:2008 Certified Journal
| Page 926
Case 2: PI-PSOFig.4 PSO algorithm vs Iteration
Fig.5 Tie line power in p.u with PI-PSO controller
Fig.6 Frequency Deviation in hz with PI-PSO Controller
Case 3: Fuzzy
Fig.7 Tie line power in p.u with Fuzzy controller
Fig.8 Frequency Deviation in hz with Fuzzy Controller
Scenario 2: : Thermal, hydro 4-area
Case 1: PI controller
Fig.9 Tie line power in p.u with PI controller
0 50 100 150 200 250 300 350 400 450 500
0 5 10 15 20 25 30 35 PSO Algorithm Iterations F it n e s s V a lu e
0 10 20 30 40 50 60 70 80 90 100
-0.07 -0.06 -0.05 -0.04 -0.03 -0.02 -0.01 0
Frequency deviation in hz
Time in sec
F rq u e n c y i n H z
0 10 20 30 40 50 60 70 80 90 100
-7 -6 -5 -4 -3 -2 -1 0 1 2x 10
-3
Tie Line power
Time in sec
T ie P o w e r in p .u
0 10 20 30 40 50 60 70 80 90 100
-0.05 -0.045 -0.04 -0.035 -0.03 -0.025 -0.02 -0.015 -0.01 -0.005 0
Frequency deviation in hz
Time in sec
F rq u e n c y i n H z area 1 area 2 area 3 area 4
0 10 20 30 40 50 60 70 80 90 100
-8 -6 -4 -2 0 2 4 6x 10
-3 Tie Line power
Time in sec
T ie P o w e r in p .u area 1 area 2 area 3 area 4
0 5 10 15 20 25 30 35 40 45 50
-0.5 0 0.5 1 1.5 2 2.5 3
Frequency deviation in hz
Time in sec
© 2017, IRJET | Impact Factor value: 5.181 | ISO 9001:2008 Certified Journal
| Page 927
Fig.10 Frequency Deviation in hz with PI Controller [image:4.596.308.555.84.253.2]Case 2: PSO
[image:4.596.318.546.315.479.2]Fig.11 PSO algorithm vs Iteration
Fig.12 Tie line power in p.u with PI-PSO controller
Fig.13 Frequency Deviation in hz with PI-PSO Controller
Case 3: Fuzzy
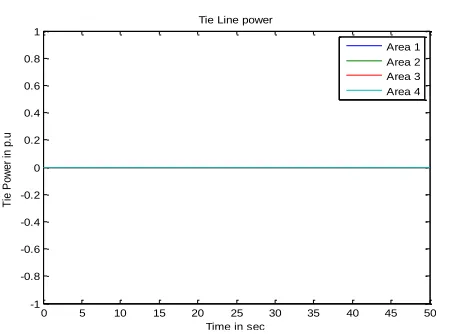
Fig.14 Tie line power in p.u with Fuzzy controller
Fig.15 Frequency Deviation in hz with Fuzzy
Controller
Table 2 shows the identified optimal values of kp and ki parameters. Table 3 shows the performance comparison of setting time and other parameters. Here the analysis is made for only settling time.
0 5 10 15 20 25 30 35 40 45 50
-1 -0.8 -0.6 -0.4 -0.2 0 0.2 0.4 0.6 0.8 1
Tie Line power
Time in sec
T ie P o w e r in p .u Area 1 Area 2 Area 3 Area 4
0 50 100 150 200 250 300 350 400 450 500 0 5 10 15 20 25 30 35 40 45 50 PSO Algorithm Iterations F it n e s s V a lu e
0 5 10 15 20 25 30 35 40 45 50
-0.5 0 0.5 1 1.5 2 2.5 3 3.5
Frequency deviation in hz
Time in sec
F rq u e n c y i n H z Area1 Area 2 Area 3 Area 4
0 5 10 15 20 25 30 35 40 45 50
-0.2 -0.15 -0.1 -0.05 0 0.05 0.1 0.15
Tie Line power
Time in sec
T ie P o w e r in p .u Area1 Area 2 Area 3 Area 4
0 5 10 15 20 25 30 35 40 45 50
0 0.005 0.01 0.015 0.02 0.025 0.03 0.035
Frequency deviation in hz
Time in sec
F rq ue nc y in H z
0 5 10 15 20 25 30 35 40 45 50
-1 -0.8 -0.6 -0.4 -0.2 0 0.2 0.4 0.6 0.8 1
Tie Line power
Time in sec
[image:4.596.323.545.510.666.2] [image:4.596.42.281.528.728.2]© 2017, IRJET | Impact Factor value: 5.181 | ISO 9001:2008 Certified Journal
| Page 928
Table 2- Identification of kp and ki values using PSO algorithm
Table 3- Performance comparison table
From the above tabular column, it can be noted that the PSO is performing better in scenario 1 and in scenario -2 fuzzy is working better. So, the fuzzy makes the system response faster.
Conclusion
The load frequency control is made with three different controllers, PI, PI-PSO and fuzzy for 4-area. The performance is compared with high speed response after fault assurance. In this paper comparison of Setting time is made and with the fuzzy it is better in higher area system and PI-PSO is better is lower area system. So the choice can be made according to the number of area of power system.
References
[1] Surya Prakash & S.K. Sinha, “Simulation based neuro-fuzzy hybrid intelligent PI control approaching four-area load frequency control of interconnected power system”, Applied Soft Computing.
[2] Wei Zhang, Yinliang Xu, WenxinLiu, and Frank Ferrese, “Fully Distributed Coordination of Multiple DFIGs in a Microgrid for Load Sharing” IEEE Transactions On Smart Grid
[3] G. Gross, J.W. Lee, Analysis of load frequency control performance assessmentcriteria, IEEE Trans. Power Syst. 16 (August (3)) (2001).
[4] D.P. Kothari, Nagrath, Modern Power System Analysis, 3rd ed., Tata McGraw-Hill, New Delhi, India, 2003.
[5] P. Kundur, Power System Stability and Control, McGraw-Hill, New York, 1994.
[6] C.L. Wadhawa, Electric Power System, New Age International Pub., New Delhi,India, 2007.
[7] O.I. Elgerd, Electric Energy System Theory: An Introduction, McGraw-Hill, 1971.
[8] J. Talaq, F. Al-Basri, Adaptive fuzzy gain scheduling for load frequency control,IEEE Trans. Power Syst. 14 (February (1)) (1999).
[9] P. Aravindan, M.Y. Sanavullah, Fuzzy logic based automatic load frequency con-trol of two area power system with GRC, Int. J. Comput. Intell. Res. 5 (1) (2009)37–44.
[10] J. Nanda, J.S. Kakkarum, Automatic generation control with fuzzy logic c controllers considering generation constraints, in: Proceeding of 6th InternationalConference on Advances in Power System Control Operation and Managements, Hong Kong, November 2003.
[11] A. Magla, J. Nanda, AGC of an interconnected hydro-thermal system using conventional integral and fuzzy logic control, in: Proceedings of IEEE Electric
UtilityDeregulation, Restructuring and Power
Technologies, April 2004.
[12] S. Prakash, S.K. Sinha, Impact of slider gain on load
kp1 ki1 kp2 ki2 kp3 ki3 kp4 ki4 Iterations Used
Scenario
1 1.0057 1.3527 1.531 1.0095 1.3447 1.7769 1.7169 1.4238 500
Scenario
2 0.122 0.52315 0.27923 0.61005 0.18447 0.76725 0.16441 0.62216 500
Scenario 1 Scenario 2
All time in secs PI PSO-PI Fuzzy PI PSO-PI Fuzzy RiseTime 4.2902 2.2254 0.28787 3.41E-05 0.0030782 0.3546
SettlingTime 29.811 12.085 14.475 8.885 9.0049 7.698 SettlingMin 0.14117 0.14117 0.051171 -0.010046 -3.0543 0.021181
SettlingMax 0.26273 0.25985 0.17738 0.53476 0.051205 0.030697
Overshoot % 86.101 84.058 246.64 76757 116600 30.462
Undershoot 0 0 0 5709700 1956.4 0
Peak 0.26273 0.25985 0.17738 2.71E+00 3.0543 0.030697
© 2017, IRJET | Impact Factor value: 5.181 | ISO 9001:2008 Certified Journal
| Page 929
frequency control usingfuzzy logic controller, ARPN J. Eng. Appl. Sci. 4 (September (7)) (2009).
[13] S. Prakash, S.K. Sinha, Load frequency control of three area interconnectedhydro-thermal reheat power system using artificial intelligence and PI controllers, Int. J. Eng. Sci. Technol. 4 (1) (2011) 23–37.
[14] S. Prakash, S.K. Sinha, Application artificial intelligent in load frequency controlof interconnected power system, Int. J. Eng. Sci. Technol. 3 (4) (2011) 264–275.
[15] S. Prakash, S.K. Sinha, Artificial intelligent & PI in load frequency control ofinterconnected power system, Int. J. Comput. Sci. Emerg. Technol. 1 (December(4)) (2010) 377–384 (E-ISSN: 2044-6004).
[16] Ibraheem, P. Kumar, D.P. Kothari, Recent philosophies of automatic generation control strategies in power systems, IEEE Trans. Power Syst. 20 (1) (2005)346–357.
[17] H. Shayeghi, H.A. Shayanfar, A. Jalili, Load frequency control strategies: astate-of-the-art survey for the researcher, Energy Convers. Manage. 50 (2009)344–353
[18] P. Ram, A.N. Jha, Automatic generation control of interconnected hydro-thermal system in deregulated environment considering generation rateconstraints, in: International Conference on Industrial Electronics, Control andRobotics, 2010, pp. 148–158.
[19] J.Y. Hung, Variable structure control: a survey, IEEE Trans. Ind. Electron. 40(February (1)) (1993).