© 2017, IRJET | Impact Factor value: 5.181 | ISO 9001:2008 Certified Journal | Page 853
Application of Particle Image Velocimetry (PIV) and Digital Image
Correlation (DIC) techniques on scaled slope models
Elena Kapogianni
1, Michael Sakellariou
21
Dr. Civil Engineer, National Technical University of Athens, 9 Heroon Polytechniou str.
Zografou, 15780 Athens, Greece
2
Professor Emeritus, National Technical University of Athens, 9 Heroon Polytechniou str.
Zografou, 15780 Athens, Greece
---***---Abstract -
In this study a review is carried out on theadvanced use of Particle Image Velocimetry Analysis (PIV Analysis) and Digital Image Correlation Techniques (DIC Techniques), to a series of physical model tests performed over the last 5 years. Several dry and semi-submerged scaled slope models have been built and tested under enhanced gravity at the ETH Zurich drum geotechnical centrifuge and on the one degree of freedom earthquake simulator at the National Technical University of Athens (NTUA). During these tests, PIV and DIC techniques have been applied, as well as optical fibre measurements, with main goal to define failure mechanisms and strains developed. Correspondent prototype numerical models have also been built with the use of the finite element stress analysis technique. The wide range of applications and the combination of image analysis with other techniques in order to provide comprehensive results about the behavior of the actual geotechnical models is presented and discussed. The physical model tests have also high educational interest.
Key Words: Physical Modelling, Geotechnics, Seismic
loading, Shaking Table, Centrifuge, Image Analysis, Slopes.
1. INTRODUCTION
Experimental investigation of geotechnical constructions is commonly applied in order to provide useful information concerning their behaviour during various loading events. It is performed either by means of full scale testing or by using small scale physical models and static or seismic loading can be applied in order to define stress levels and kinematically admissible collapse mechanisms [1], [2], [3].
In the design phase of the physical model tests, apart from scaling laws and model preparation, attention should be paid to measurement systems that are used [4], [5], [6]. Load cells are commonly applied to measure forces acting in the soil, pore pressure and degree of saturation can be determined by means of suitable transducers and classical deformation measurements are made using Linear Variable Differential Transformers (LVDTs) as well as linear potentiometers [7]. Strain measurements are also very important and involved in many material properties and parameters such as stress-strain curve, Poisson’s ratio, Young’s modulus etc. By using conventional instruments that measure strains, information only about specific points inside the area of interest are provided. Creating strain maps with the use of additional sensors would be very expensive
and not practical since the large amount of sensors inside a scale model would alter its characteristics and would affect the results. Image analysis methods such as Particle Image Veolocimetry (PIV) and Digital Image Correlation (DIC) techniques can provide full field strain measurements on the experimental models and contour map of strains can be created at the entire area of interest.
Particle Image Velocimetry (PIV) analysis is a velocity measuring technique which was originally applied in the field of experimental fluid mechanics [8]. PIV analysis has also been used to observe soil behaviour in physical modelling of geotechnical constructions [9], [10], [11], [12]. In the current study, GeoPIV [13] is applied in order to define strains and failure mechanisms on scaled slope models, during various loading scenarios. GeoPIV is a MatLab module which implements PIV in a manner suited to geotechnical testing, in order to gather displacement data from sequences of digital images captured during the tests. The Digital Image Correlation (DIC) technique [14], [15] is an optical method that uses correlation analysis in order to examine digital images of models, taken during various loading scenarios, such as self-weight and external loading. Consecutive images are captured with a digital camera during the deformation period and the changes on the surface characteristics are recorded and evaluated. The small or large scale models need to be properly prepared in order to apply the method. A reference image before loading begins is necessary to be taken and then a series of digital images during the deformation process. By using the appropriate computer software the deformed images are compared to the reference image by correlating all the pixels and strain distribution map can be created. In the current study Vic2D [16] that uses optimized correlation algorithms to provide full-field displacement and strain data on planar specimens is applied.
2. PIV AND DIC APPLICATIONS ON SLOPE MODELS
© 2017, IRJET | Impact Factor value: 5.181 | ISO 9001:2008 Certified Journal | Page 854 In particular, scaled reinforced slopes were accelerated
progressively up to 50g in the geotechnical centrifuge and PIV Analysis via GeoPIV code was applied. Optical fibre sensors were attached on the reinforcement layers and linear strains were measured during the increasing of the g-level [19] [20]. Correspondent full scale numerical models were also analyzed via a finite element stress analysis code [21]. In total, three different approaches were used for the investigation of the models, providing a comprehensive view of their behaviour. The combination of these methods was performed for the first time for the purposes of this study and individual results have been presented also in the past.
Additionally, dry slope models, stabilized by a vertical retaining wall were tested and failure mechanisms during seismic loading events up to 0.24g and 0.36g were defined, with the use of PIV Analysis via GeoPIV code. Landslide phenomena, scour and soil erosion mechanisms due to water were also studied via Vic2D and representative results are demonstrated. To the authors’ knowledge study of semi-submerged slopes via Vic2D was performed for the first time for the purposes of the current study.
3.
SCALES REINFORCED SLOPES IN THE
GEOTECHNICAL CENTRIFUGE
Several wrap-around reinforced sand slope models were built with the same geometry inside a strong box with dimensions 400 by 400 mm in plan and 200 mm in height. The facing slope inclination was 2V:1H and the total height of the model at 200 mm. The height of the reinforced soil slope was 180 mm and was built on a 20 mm layer of sand. Scaled reinforcement layers with length 110-190 mm were uniformly spaced every 20 mm. The soil material used was Perth sand from the west coast of Australia. Perth sand is white, fine grained sand with rounded grains, with angle of deposition is between 310 to 330 and diameter of the grains between 0.125-0.5 mm. This soil is classified as uniform sand [21].
The models were built layer after layer using dry pluviation with constant flow rate and distance to the model in order to achieve a constant density of the sand D≈60%. To be able to stabilise the model for the transfer to and the instalment into the centrifuge a predefined small amount of water was added layer for layer throughout the construction to provide suction. Most of the water was removed through tubes on the strong box that were open during the increasing of g-level.
A transparent Plexiglas plate was used on one side of the box to enable side viewing of the models during the tests. Additionally, a painted grid pattern was printed on it in order to measure deformations developed on the models using digital images and PIV analysis. The digital images were gained during all loading events with a high speed camera from Mikrotron [22] that was placed near the strong box on the side of the Plexiglas. Moreover, an amount of black coloured sand was placed inside the model and near the Plexiglas side to achieve contrast with the usual yellow coloured sand so that the deformations patterns will be more visible during PIV analysis. Further information about
[image:2.595.309.561.226.397.2]the test setup can be found in Kapogianni et al. [10], [19]. Details about the sand used are given in Arnold and Laue [23]. Textile embedded optical fibre strain sensors SG were attached at various positions on the reinforcement sheets in order to measure the development of strains during the different loading events. Ιn Figure 1 the model making procedure and test set up can be seen and in particular the optical fibre sensors on the reinforcement layers, the grid pattern and photogrammetric target sheet used for calibration during the GeoPIV analysis, the reinforced slope model built and an inside view of the geotechnical centrifuge.
Figure 1. Model making and test set up.
GeoPIV code was used in order to study the behaviour of the reinforced slope models during the increasing of the g-level in the geotechnical centrifuge. In Figure 2 an example of the analysis process can be seen as well as a comparison of the flow vectors created during the increasing of the g-level from 5g to 50g.
Figure 2. GeoPIV analysis process and flow vectors at 5g and 50g-level.
[image:2.595.309.563.513.660.2]© 2017, IRJET | Impact Factor value: 5.181 | ISO 9001:2008 Certified Journal | Page 855 strains also occur, due to the small predefined amount of
[image:3.595.41.284.133.291.2]water that flows out of the model during the increasing of the g-level.
Figure 3. Strain field at and flow vectors at 5g and 50g.
Linear strains developed inside the slope models were recorded via optical fibre sensors attached on the reinforcement sheets. In Figure 4, some representative measurements are demonstrated for g-level up to 50, as well as the location of the optical fibre sensors on the PIV analysis strain map for g-level equal to 50. During GeoPIV analysis, shear strains were defined and therefore a comparison with the linear strain optical fibre measurements on the reinforcement sheets (x-x axis) could not be achieved. Representative correspondent prototype numerical models results are also noted. The failure mechanisms that derived by the finite element stress analysis of the prototype models were located after the reinforced soil mass end and near the vertical boundaries of the slope models. Investigation of the boundary effect was also performed and the results demonstrate that the failure mechanisms of the numerical models with limited boundaries were in good coherence to the correspondent ones of the experimental models. Further details of the numerical analysis can be found in Kapogianni et al [20].
Figure 4. Physical and numerical modelling of reinforced slopes.
The combination of physical modelling on scaled reinforced slopes in the geotechnical centrifuge, incorporating image analysis technique via GepPIV and optical fibre sensors, with correspondent prototype numerical models was successfully performed during the current study. The optical fibre measurements provided useful information about the insight of the slope, while via the GeoPIV analysis, the shear strain map on the side of the slope models was created. The numerical modelling results were compared to the correspondent experimental ones. The methodology proposed can be applied on other geotechnical constructions and loading conditions, however further study should be made concerning the comparison of linear strain measurements via the optical fibre sensors with the GeoPIV shear strain analysis results.
4. STABILIZED DRY SLOPES SUBJECTED TO SESIMIC
LOADING
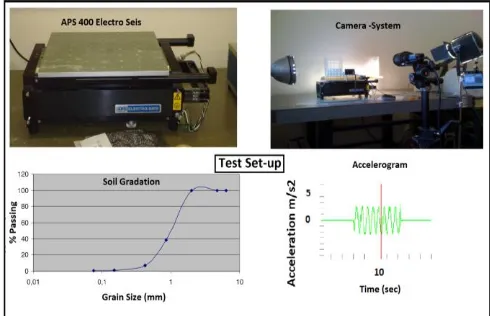
[image:3.595.318.563.429.587.2]GeoPIV was also used for the photogrammetric analysis of scaled dry slopes under seismic conditions. The models were stabilized by a vertical diaphragm wall and failure was achieved via seismic loading application, equal to 0.24g and 0.36g for time period t=20 sec. The test set-up is presented in Figure 5 and in particular the APS 400 Electro-Seis one degree of freedom shaking table, the camera set up for the digital images recording, the soil gradation and a characteristic accelerogram.
Figure 5. Test set –up, soil gradation and accelerogram.
[image:3.595.37.295.574.735.2]© 2017, IRJET | Impact Factor value: 5.181 | ISO 9001:2008 Certified Journal | Page 856 Figure 6. Slope model imposed to seismic loading and
sand particle displacement.
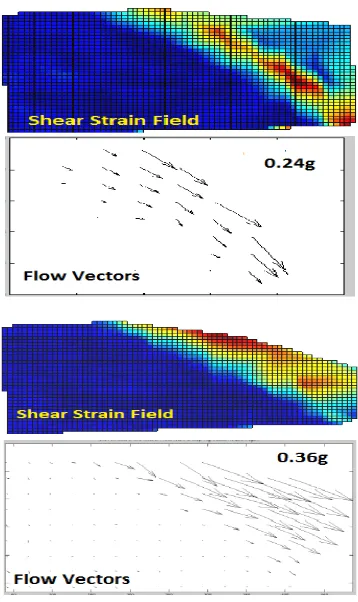
[image:4.595.343.518.236.556.2]In Figure 7, the results by the GeoPIV analysis at an intermediate phase of the loading procedure are presented and in particular the flow vectors and the correspondent strains. It can be noted that for lower seismic loading flow vector density is smaller as expected, as well as the strain field that reflects the wedge failure mechanisms for both cases.
Figure 7. Flow vectors and failure mechanisms at an intermediate phase of loading procedure.
The model was built again and scaled reinforcement sheets (geosynthetics) were used for stabilization of the slope at angle approximately equal to 700. Seismic loading equal to 0.36g was imposed and the results are presented in Figure 8. In particular, sand particle movements, flow vectors and the strain field can be noted at an intermediate phase of the loading procedure, concluding that the stabilization via reinforcement was very efficient, leading to smaller slope displacements for higher seismic loading. The failure mechanism is located after the reinforced soil mass end, rather than the face of the slope, as expected.
Figure 8. GeoPIV analysis at reinforced slope model, at an intermediate phase of seismic loading equal to 0.36g.
[image:4.595.70.249.449.750.2]© 2017, IRJET | Impact Factor value: 5.181 | ISO 9001:2008 Certified Journal | Page 857 is reflected clearly and the diaphragm wall, in conjunction
[image:5.595.312.559.120.257.2]with the slope built on the right side of the wall leaded to stabilization of the model at a very high seismic loading equal to 0.5g.
Figure 9. Stabilized slope model and strains developed at an intermediate phase of the loading procedure.
The results that derived by the PIV and DIC analysis of stabilized dry slopes subjected to seismic loading gave a comprehensive view of their structural response. In particular, slopes stabilized by a retaining wall were analyzed via GeoPIV, shear strains were defined as well as the wedge failure mechanisms for 0.24g and 0.36g. For higher seismic loading, failure was bigger and the mechanisms were located near the face of the slope. Additionally, reinforced slopes were tested, where seismic loading equal to 0.36g was applied and the results demonstrated higher stability, as expected, as well as displacement of the failure mechanism location after the reinforced soil mass end. Dry slopes with a vertical diaphragm wall used for stabilization and a slope on the right side of the wall were also built and tested at high seismic loading equal to 0.5g and DIC analysis via Vic2D was successfully performed. Strains at x-x, y-y and x-y axis were defined as well as the wedges created during the seismic loading.
5. SEMI-SUBMERGED SLOPES AND SOIL EROSION
The dynamic response of semi-submerged slopes, scour and soil erosion were also studied at the one degree of freedom earthquake simulator of NTUA. Scaled slope models were built and tested and Image Analysis techniques were applied in order to define their behaviour and failure mechanisms.
Slopes with dimensions 170 and 150 mm in plan, 100 mm in height and slope inclination equal to 280 were built inside a Plexiglas box. A predefined amount of water was added up to 50 mm height and seismic loading equal to 0.3g was applied for time period t=20 sec. The beginning of the slope failure was observed for seismic loading equal to 0.16g and s presented in Figure 10. The flow vectors and strain map were defined via GeoPIV analysis and are presented for an intermediate phase of the loading procedure, as well as the failure mechanism that is located near the face of the slope
models. As can be noted, the predefined amount of water added leaded to erosion of its surface.
Figure 10. Semi-submerged slope model and GeoPIV Analysis at an intermediate phase of the loading
procedure.
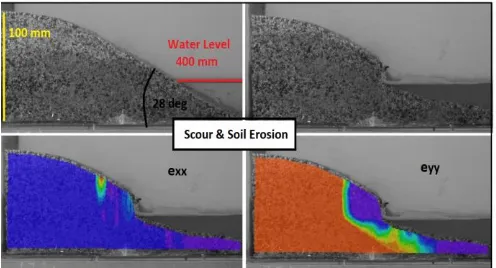
[image:5.595.40.284.147.267.2]The behaviour of the semi-submerged slopes was also studied via DIC analysis. Τhe slope height was 100 mm, the angle of repose 280 and a predefined amount of water was added up to 40mm height. Maximum seismic loading equal to 0.3g was applied for time period t=20 sec and in Figure 11 the model after the loading procedure can be seen, as well as strains developed in y-y and x-x axis. The results demonstrate the erosion of the soil due to the water level during seismic loading and the phenomenon is reflected more clearly at the eyy strain field. During the model making procedure, the predefined amount of water added reached the upper layers of the slope model, resulting to increase of soil strength, leading to scour of its surface due to suction. This phenomenon was illustrated by the DIC analysis.
Figure 11. Semi-submerged slope model and DIC Analysis.
[image:5.595.309.557.495.629.2]© 2017, IRJET | Impact Factor value: 5.181 | ISO 9001:2008 Certified Journal | Page 858 Figure 12. Semi-submerged slope model stabilized by a
retaining wall.
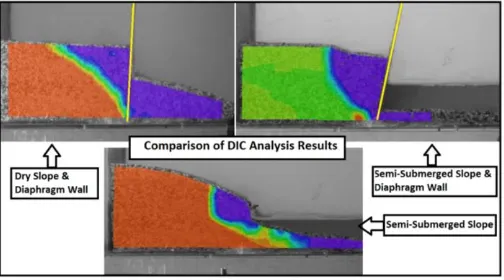
The dynamic response of semi-submerged slopes and soil erosion was successfully studied via GeoPIV and Vic2D analysis and the results presented demonstrate strains developed as well as the correspondent failure mechanisms. During GeoPIV analysis, shear strains were defined, while via Vic2D, strains on y-y axis were reflected more clearly. Soil erosion was presented in Figures 10 and 11, while in Figure 12 the phenomenon was limited due to the diaphragm wall placed for stabilization. In Figure 13 a comparison of the soil failure due to seismic loading is presented between the dry slope stabilized by a vertical retaining wall (Fig. 9), the semi-submerged slope without retaining wall (Fig. 11) and the semi-submerged slope with a retaining wall (Fig.12). The comparison is performed in terms of strain at y-y axis (eyy) and it can be noted that failure of the dry slope, stabilized by a vertical wall was smaller as expected, while soil erosion of the semi-submerged slope without stabilization was very high as well as scour of its surface due to suction. At the semi-submerged slope stabilized via the retaining wall, strains on y-y axis are medium.
Figure 13. Comparison of strains developed in y-y axis, due to seismic loading.
6. CONCLUSIONS
In this study, several scaled slope models were built and tested under enhanced gravity in a geotechnical centrifuge and on a one degree of freedom earthquake simulator and Particle Image Velocimetry analysis and Digital Image Correlation techniques were applied. Optical fibre
measurements were incorporated in the centrifuge tests and correspondent prototype numerical models were built for comparison with the experimental results. Dry and semi-submerged sand slopes were also tested, under seismic loading and failure mechanisms were defined, as well as soil erosion and scour due to suction, via Image Analysis techniques. The results have also high educational interest since various phenomena correlated to slopes (stabilized or not) are reflected.
Concerning the centrifuge loading of scaled reinforced slopes, linear strain (x-x axis) optical fibre recordings were higher for higher g-level and at the lower level of the models, due to the overburden, as expected. GeoPIV analysis reflected the failure mechanisms and shear strains, after the reinforced soil mass end. The numerical results of the correspondent prototype models that derived by the application of the finite element stress analysis were in good coherence with the image analysis results. The combination of physical modelling on scaled reinforced slopes, incorporating image analysis techniques via GepPIV and optical fibre sensors, with correspondent prototype numerical models was performed for the first time in the current study and provided with a comprehensive view of the slope’s behaviour. The methodology used can potentially be applied on other geotechnical constructions.
The results that derived by the PIV and DIC analysis of stabilized dry slopes subjected to seismic loading gave a comprehensive view of their structural response. Slopes stabilized by a retaining wall were analyzed via GeoPIV and wedge failure mechanisms were defined. Reinforced slopes were also tested and higher stability for higher seismic loading was observed, as expected. The failure mechanisms of the reinforced slopes were located after the reinforced soil mass end. Dry slopes with a vertical wall used for stabilization and a slope on the right side of the wall were also built and tested at high seismic loading and DIC analysis was successfully performed. The failure mechanisms demonstrated the wedge created during the seismic loading and strains at x-x, x-y and y-y axis were defined.
The dynamic response of semi-submerged slopes, scour due to suction and soil erosion were also studied via GeoPIV and Vic2D and the results presented demonstrate strains developed as well as the correspondent failure mechanisms. During the model making procedure, the predefined amount of water added reached the upper layers of some of the slope models, resulting to increase of soil strength and leading to scour of their surface due to suction. A comparison of the soil failure due to seismic loading was made between a dry slope stabilized by a vertical diaphragm wall, a semi-submerged slope without retaining wall and a semi-submerged slope with a diaphragm wall. Failure of the dry slope, stabilized by the wall was smaller as expected, while soil erosion of the semi-submerged slope without stabilization was very high as well as scour of its surface due to suction. At the semi-submerged slope stabilized via the retaining wall, strains were of medium strength. To the authors’ knowledge, the application of DIV techniques at semi-submerged slopes subjected to seismic loading was successfully performed for the first time for the purposes of the current study.
[image:6.595.39.291.515.655.2]© 2017, IRJET | Impact Factor value: 5.181 | ISO 9001:2008 Certified Journal | Page 859 technology, as well as Image Analysis techniques, such as PIV
and DIC, can give useful information about the geotechnical behaviour of the models and the actual methods used and can be complimentary to each other. Apart from slope models, the techniques presented in the current study can potentially be used in other kind of geotechnical structures subjected to centrifuge and/or seismic loading.
ACKNOWLEDGEMENT
The first author is grateful for financial support provided by the State Scholarships Foundation of Greece (IKY), during the "IKY Fellowships of Excellence for Postgraduate Studies in Greece-Siemens Programme”.
REFERENCES
[1] Mayne, P.W., Coop, M.R., Springman, S., Huang, A-B., &
Zornberg, J., 2009. “GeoMaterial Behavior and Testing”, State-of-the-Art Paper, Proceedings of the 17th International Conference in Soil Mechanics & GeotechnicalEngineering, Vol. 4, Alexandria, Egypt.
[2] Balachandran, S. & Springman, S.M. 1997. Prediction of
front wall deformation of reinforced soil walls. Subrahmanyam (ed.). International Conference on Ground Improvement Techniques. ISBN 981-00-8899-X, Macau. 41-51.
[3] Springman, S.M., Balachandran, S. & Jommi, C. 1997.
Modelling pre-failure deformation behaviour of reinforced soil walls. Geotechnique. 48(3):653-663.
[4] Garnier, J. Gaudin, C., Springman, S.M., Culligan, P.J.,
Goodings, D., Konig, D., Kutter, B., Philips, R., Randolph, M.F. & Thorel, L. 2007. Cataloge of Scaling laws and similitude questions in geotechnical centrifuge modelling. International Journal of Physical Modelling in Geotechnics. 7(3):1-23
[5] Viswanadham, B.V.S. & Mahajan, R.R. 2007. Centrifuge
model tests on geotextile-reinforced slopes. Geosynthetics International. 14(6):365-379.
[6] Zornberg, J.G., Mitchell, J.K., & Sitar, N., 1997. Testing of
Reinforced Soil Slopes in a Geotechnical Centrifuge. ASTM Geotechnical Testing Journal, Vol. 20, No. 4, December, pp. 470-480.
[7] Laue, J. 2002. Centrifuge Technology. In Springman, S.M.
(ed.). Constitutive and Centrifuge Modelling: Two Extremes. 75-112. Balkema.
[8] Adrian R.J., 1991. Particle imaging techniques for
experimental fluid mechanics. Annual review of fluid mechanics 23:261-304.
[9] Cilingir, U. & Madabhushi, S.P.G., 2010. Particle Image
Velocimetry analysis in dynamic centrifuge tests. 7th International Conference on Physical Modelling in Geotechnics, Zurich, Switzerland.
[10] Kapogianni, E., Laue, J. & Sakellariou, M., 2010a.
Reinforced slope modelling in a geotechnical centrifuge, 7th International Conference on Physical Modelling in Geotechnics, Zurich, Switzerland.
[11] Wolinsky, E.D. & Take, W.A., 2010, Measurement of
landslide PIV acceleration using PIV image analysis.7th International Conference on Physical Modelling in Geotechnics, Zurich, Switzerland.
[12] Sharma,J.S., 2002. Measurement of displacements:
Trends or numbers?. In Springman, S.M. (ed.). Constitutive and Centrifuge Modelling: Two Extremes. 249-256. Balkema.
[13] White, D.J., Take, W.A. & Bolton 2001. M.D. Measuring
soil deformation in geotechnical models using digital images and PIV analysis. 10th International Conference on Computer Methods and Advances in Geomechanics. Tucson, Arizona. 997-1002.
[14] Sutton, M.A., Orteu, J.J. & Schreier, H.W., 2009. Book -
Image Correlation for Shape, Motion and Deformation Measurements, Hardcover.
[15] Keating, T.J., Wolf, P.R., & Scarpace, F.L., 1975. An
Improved Method of Digital Image Correlation. Photogrammetric Engineering and Remote Sensing 41(8):993-1002.
[16] Correlated Solutions, 2009. Vic2D Manual.
[17] Springman, S.M., Laue, J., Boyle, R., White, J. & Zweidler,
A. 2001. The ETH Zurich geotechnical drum centrifuge. International Journal of Physical Modelling in Geotechnical Engineering. 1(1):59-70.
[18] APS Dynamics, 2014. APS 400, Electro Seis Manual.
[19] Kapogianni, E., Laue, J., Sakellariou, M. & Springman,
S.M., 2010b. The use of optical fibers in the centrifuge, 7th International Conference on Physical Modelling in Geotechnics, Zurich, Switzerland.
[20] Kapogianni, E., Sakellariou, M.G. & Laue, J., 2017.
“Experimental Investigation of Reinforced Soil Slopes in a Geotechnical Centrifuge, with the Use of Optical Fibre Sensors”, Geotechnical and Geological Engineering, Vol. 35 (2), pp. 585-605.
[21] Nater, P., 2006. Belastungs- und Verformungsverhalten
von geschichteten Bodensystemen unter starren Kreisfundationen. PhD Thesis, ETH Zurich.
[22] Chikatamarla, R., Laue, J. & Springman, S.M. 2006.
Centrifuge scalling laws for freefall guided events including rockfalls. International Journal of Physical Modelling in Geotechnics. 2:14-25.
[23] Arnold, A. & Laue, J. 2010. Modelling of the behaviour of
© 2017, IRJET | Impact Factor value: 5.181 | ISO 9001:2008 Certified Journal | Page 860 International Conference on Physical Modelling in
Geotechnics. Zurich, Switzerland.
BIOGRAPHIES
Dr. Elena Kapogianni, Civil Engineer, National Technical University of Athens
Professor Emeritus Michael Sakellariou, National Technical University of Athens