© 2018, IRJET | Impact Factor value: 6.171 | ISO 9001:2008 Certified Journal | Page 1343
SOFTWARE SOLUTION FOR PRODUCTION PLANNING AND SCHEDULING
Anand Potadar
1, Shivakumar S
21Asst.Professor,Dept. of SGBIT,Belagavi,Karanataka,India
2Professor,Dept.of Googte Institute of Technology, Belagavi,Karanataka, India
---***---Abstract -Production planning and scheduling are the major functional task in any organization. Proper planning of production and scheduling activity will lead to reduced lead time for manufacturing, improved productivity, meeting delivered date of products with desired quantity. In competitive world every organizations objective is to satisfy the customer, proper production planning will guide towards goals. Production is basically the process by which raw material and other inputs are converted into final products. For effective production planning the one of the factors effecting is capacity of the organization. Capacity is the rate of production capability of the organization. Capacity planning are taken based mainly on the demand forecast and the sources available with the company. Efficient capacity planning is the vital to the growth and survival of the company.The research paper gives a detail representation of a software module assisting daily needs of production and scheduling problems in a industry. The software is a user interface for preparing monthly production plan and converting into daily requirement with the constraints of capacity of the plant and scheduling the work according to the priority decision rules.
Key Words: Material requirement planning(MRP), Master production shceduling(MPS),Critical ratio, Forecasting
1. INTRODUCTION
When an organization carries out demand forecasting it will come to know the possible demand of the customer .once they came to know the demand, the organization gears up all the activities to meet the demand. Here the production planning comes into the picture .production planning is nothing but utilizing the resources of the firm and meeting the customer demand and finally satisfying the customer by delivering the product on time. Production planning roughly decides the amount of capacity needed, size and quality of labor needed, material needed etc to produce the targeted output over a period of time. Production planning is differing from scheduling. Scheduling is the short term plan and it sequences the jobs of the customer whereas production plan is for longer period. Along with forecasting, production planning is done in order to have broad based output achievement plan in any firm .it’s the production that schedule the activities of the customer based on the MPS and MRP. Production plan is done mostly by the upper middle management. The planet earth has two important ingredients for production: people and Natural resources, production are nothing but the exploitation of
these recourses by gaining benefits and raising the standard of living of members of our society Production plan is the process of planning of producing desired quantity and determining timing of producing the output over an intermediate time horizon and is based on demand forecast and business plan of the firm. So for a given forecast, a firm makes the best possible use of material, machines, and capitals to reach the target demand.
2. PROBLEM DEFINITION AND OBJECTIVE
2.1 Problem definition
Production planning is nothing but utilizing the resources of the firm and meeting the customer demand and satisfies the customer by delivering the desired product on time. Failing to meet the delivery date with a desired quantity. Entire Production plan is manually carried out with a help of production team. Any manual error in plan will affect the process in negative way Priority decision rules are followed randomly.
2.2 Objective
The work carried out will propose the software solution that will improve the exiting method of planning and scheduling. Prepare report on monthly production plan and convert monthly plan into the daily plan by considering the capacity of the firm. Generate a proper ordering procedure, Prepare document of different items with delivery dates. Forecast the future demand and schedule the production activities in order to ensure maximum utilization of the firm capacity. Update the schedule based on the urgency and profit. Save and add every detail of the of the customer.
2.3 Variables
© 2018, IRJET | Impact Factor value: 6.171 | ISO 9001:2008 Certified Journal | Page 1344 System capacity
Maximum output of the products that the system of worker, machines etc having capacity to manufacture as an integrated whole. It’s noted that system capacity ≤ design capacity. The reason is that system may be limited by the product mix, quality specification or the current balance of the equipment and labor. The actual demand may be even less, for its affected by short term factors such as actual demand, equipment breakdowns, personnel absences or productivity. The existing daily capacity of the plant is 40,000 tones, 300-350 boxes 5-6 patterns. In soft ware these are used as constraints for producing daily production plant.
Type of customer- there are fixed 25-30 customers orders the firm receives order, the details of the customer such as part no, part name, email address, contact no, etc are taken and stored in the data base MS Access. Types of order-(random, weekly, or monthly) - since the demand is fluctuating in nature because of the trend and seasonal factors. No. of machining parts and machining times- some customer demands for machined components after casting. So machining time of the parts of the customers are calculated and it’s taken care while schedule this type of customer, by taking care of the due date of the customer. Number of profitable parts-some customer is profitable for the organization but they need parts in urgency. Loosing these customers will lead to high financial loose for the organization. So selecting these customers while scheduling is the important part of the project. Delivery dates and order dates-every customer has due date, within that the organization should cast and machine (if required) and finish and packed and deliver to the customer. The order date is the date on which the customer approach to the organization and organization plan for the production and commence the production process. Numbers of production days available- based on the due date and order date, the available days calculation are done. The calculation should consider holidays also. Weight – the weight of the casting after solidification, the weight of Cast will be measured and it should be according to the design of the casting. The weight is measured in terms of kgs. Quantity / Heat- how much quantity of casting are completed for one set of heat. Eg, quantity of heat is 6 that means 6 casting will complete for 1 heat. Pattern- patterns are the replica of the final castings, patterns are usually made of the aluminum, and mild steels etc. some customer send patterns along with the orders and some needs to be manufactured by considering the pattern design. On single patterns some times more than one part are designed to utilize the size on the mould boxes and materials. Boxes- the cope and drag for enclosing the casting are termed as boxes. The above are the following variables which are included in the production plan.
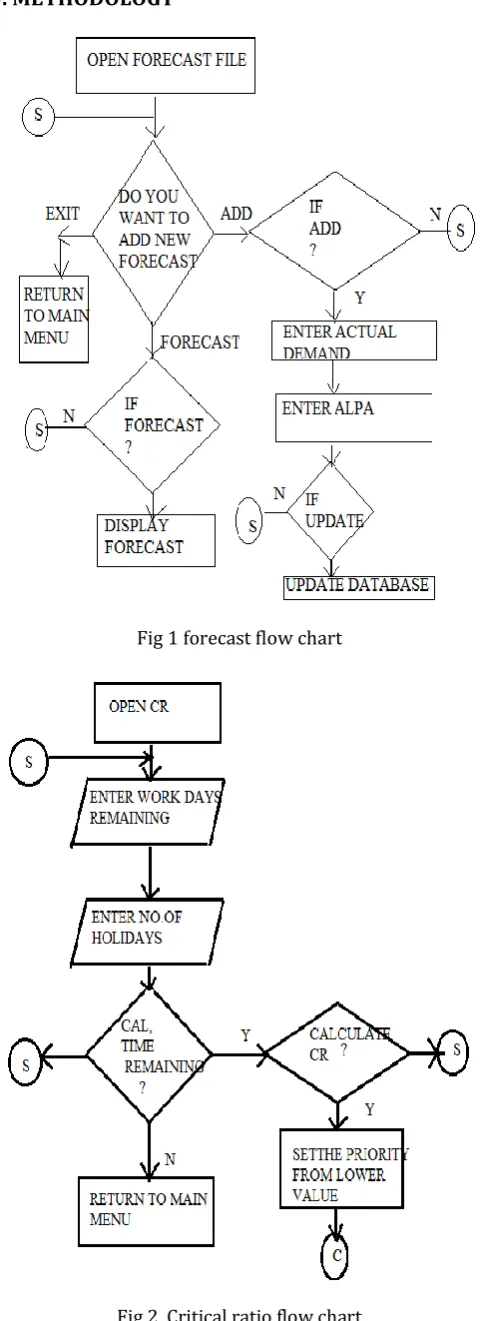
[image:2.595.314.555.89.750.2]3. METHODOLOGY
Fig 1 forecast flow chart
[image:2.595.319.554.107.404.2]© 2018, IRJET | Impact Factor value: 6.171 | ISO 9001:2008 Certified Journal | Page 1345
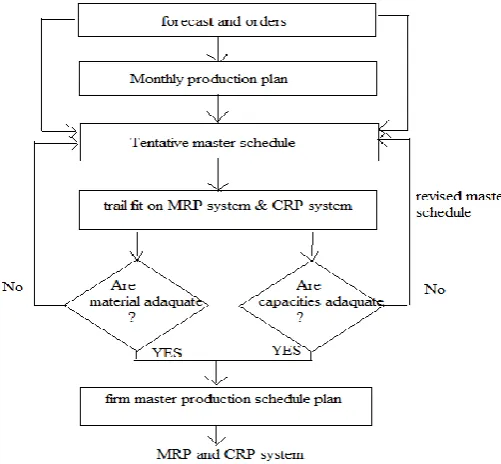
Fig 3 Master production schedule flow chart
Formulae
1. TONNAGE= Total quantity × weight of each in kg = batch quantity × weight of each in kg
2. HEAT = Total quantity/quantity per heat
= batch quantity/ quantity per heat 3. BOXES = total quantity/ no. of pattern ( cavity)
=batch quantity/ no. of pattern (cavity) 4. NO. OF DAYS REQUIRED TO COMPLETE= total
quantity/batch quantity
5. AVAILABLE DAYS = order delivery date-machining days-holidays
4. RESULTS AND DISCUSSION
Placing Order user has to place a order by specifying the details regarding customer item. The details such as customer name, part name, material , part no, weight of the item( kgs), quantity /heat, no. of cores, core weight, no. of patterns, total demand ( total quantity), quantity / batch. Depending upon the forward scheduling or backward scheduling, the user has to specify the date of production and the date of the due.
The software is going to calculate the available days (production days) for the customer to meet and complete the total demand using below formula
Production days= (order date)-(due date)-(machining days)-(no. of holidays present in between order Date and due date).The software is going to calculate in how many days it will completes the demand of the customer ,by specify the quantity / batch.
The no. of days required to complete is
=
The user is going to make changes in the form so that the no. of days required to complete is within the production days (available days) .These details of the customer are stored in the data base MS Access. The user can access it in the data base.
Fig 4 inputs and outputs of master productions scheduling Critical ratio, which provides a priority index number that represent the ratio of time remaining to work remaining. Critical ratio comes under dynamic scheduling and it’s effective for the advance scheduling, and it can be constantly updated daily, weekly to provide close and timely control. The CR is designed in such way that it will give a priority to those customers who most urgently need to work so that it can be delivered on schedule.
Customer with a CR less than 1, are behind the schedule. If CR equals to 1indicates that customers are on schedule. If CR is greater than 1, the customer has some slack. Stated in terms of date.
Critical ratio (CR) = date of due- today date / lead time remaining
[image:3.595.316.567.288.520.2]© 2018, IRJET | Impact Factor value: 6.171 | ISO 9001:2008 Certified Journal | Page 1346 work to work days remaining. Critical ratio is come under
[image:4.595.30.296.268.695.2]the dynamic scheduling. It’s effective for the advance scheduling, and it can be constantly updated daily, weekly to provide close and timely control. The CR is designed to give priority to those customers who most urgently need to work so that it can be shipped on schedule. Customer with a CR less than 1, are behind the schedule. If CR equals to 1indicates that customers are on schedule. If CR is greater than 1, the customer has some slack. The user has to specify the due date, work days remaining and holidays. Based on this inputs the software is going to calculate CR and schedule the customer based on their CR value. Based on these CR value the software produce the production plan.
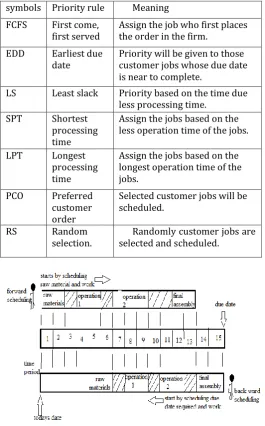
Table 1 some priority rules and their meaning
symbols Priority rule Meaning FCFS First come,
first served Assign the job who first places the order in the firm. EDD Earliest due
date Priority will be given to those customer jobs whose due date is near to complete.
LS Least slack Priority based on the time due less processing time.
SPT Shortest
processing time
Assign the jobs based on the less operation time of the jobs.
LPT Longest
processing time
Assign the jobs based on the longest operation time of the jobs.
PCO Preferred customer order
Selected customer jobs will be scheduled.
RS Random
[image:4.595.29.295.268.707.2]selection. selected and scheduled. Randomly customer jobs are
Fig 5 forward and backward scheduling
Forecasting helps to find the demand of the next month. To calculate the new forecast, the method of forecasting used is simple exponential smoothing.
The formula used to calculate new forecast is
Ft = Ft-1 +α (Dt-1 -Ft-1) Where Ft= new forecast.(forecast for the next period ).Ft-1= old period forecast (previous period forecast) α = smoothing constant and the value lies between 0≤α≤1 .Dt-1 = actual demand for the period t-1
SILENT FEATURES OF THE SOFTWARE
Visual basic.net is name of the application used by the company production manager to run the application and generate the required reports. MS Access is used as a data base to store the data. ‘Standard Setup Package’ is developed to install and/or uninstall the Executable File of the Software. Database is designed in such a way as to keep redundancy at a minimum level, to avoid duplication of data and in-turn making the system cost effective by keeping the memory requirement low. All the forms are designed in Visual Basic.net to make the user interaction easy, neat and effective. Graphical User Interface’ helps in visualizing the whole system more quickly thus making the software extremely user friendly. ‘User Inputs’ are kept to a minimum to reduce the clerical work. Forms are designed to suit their requirements and allow the user to get familiarized with the system more quickly. Where ever possible ‘Combo Boxes’ & ‘List Boxes’ are provided for user entry. This helps in preventing wrong data entry or even wrong format of data entry. It also minimizes the errors arising due to typing mistakes. Another advantage is that it maintains uniformly of information within the fields. Reports are designed such that ‘maximum possible information’ is displayed at single click. Reports are generated such that they can be helpful in ‘problem analyses & ‘decision-making’. Help files are designed for the convenience of the user. User can refer these help files at any time with minimum effort, to get tips in some key areas.
5. CONCLUSION
© 2018, IRJET | Impact Factor value: 6.171 | ISO 9001:2008 Certified Journal | Page 1347 Priority decision rules (FCFS, EDD, LPT, and SPT) helped to
determine the sequence in which the customer jobs will be done. The implementation of this software can reduce the time lost in generating various reports thereby reducing the burden on the personnel. The amount of paper work can be kept down to a bare minimum as the data is provided to the user in an integrated and more concrete manner. Generation of the reports on the computer can improve the legibility of work done. Manual references of production plan and master production scheduling detail/reports has been replaced by computerized information. A method /procedure to capture past experience have been developed. Providing classified /accurate information to inexperienced personnel.
REFERENCES
1. Joseph G. Monks : “Operation management”, McGraw Hill
2. MartandTelsang : “Industrial engineering and Production Management” ,S Chand and company
3. Samuel Elion : “ Elements of production planning and control”, Universal publications.
4. O.P.Khanna: “ Industrial engineering and Management”
5. Prem Kumar gupta& D.S. Hira : “Operation management”, Sultan chand& Sons Delhi
6. P. Rama Murthy: “ Production and Operation management” , New Age International Ltd.
7. D.C.Sancheti& V.K. Kapoor: “ quantitative methods” , sultandchand& Sons
8. Evangelospetroutsos : “Mastering Visual Basic”, BPB Publication ,New Delhi
9. A Complete References: “ Visual Basic.Net” , Tata Mc-Graw –hill
10. Jeffery O.ullman: “ Principle of Data base System” , Galgotia Publications, pvt.Ltd
11. process scheduling under uncertainity :review and challenges:
12. integration of production planning and scheduling: overview,challenges,and opportunities
13. Hackman S, Leachman R (1989): A general framework for modeling production. ManagSci 35:478–495