© 2016, IRJET | Impact Factor value: 4.45 | ISO 9001:2008 Certified Journal | Page 772
“
Study of correlation of CBR value with engineering properties and index
properties of coarse grained soil
.”
Vishal Chandrakar: Post graduate student, Civil Engineering Department, Jabalpur Engineering College, Jabalpur
R K Yadav: Professor, Civil Engineering Department, Jabalpur Engineering College,Jabalpur
ABSTRACT-
California Bearing Ratio test is a very important and common test performed to assess the stiffness modulus and shear strength of sub grade material so as to determine the thickness of overlaying layers. Conducting CBR test is an expensive and time taking test, also it is very difficult to keep the sample in desired condition. To overcome this problem other method such as regression (Simple and Multiple) analysis has been used. This paper describes correlation of cbr with index properties and engineering properties of coarse grained soil. For this purpose disturbed soil samples are collected from different region of Jabalpur city.Keywords
-CBR, regression models, index and engineering properties.
1.
INTRODUCTION
Most of the road network system in our country is consist of flexible pavements. There are several methods of design of flexible pavement. California bearing test is one of them. California bearing test is an empirical method of flexible pavement design. Flexible pavement consists of four components. These are usually named as soil subgrade, subbase course, base course, surface course. Flexible pavement layers transmit the compressive stresses to the lower layer (sub grade) by grain to grain transfer through the points of contact. Hence the design and performance of pavement largely depends upon the strength of subgrade soil.CBR test is used to determine the strength of subgrade soil.CBR value can be determine by laboratory test according to IS2720 part 16. The thickness pavement depends on CBR value, higher the CBR value, then the designed thickness of the sub-grade is thinner and vice versa.
© 2016, IRJET | Impact Factor value: 4.45 | ISO 9001:2008 Certified Journal | Page 773
these values can be calculate in less time. Breytenbach (2009) did research work to develop prediction models for estimation of CBR value using natural road construction materials in South Africa [1]. Ferede (2010) developed correlations to predict CBR value using D60, OMC and MDD for granular soils and LL, PL, PI and F200 for fine grained soils [2]. And many other investigators like Taskiran, 2010; Venkatasubramanian and Dhinakaran, 2011; Patel and Desai, 2010; Yildrim and Gunaydin, 2011 Talukdar, 2014; Singh, Reddy and Yadu, 2011; McGough, 2010 etc) [3, 4, 5, 6, 7, 8, 9,] developed prediction models based upon index properties of soil. .
2.
EXPERIMENTAL WORK
Disturbed soil samples were collected from eight different locations of Jabalpur city (M P) India. The collected soil samples are tested for CBR value, optimum moisture content, maximum dry density, particle size distribution ,all these tests are performed as per the guidelines provided by IS Code. In this study, regression models, both simple linear regression analysis (SLRA) and multiple linear regression analysis (MLRA), were developed for determining soaked CBR value using index and engineering properties of coarse grained soils.
Table 1-Summary of test results
S No
D30
(mm) (mm)
D60
(mm)D10
CU
CC
OMC
%
(g/cc)
MDD
CBR
%
SOIL TYPE
1
7.1
13.44 1.15
11.2
3.26
10.8
2.14
18
GP
2
8.2
30.2
2
15.1
1.11
8
2.2
32
GW
3
5.1
18.62
1.4
13.3
1
9
2.17
21
GW
4
5
13.2
1.2
12
1.57
9.2
2.15
20
GW
5
.46
1.1
.17
6.47
1.13
9.8
2.06
12
SW
6
.49
1
.247
4.04
0.97
10.5
2.05
11.4
SP
7
.5
.8
.33
2.42
0.94
10.9
2.03
9.2
SP
8
.48
.7
.34
2.18
0.96
12
2
8.4
SP
3.
RESULTS AND DISCUSSION
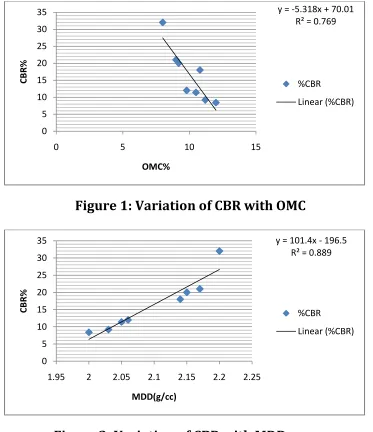
The results obtained from the tests are shown in table 1. For further calculations simple linear and multiple linear regression analysis are performed. Simple linear regression analysis is used to establish relation between soaked CBR and different soil properties, graphs are plotted with
CBR against different soil parameters and suitable trend line is drawn with higher correlation coefficient. Fig 1 shows variation of OMC with the CBR value. The value of R2 was found to be
© 2016, IRJET | Impact Factor value: 4.45 | ISO 9001:2008 Certified Journal | Page 774
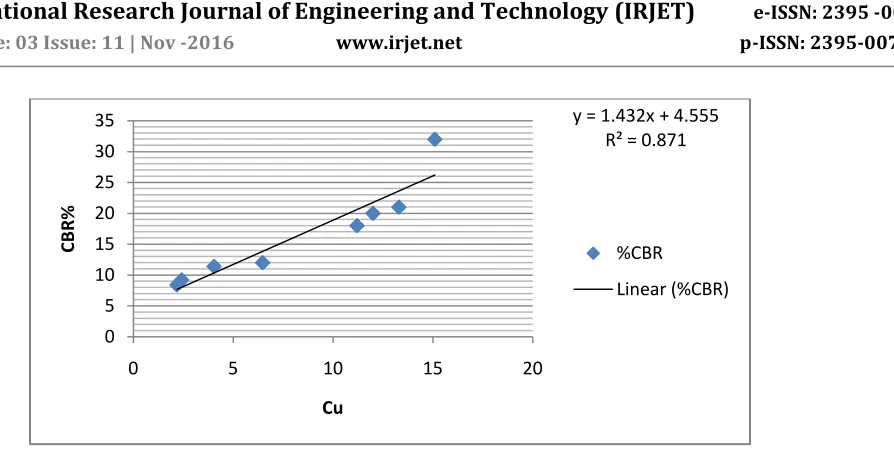
with a coefficient of correlation R2=0.889. Fig 3 shows variation of Cu with the CBR value. The
value of R2 was found to be 0.8809.
[image:3.612.136.509.145.577.2]
Figure 1: Variation of CBR with OMC
[image:3.612.140.502.147.327.2]
Figure 2: Variation of CBR with MDD
y = -5.318x + 70.01 R² = 0.769
0 5 10 15 20 25 30 35
0 5 10 15
CB
R
%
OMC%
%CBR
Linear (%CBR)
y = 101.4x - 196.5 R² = 0.889
0 5 10 15 20 25 30 35
1.95 2 2.05 2.1 2.15 2.2 2.25
CB
R
%
MDD(g/cc)
%CBR
© 2016, IRJET | Impact Factor value: 4.45 | ISO 9001:2008 Certified Journal | Page 775
Figure 3: Variation of CBR with Cu
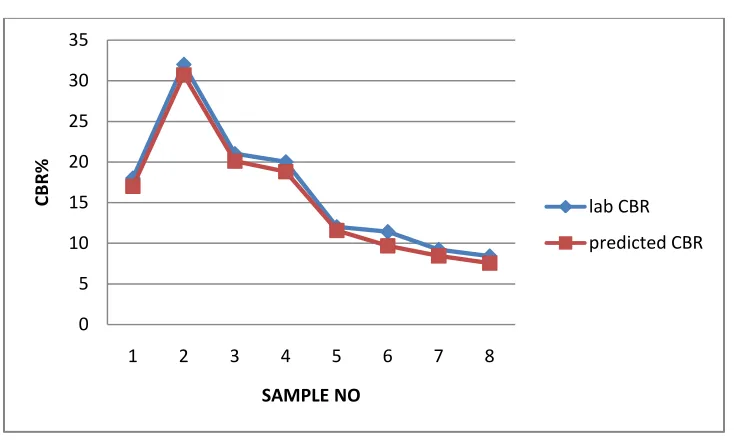
As the main purpose of this study was to develop a correlation between the CBR value of the coarse grained soil and soil properties like GRAIN SIZE DISTRIBUTION, OMC, MDD, for this multiple regression model is developed using the data analysis tool pack of Microsoft excel. The mathematical equation developed is as follows:-
CBR= 198.63-3.78*OMC-73.37*MDD+0.34*D
60+1.64 *D
30The coefficient of correlation (R2) for the above equation was found to be 0.9728, this shows the
equation holds good in correlating the CBR value with other soil properties.
The comparison between laboratory CBR value and predicted CBR value are shown in the table below.
COMPARISON OF LAB AND SOAKED CBR
CBR(%) from laboratory test
CBR(%) from mathematical equation
18
17
32
30.692
21
20.09
20
18.796
12
11.57
11.4
9.675
9.2
8.445
8.4
7.552
y = 1.432x + 4.555 R² = 0.871
0 5 10 15 20 25 30 35
0 5 10 15 20
CB
R
%
Cu
%CBR
© 2016, IRJET | Impact Factor value: 4.45 | ISO 9001:2008 Certified Journal | Page 776
Figure 4: Predicted and laboratory CBR value comparison
4.
CONCLUSIONS
Following conclusions are drawn from above study
CBR value of coarse grained soil bears significant correlation with Cu, MDD and OMC.
CBR value decreases with increase in OMC but also increases with increase in MDD and grain size.
From regression analysis the coefficient of variation (adjusted R2) for the CBR value
is found to be 0.998.
From the formula and table 2, we can conclude that the correlation equation can be used for evaluating different values of CBR, but this research is limited for coarse grained soil only.
0 5 10 15 20 25 30 35
1 2 3 4 5 6 7 8
CB
R
%
SAMPLE NO
lab CBR
© 2016, IRJET | Impact Factor value: 4.45 | ISO 9001:2008 Certified Journal | Page 777
REFERENCES
Akashaya Kumar Sabat(2013), Prediction of CBR a soil Stabilized with Lime and Quarry Dust Using Artificial Neural Network, EJGE, Vol. 18.
Black, W.P.M. (1962). A Method of estimating the CBR of cohesive soils from plasticity data, Geotechnique, Vol.12, 271 - 272.
Breytenbach, I.J., “The relationship between index testing and California Bearing Ratio values for natural road construction materials in South Africa”, M.Sc. dissertation, Department of Geology, Faculty of Natural and Agricultural Sciences, University of Pretoria, South Africa (2009
Ferede, Z.W., “Prediction of California Bearing Ratio (CBR) value from Index Properties of Soil”, Department Of Civil Engineering, Addis Abab University (2010).
IS: 2720 Part XVI (1980) IS: 9669, Laboratory determination of California bearing ratio (CBR) of soil, BIS, New Delhi.
IS 2720 (part 7)-1983 reaffirmed 1995; Indian standard method of test of soil, determination of water content- dry density relationship using heavy compaction, Bureau of Indian standards, New Delhi .
Patel Rashmi S., Desai M. D.,(2010),”CBR predicted by index properties for alluvial soils of south Gujarat “. Indian geotechnical conference-2010, december 16-18, pp 79-82.
Pradeep Muley, P. K. Jain (2013), Betterment and prediction of CBR of stone dust mixed poor soils, Proceedings of Indian Geotechnical Conference December 22-24, 2013, IIT Roorkee
Ramasubbaroa, G.V., Siva Sankar, G.(2013), Predicting Soaked CBR Value Of Fine Grained Soil Using Index and Compaction Characteristics, Jordan Journal Of Civil Engineering, Vol 7, No-3.
© 2016, IRJET | Impact Factor value: 4.45 | ISO 9001:2008 Certified Journal | Page 778 Singh, D., Reddy, K.S. and Yadu, L., “Moisture and Compaction Based Statistical Model for
Estimating CBR of Fine Grained Sub grade Soils”, International Journal of Earth Sciences and Engineering, ISSN 0974-5904, Volume 04, No 06 SPL, October 2011, pp 100-103(2011).
Taskiran, T., “Prediction of California bearing ratio (CBR) of fine grained soils by AI methods”, Journal of Advances in Engineering Software Volume 41 Issue 6, June 2010, Pages 886-892(2010).
Talukdar, D. K., “A Study of Correlation Between California Bearing Ratio (CBR) Value With Other Properties of Soil”, International Journal of Emerging Technology and Advanced Engineering, ISSN 2250-2459, ISO 9001:2008 Certified Journal, Volume 4, Issue 1(2014).
Venkatasubramanian. C, Dhinakaran. G., “ANN model for predicting CBR from index properties of soils”, International Journal of Civil and Structural Engineering, Integrated Publishing Association (IPA), Vol. 2 (2): 605-611(2011).