© 2017, IRJET | Impact Factor value: 5.181 | ISO 9001:2008 Certified Journal | Page 1909
A Novel Route Optimized Cluster Based Routing Protocol for Pollution
Controlling Network Architecture
B.Kameswara Rao
1, Dr. A. S. N. Chakravarthy
21Research Scholar, JNTU Kakinada, AP, India
2Professor, JNTUK University College of Engineering,Vizianagaram, AP, India
---***--- Abstract— Increase in use of Sensor Networks for multiple applications forcing the researchers to enforce multiple strategies to this domain. The sensor networks are having few limitations in order to enhance the performance the network. The important bottlenecks of the systems are the network topology and energy efficiency. The network topologies for sensor network are not restricted to any architecture and subjected to change based on the movements of devices. Additions to that, the devices are battery powered hence the power awareness of the devices thus the algorithms. These bottlenecks restrict the research to improve the performances. However sufficient amount of research attempts are made to improve the performance majorly targeting to improve the routing performances. Nevertheless, the energy efficiencies of the existing algorithms cannot be overlooked. Henceforth, the recent demand of the research is always to produce an efficient routing algorithm without compromising the energy awareness. Thus, this work formulates and evaluates a novel route optimized cluster based algorithm with moderate energy consumption.
Keywords— Tactical Sensor Network, Cluster based, TEEN, SEP, EAMMH, Optimal Route, Energy Awareness
I. INTRODUCTION
The Joint Tactical Radio System (JTRS) Acquisition Program was born out of the 1997 Quadrennial Defence Review (QDR), which called for the services to combine and integrate all tactical radio equipment. The essential premise behind this project is to leverage commercial off-the-shelf (COTS) and software defined radio (SDR) technology to produce a new family of tactical radios that are multi-functional and complete with advanced data networking capabilities to meet the needs of modern information warfare. The main objective of JTRS is to interconnect radios in a WSN. However, conventional routing protocols are unable to meet the unique requirements of WSN. Dynamic topology, bandwidth, power limitations, and limited physical security combine to make the WSN very challenging [1] [2] [3]. The first generation of JTRS, the Digital Modular Radio, is being installed in the new Marine amphibious ships currently under construction. The Zone Routing Protocol (ZRP), developed at Cornell University, has been suggested for implementation in JTRS. ZRP incorporates a hybrid protocol which utilizes current Internet routing techniques combined with on-demand routing to reduce overhead and improve efficiency in WSN. ZRP forms a conventional Internet routing zone around each mobile node and only executes an on-demand routing protocol to meet out-of-zone destination requests. The routing zones of each node provide the out of-zone routing protocol a more efficient method of creating and establishing routes among mobile nodes [4] [5] [6].
Utilizing an OPNET model of ZRP provided by Cornell University, this thesis studied and examined the protocol's performance by developing a simple Marine tactical scenario. The focus of the analysis was on protocol overhead, network adaptation, efficiency, and optimization. Techniques and recommendations for future study of ZRP and other WSN protocols being considered for use in JTRS and DMR. The results provide a snapshot into the performance of ZRP in a simple network chosen to represent the relative scale of a single Marine rifle platoon operating in a one square kilometre area of operation [7] [8].
© 2017, IRJET | Impact Factor value: 5.181 | ISO 9001:2008 Certified Journal | Page 1910
II. ANOVEL ROUTE OPTIMIZED CLUSTER BASED ROUTING ALGORITHM
The novel cluster depended approach is efficient and effective by the means of time and energy efficiency. The clustered depended approach is demonstrated in this section.
In order to establish the mathematical model the following lemmas are considered. The lemmas and the subsequent theory will establish the model by analysing the cluster head detection.
Lemma – 1: The routing algorithm time will be reduced if the cluster head detection time is lower. Also the routing route selection time will be reduced subsequently.
Where,
T(A) denotes the active node selections time. T(CH) denotes the cluster head selection time. T(D) denotes the dead node removal time. T(Tab) denotes the routing table update time.
Proof: In order to prove the above lemma, this work considers the following:
Assuming that, the total routing time for any given network at the first round, T(r),
r r r r
1 1 1 1
( ) (A) ( ) ( ) ( )
r r r r
i i i i
T r T T CH T D T TAB
(Eq. 1)The time taken for the selection of the active node and time required for the cluster head detection can be targeted to improve the total routing time as the dead node selection will have minimum effects and time to update the routing table is mostly static.
Henceforth, this work attempts to reduce the time for cluster head and active node selection.
If the algorithm uses a table to maintain the list of eligible cluster heads and list of active nodes, then the predictive analysis can be applied in order to reduce the time.
Here, the percentage of the update of the predictive information table can be considered as P(r) for the round r,
( )
( )
1
[ ( ) /
( )]
P r
P r
r
A
D
(Eq. 2)
Naturally to be understood that, once the number of active nodes reduces and the number of dead nodes increases, the percentage of the update will reduce.
( )
,
( )
,
( )
A
Min
D
Max
Then P r
Min
(Eq. 3)Henceforth, the time required of calculation of predictive table update of the time for each rounds, TP(r)
1
(
1)
(
)
( )
( )
r
i
TP r
T CH
TP r
P r
TP
(Eq. 4)It is clear to understand that,
(
)
(
)
T CH
T CH
(Eq. 5)Resulting into,
r r r r
1 1 1 1
( ) (A) ( ) ( ) ( )
r r r r
i i i i
T r T T CH T D T TAB
© 2017, IRJET | Impact Factor value: 5.181 | ISO 9001:2008 Certified Journal | Page 1911
Finally,
( )
( )
T r
T r
(Eq. 7)Hence, reduction in the cluster head detection will reduce the time for routing.
Lemma – 2: Any algorithm must change the cluster head randomly and time to time in order to enhance the life time of the network.
Where,
T(CH) denotes the cluster head deciding function and returns the cluster head for any time instance G is the set of clusters
N is the set of nodes in any cluster k is the round number
Proof: In order to prove the above lemma, this work demonstrates that,
g
G
(Eq. 8)There exists a cluster g in the total network, such that,
( )
g
NULL
(Eq. 9)The numbers of non-dead or active nodes are not zero.
Further, the selected node, n
n
N
(Eq. 10)And the randomly selected node to be considered as the new cluster head, n’
( )
n t
N
(Eq. 11)Subsequently to be naturally understood that,
N
N and N
N
(Eq. 12)So that the recently selected cluster head can be avoided to be similar from the last one.
Considering the R(k) is the percentage of the cluster head available in the N, then
1
1
( )[k .mod
]
( )
R k
R k
(Eq. 13)The remaining percentage of the cluster heads, available in the collection N.
Henceforth, the cluster dead deciding the function can be formulated as
( )
(
)
1
1
( )[k .mod
]
( )
R k
T CH
R k
R k
(Eq. 14)
As the Eq. 12 clearly stand the point of not repeating cluster heads in the subsequent times, thus the energy consumption is also evenly distributed.
Henceforth in the light of the Lemma – 1 and Lemma – 2, this work demonstrates the novel algorithm,
Step-1. In the pre-installation step, the list of active nodes will be accumulated,
n
N
D
(Eq. 15)Where n denotes the any available node belongs to the cluster set N and does not belongs to the D, the dead cluster set. From the Lemma – 1, it is proven that the random selection of the cluster head will improve the routing time of the algorithm.
© 2017, IRJET | Impact Factor value: 5.181 | ISO 9001:2008 Certified Journal | Page 1912
From the Lemma -2, it is also proven that the consideration of the available energy will improve the life span of the network.
Step-3. Henceforth, the cluster head will be decided considering the weight function consisting of the available energy and selection of non-repeating nodes.
Where,
CH denotes the cluster head
From the Eq. 7, Eq. 13 and Eq. 14,
( _ ( ))
Re ( _ ( ))
[
]
Max N Egy n
s N Egy n
CH
n
n
N
D
(Eq. 17)Step-4. The information captured for all the nodes in the network will be maintained in the routing table RTab with the following parameters.
n Source Destination Next
(N_Egy , n
, n
, n
)
RTab
(Eq. 18)Step-5. In the next step, the nearing neighbour node to be decided repeating the step – 1 to 4.
Step-6. After the path is been decided, the data transfer is carried out.
Step-7. In case of the network topology change repeat the step – 1 to 5.
Hence the algorithm may show moderately higher energy consumption, the response time or the routing time of the algorithm is improved.
In order to prove, the improvements in the next section, this work furnishes the comparative study.
III.RESULTS AND DISCUSSIONS
In this section, the work demonstrates the comparison of the Cluster Head selection time and the total routing time.
The following scenarios are considered for performance evaluation:
Sensor Network with 30 Nodes
Sensor Network with 50 Nodes
Sensor Network with 75 Nodes
And
Sensor Network with 100 Nodes
A. Simulation with 30 Nodes
The simulation demonstrates significant improvement. The improvement is been furnished here [Table – 1].
TABLE I: Cluster Head Selection Time with 30 Nodes
Number of Nodes
Selection Time in ns
TEEN SEP EAMMH Technique Novel
1 0.016 0.015 0.069 0.022
2 0.006 0.022 0.035 0.016
3 0.001 0.016 0.031 0.016
4 0.015 0.032 0.035 0.021
5 0.022 0.014 0.054 0.016
6 0.015 0.015 0.046 0.015
7 0.015 0 0.054 0.016
8 0.016 0.021 0.031 0.018
9 0.018 0.015 0.047 0.016
10 0.015 0.015 0.053 0.016
© 2017, IRJET | Impact Factor value: 5.181 | ISO 9001:2008 Certified Journal | Page 1913
12 0.002 0.006 0.047 0.016
13 0.031 0.018 0.049 0.015
14 0.015 0.016 0.043 0.016
15 0.015 0.015 0.046 0.016
16 0.006 0.028 0.055 0
17 0.016 0.015 0.047 0.016
18 0.015 0.016 0.035 0.019
19 0.019 0.016 0.038 0.021
20 0.016 0.016 0.032 0.016
21 0.016 0 0.046 0.022
22 0.018 0.016 0.038 0.001
23 0.015 0.032 0.05 0.015
24 0.015 0.015 0.047 0.016
25 0.016 0.016 0.047 0.016
26 0.016 0.016 0.045 0
27 0.018 0.022 0.031 0.015
28 0.017 0.022 0.047 0.016
29 0.016 0.016 0.033 0.016
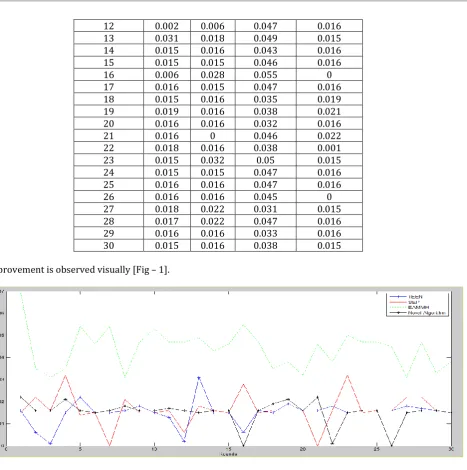
30 0.015 0.016 0.038 0.015
The improvement is observed visually [Fig – 1].
Fig. 1 Improvement in Routing Time
B. Simulation with 50 Nodes
[image:5.595.79.547.80.551.2]The simulation demonstrates significant improvement. The improvement is been furnished here [Table – 2].
TABLE II: Cluster Head Selection Time with 50 Nodes
Number of Nodes
Selection Time in ns
TEEN SEP EAMMH
Novel Techniqu
e
1 0.016 0.015 0.069 0.022
2 0.006 0.022 0.035 0.016
3 0.001 0.016 0.031 0.016
4 0.015 0.032 0.035 0.021
5 0.022 0.014 0.054 0.016
© 2017, IRJET | Impact Factor value: 5.181 | ISO 9001:2008 Certified Journal | Page 1914
7 0.015 0 0.054 0.016
8 0.016 0.021 0.031 0.018
9 0.018 0.015 0.047 0.016
10 0.015 0.015 0.053 0.016
11 0.013 0.016 0.047 0.017
12 0.002 0.006 0.047 0.016
13 0.031 0.018 0.049 0.015
14 0.015 0.016 0.043 0.016
15 0.015 0.015 0.046 0.016
16 0.006 0.028 0.055 0
17 0.016 0.015 0.047 0.016
18 0.015 0.016 0.035 0.019
19 0.019 0.016 0.038 0.021
20 0.016 0.016 0.032 0.016
21 0.016 0 0.046 0.022
22 0.018 0.016 0.038 0.001
23 0.015 0.032 0.05 0.015
24 0.015 0.015 0.047 0.016
25 0.016 0.016 0.047 0.016
26 0.016 0.016 0.045 0
27 0.018 0.022 0.031 0.015
28 0.017 0.022 0.047 0.016
29 0.016 0.016 0.033 0.016
30 0.015 0.016 0.038 0.015
31 0.018 0.001 0.047 0.015
32 0 0.016 0.032 0.032
33 0.016 0.016 0.038 0.016
34 0.017 0.016 0.047 0.016
35 0.031 0.031 0.038 0.016
36 0.023 0.015 0.031 0.016
37 0.015 0.016 0.047 0.031
38 0.013 0.015 0.049 0
39 0.017 0.022 0.047 0.018
40 0.014 0.016 0.031 0.016
41 0 0.016 0.038 0
42 0.015 0.015 0.031 0.031
43 0.016 0.016 0.035 0.015
44 0.021 0 0.031 0.016
45 0.016 0.02 0.031 0.016
46 0.014 0.016 0.038 0.022
47 0.023 0.016 0.031 0.015
48 0.015 0.017 0.031 0.019
49 0.016 0.014 0.038 0.031
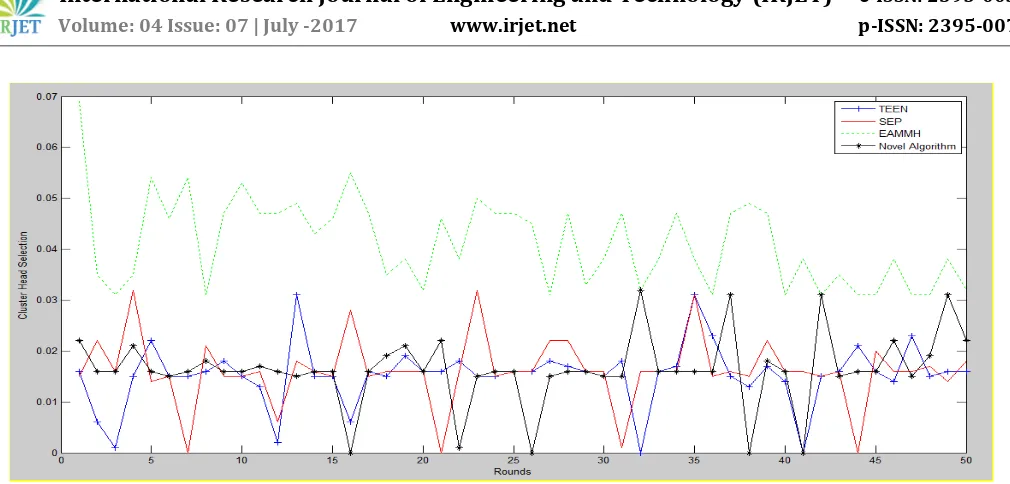
50 0.016 0.018 0.032 0.022
© 2017, IRJET | Impact Factor value: 5.181 | ISO 9001:2008 Certified Journal | Page 1915
Fig. 2 Improvement in Routing Time
C. Simulation with 75 Nodes
The simulation demonstrates significant improvement. The improvement is been furnished here [Table – 3].
TABLE III: Cluster Head Selection Time with 75 Nodes
Number of Nodes
Selection Time in ns
TEEN SEP EAMMH
Novel Techniqu
e
1 0.016 0.015 0.069 0.022
2 0.006 0.022 0.035 0.016
3 0.001 0.016 0.031 0.016
4 0.015 0.032 0.035 0.021
5 0.022 0.014 0.054 0.016
6 0.015 0.015 0.046 0.015
7 0.015 0 0.054 0.016
8 0.016 0.021 0.031 0.018
9 0.018 0.015 0.047 0.016
10 0.015 0.015 0.053 0.016
11 0.013 0.016 0.047 0.017
12 0.002 0.006 0.047 0.016
13 0.031 0.018 0.049 0.015
14 0.015 0.016 0.043 0.016
15 0.015 0.015 0.046 0.016
16 0.006 0.028 0.055 0
17 0.016 0.015 0.047 0.016
18 0.015 0.016 0.035 0.019
19 0.019 0.016 0.038 0.021
20 0.016 0.016 0.032 0.016
21 0.016 0 0.046 0.022
22 0.018 0.016 0.038 0.001
23 0.015 0.032 0.05 0.015
24 0.015 0.015 0.047 0.016
25 0.016 0.016 0.047 0.016
26 0.016 0.016 0.045 0
© 2017, IRJET | Impact Factor value: 5.181 | ISO 9001:2008 Certified Journal | Page 1916
28 0.017 0.022 0.047 0.016
29 0.016 0.016 0.033 0.016
30 0.015 0.016 0.038 0.015
31 0.018 0.001 0.047 0.015
32 0 0.016 0.032 0.032
33 0.016 0.016 0.038 0.016
34 0.017 0.016 0.047 0.016
35 0.031 0.031 0.038 0.016
36 0.023 0.015 0.031 0.016
37 0.015 0.016 0.047 0.031
38 0.013 0.015 0.049 0
39 0.017 0.022 0.047 0.018
40 0.014 0.016 0.031 0.016
41 0 0.016 0.038 0
42 0.015 0.015 0.031 0.031
43 0.016 0.016 0.035 0.015
44 0.021 0 0.031 0.016
45 0.016 0.02 0.031 0.016
46 0.014 0.016 0.038 0.022
47 0.023 0.016 0.031 0.015
48 0.015 0.017 0.031 0.019
49 0.016 0.014 0.038 0.031
50 0.016 0.018 0.032 0.022
51 0.016 0.015 0.033 0.016
52 0.017 0.015 0.038 0.023
53 0.016 0.018 0.032 0.016
54 0.022 0.016 0.031 0.016
55 0 0.015 0.016 0.016
56 0.016 0.014 0.035 0.016
57 0.027 0.018 0.031 0
58 0.018 0.013 0.038 0.015
59 0.015 0.014 0.031 0.015
60 0.016 0.019 0.034 0
61 0.016 0.021 0.031 0.016
62 0.02 0.014 0.031 0.015
63 0.016 0.017 0.02 0.015
64 0.016 0.016 0.015 0.016
65 0.015 0.016 0.016 0.022
66 0.016 0.013 0.031 0
67 0.018 0.012 0.031 0
68 0.016 0.015 0.022 0.016
69 0.016 0.016 0.031 0.015
70 0.016 0.015 0.016 0.002
71 0.02 0.018 0.016 0.016
72 0.012 0.016 0.015 0.021
73 0.017 0.016 0.015 0
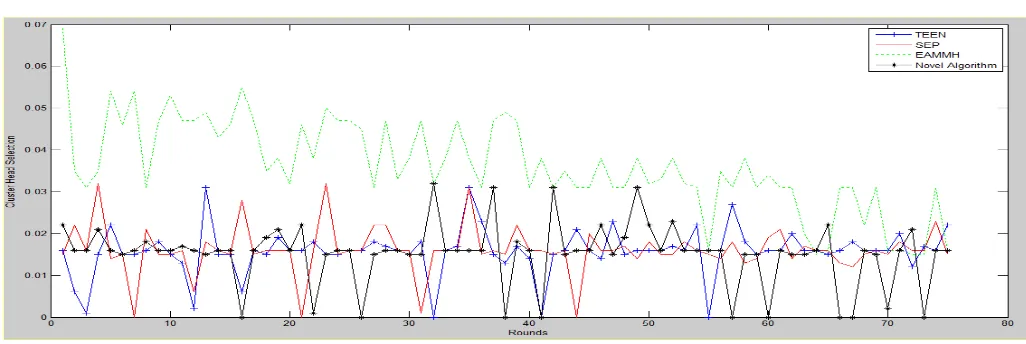
74 0.016 0.023 0.031 0.016
© 2017, IRJET | Impact Factor value: 5.181 | ISO 9001:2008 Certified Journal | Page 1917
[image:9.595.45.558.114.286.2]The improvement is observed visually [Fig – 3].
Fig. 3 Improvement in Routing Time
D. Simulation with 100 Nodes
The simulation demonstrates significant improvement. The improvement is been furnished here [Table – 4].
TABLE IV: Cluster Head Selection Time with 100 Nodes
Number of Nodes
Selection Time in ns
TEEN SEP EAMMH
Novel Techniqu
e
1 0.016 0.015 0.069 0.022
2 0.006 0.022 0.035 0.016
3 0.001 0.016 0.031 0.016
4 0.015 0.032 0.035 0.021
5 0.022 0.014 0.054 0.016
6 0.015 0.015 0.046 0.015
7 0.015 0 0.054 0.016
8 0.016 0.021 0.031 0.018
9 0.018 0.015 0.047 0.016
10 0.015 0.015 0.053 0.016
11 0.013 0.016 0.047 0.017
12 0.002 0.006 0.047 0.016
13 0.031 0.018 0.049 0.015
14 0.015 0.016 0.043 0.016
15 0.015 0.015 0.046 0.016
16 0.006 0.028 0.055 0
17 0.016 0.015 0.047 0.016
18 0.015 0.016 0.035 0.019
19 0.019 0.016 0.038 0.021
20 0.016 0.016 0.032 0.016
21 0.016 0 0.046 0.022
22 0.018 0.016 0.038 0.001
23 0.015 0.032 0.05 0.015
24 0.015 0.015 0.047 0.016
25 0.016 0.016 0.047 0.016
26 0.016 0.016 0.045 0
© 2017, IRJET | Impact Factor value: 5.181 | ISO 9001:2008 Certified Journal | Page 1918
28 0.017 0.022 0.047 0.016
29 0.016 0.016 0.033 0.016
30 0.015 0.016 0.038 0.015
31 0.018 0.001 0.047 0.015
32 0 0.016 0.032 0.032
33 0.016 0.016 0.038 0.016
34 0.017 0.016 0.047 0.016
35 0.031 0.031 0.038 0.016
36 0.023 0.015 0.031 0.016
37 0.015 0.016 0.047 0.031
38 0.013 0.015 0.049 0
39 0.017 0.022 0.047 0.018
40 0.014 0.016 0.031 0.016
41 0 0.016 0.038 0
42 0.015 0.015 0.031 0.031
43 0.016 0.016 0.035 0.015
44 0.021 0 0.031 0.016
45 0.016 0.02 0.031 0.016
46 0.014 0.016 0.038 0.022
47 0.023 0.016 0.031 0.015
48 0.015 0.017 0.031 0.019
49 0.016 0.014 0.038 0.031
50 0.016 0.018 0.032 0.022
51 0.016 0.015 0.033 0.016
52 0.017 0.015 0.038 0.023
53 0.016 0.018 0.032 0.016
54 0.022 0.016 0.031 0.016
55 0 0.015 0.016 0.016
56 0.016 0.014 0.035 0.016
57 0.027 0.018 0.031 0
58 0.018 0.013 0.038 0.015
59 0.015 0.014 0.031 0.015
60 0.016 0.019 0.034 0
61 0.016 0.021 0.031 0.016
62 0.02 0.014 0.031 0.015
63 0.016 0.017 0.02 0.015
64 0.016 0.016 0.015 0.016
65 0.015 0.016 0.016 0.022
66 0.016 0.013 0.031 0
67 0.018 0.012 0.031 0
68 0.016 0.015 0.022 0.016
69 0.016 0.016 0.031 0.015
70 0.016 0.015 0.016 0.002
71 0.02 0.018 0.016 0.016
72 0.012 0.016 0.015 0.021
73 0.017 0.016 0.015 0
74 0.016 0.023 0.031 0.016
75 0.022 0.015 0.016 0.016
76 0.016 0.013 0.016 0
77 0.015 0.015 0.015 0.016
78 0.018 0.02 0.016 0
79 0.014 0.016 0.016 0
80 0.015 0.015 0.016 0.011
81 0.018 0.016 0.019 0.01
© 2017, IRJET | Impact Factor value: 5.181 | ISO 9001:2008 Certified Journal | Page 1919
83 0.019 0.006 0.018 0.015
84 0.015 0.015 0.016 0.015
85 0.019 0.016 0.016 0
86 0.017 0.016 0.015 0
87 0.002 0 0.016 0.016
88 0.015 0.016 0.031 0.009
89 0.032 0.016 0.016 0.01
90 0.016 0.018 0.003 0
91 0.015 0.015 0.016 0
92 0.016 0.015 0.016 0
93 0.006 0.015 0 0
94 0.016 0.012 0 0.015
95 0.016 0.017 0.022 0
96 0.017 0.015 0 0.015
97 0.016 0.015 0.016 0.015
98 0.016 0.016 0.017 0.016
99 0.031 0.014 0.016 0.016
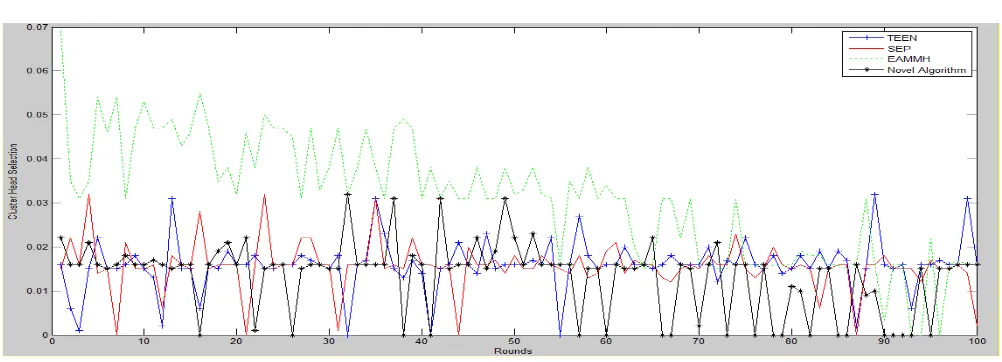
100 0.016 0.002 0.016 0.016
[image:11.595.49.550.355.536.2]The improvement is observed visually [Fig – 4].
Fig. 4 Improvement in Routing Time
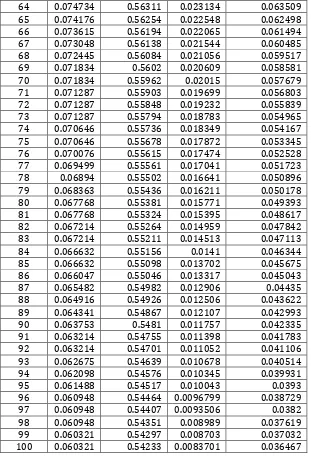
[image:11.595.29.525.622.780.2]The energy awareness of the existing algorithms with the proposed novel algorithms also is been compared here [Table – 5].
TABLE V: Energy Comparison with 100 Nodes
Numbe r of Nodes
Average Node Energy in Joules
TEEN SEP EAMMH Technique Novel
1 0.099434 0.59943 0.098617 0.1485
2 0.098803 0.59887 0.097215 0.14703
3 0.098803 0.5983 0.095741 0.14548
4 0.098248 0.59769 0.094253 0.14397
5 0.097725 0.59709 0.092724 0.14245
6 0.097166 0.59654 0.09127 0.14093
7 0.096571 0.59598 0.089718 0.13944
© 2017, IRJET | Impact Factor value: 5.181 | ISO 9001:2008 Certified Journal | Page 1920
9 0.095992 0.59482 0.086888 0.13639
10 0.095388 0.59425 0.085432 0.13487
11 0.094718 0.59368 0.083971 0.13334
12 0.094718 0.59308 0.08246 0.13184
13 0.094139 0.59253 0.081 0.13038
14 0.0936 0.59197 0.079523 0.12882
15 0.093085 0.59141 0.078058 0.1273
16 0.092496 0.59084 0.076585 0
17 0.091935 0.59025 0.075119 0.12435
18 0.091935 0.58962 0.073636 0.1228
19 0.09144 0.58903 0.072209 0.12127
20 0.090844 0.58846 0.070758 0.11974
21 0.090181 0.58787 0.069359 0.11822
22 0.089636 0.58731 0.067857 0.1167
23 0.089088 0.5867 0.06643 0.11518
24 0.088531 0.58616 0.065002 0.11366
25 0.087966 0.58559 0.06357 0.11215
26 0.087399 0.58499 0.062244 0.11062
27 0.086841 0.58443 0.0608 0.10909
28 0.086272 0.58383 0.059578 0.1076
29 0.085678 0.58325 0.058165 0.10624
30 0.085678 0.5827 0.056813 0.10483
31 0.085098 0.58216 0.055407 0.10339
32 0 0.58158 0.053975 0.10199
33 0.084531 0.58094 0.052628 0.1006
34 0.084531 0.58042 0.051338 0.09918
35 0.08392 0.57985 0.049976 0.097768
36 0.083355 0.57924 0.048712 0.096527
37 0.082741 0.57868 0.047488 0.095229
38 0.082741 0.57809 0.04632 0.09394
39 0.082741 0.57751 0.045217 0.092601
40 0.082168 0.57698 0.043972 0.091303
41 0 0.57634 0.042668 0.089998
42 0.081559 0.57578 0.041518 0.088758
43 0.081559 0.57523 0.040425 0.087432
44 0.081039 0.57463 0.03921 0.086131
45 0.08048 0.57403 0.038101 0.084928
46 0.08048 0.57347 0.037099 0.083675
47 0.08048 0.57289 0.036013 0.082431
48 0.079886 0.57232 0.035283 0.081295
49 0.079886 0.57179 0.034314 0.0801
50 0.079278 0.57125 0.033378 0.078883
51 0.078744 0.57064 0.032412 0.077686
52 0.078101 0.57003 0.031597 0.076511
53 0.078101 0.56944 0.030703 0.075446
54 0.078101 0.56886 0.029906 0.074334
55 0.077574 0.56829 0.029112 0.073224
56 0.077574 0.56771 0.028311 0.0721
57 0.077027 0.56717 0.027604 0.071071
58 0.076468 0.56657 0.026895 0.069934
59 0.076468 0.566 0.026266 0.068788
60 0.076468 0.5654 0.02557 0.067695
61 0.075833 0.56483 0.024984 0.06661
62 0.075281 0.56422 0.024347 0.065586
© 2017, IRJET | Impact Factor value: 5.181 | ISO 9001:2008 Certified Journal | Page 1921
64 0.074734 0.56311 0.023134 0.063509
65 0.074176 0.56254 0.022548 0.062498
66 0.073615 0.56194 0.022065 0.061494
67 0.073048 0.56138 0.021544 0.060485
68 0.072445 0.56084 0.021056 0.059517
69 0.071834 0.5602 0.020609 0.058581
70 0.071834 0.55962 0.02015 0.057679
71 0.071287 0.55903 0.019699 0.056803
72 0.071287 0.55848 0.019232 0.055839
73 0.071287 0.55794 0.018783 0.054965
74 0.070646 0.55736 0.018349 0.054167
75 0.070646 0.55678 0.017872 0.053345
76 0.070076 0.55615 0.017474 0.052528
77 0.069499 0.55561 0.017041 0.051723
78 0.06894 0.55502 0.016641 0.050896
79 0.068363 0.55436 0.016211 0.050178
80 0.067768 0.55381 0.015771 0.049393
81 0.067768 0.55324 0.015395 0.048617
82 0.067214 0.55264 0.014959 0.047842
83 0.067214 0.55211 0.014513 0.047113
84 0.066632 0.55156 0.0141 0.046344
85 0.066632 0.55098 0.013702 0.045675
86 0.066047 0.55046 0.013317 0.045043
87 0.065482 0.54982 0.012906 0.04435
88 0.064916 0.54926 0.012506 0.043622
89 0.064341 0.54867 0.012107 0.042993
90 0.063753 0.5481 0.011757 0.042335
91 0.063214 0.54755 0.011398 0.041783
92 0.063214 0.54701 0.011052 0.041106
93 0.062675 0.54639 0.010678 0.040514
94 0.062098 0.54576 0.010345 0.039931
95 0.061488 0.54517 0.010043 0.0393
96 0.060948 0.54464 0.0096799 0.038729
97 0.060948 0.54407 0.0093506 0.0382
98 0.060948 0.54351 0.008989 0.037619
99 0.060321 0.54297 0.008703 0.037032
100 0.060321 0.54233 0.0083701 0.036467
[image:13.595.144.455.99.555.2]The improvement is observed visually [Fig – 5].
© 2017, IRJET | Impact Factor value: 5.181 | ISO 9001:2008 Certified Journal | Page 1922
Henceforth with the demonstration of the notable improvements, this work firmly stands the algorithm performance improvements in terms of cluster head selection time and energy awareness.
IV.CONCLUSIONS OF THE STUDY
With the aim of improving the cluster head selection time and energy efficiency of the Sensor Network routing algorithms, this work proposes and establishes the novel cluster based routing algorithm. The work establishes the improved results compared to the existing algorithms. In the course of the study, the work presents the classifications of the Sensor Network routing algorithms with their notable dismissal conditions for any given network. The work evaluates the performances of TEEN, SEP and EAMMH with the proposed systems. The algorithm is proven to be having higher energy efficiency and consistence for a tactical Sensor Network. This work finally outcomes in the novel algorithm with nearly 20% improvement in the cluster head selection time and 50% improvement in the power awareness and the proposed model for calculating the energy efficiency of any given algorithm for further enhancements.
REFERENCES
[1] F. Hu, Y. Wang, H. Wu, "Mobile telemedicine sensor networks with low-energy data query and network lifetime considerations", IEEE Trans. Mobile Computing, vol. 5, no. 4, pp. 404-417, Apr. 2006.
[2] S. Bandyopadhyay, E. J. Coyle, "Minimizing communication costs in hierarchically-clustered networks of wireless sensors", Computer Networks, vol. 44, no. 1, pp. 1-16, Jan. 2004.
[3] W. Heinzelman, A. Chandrakasan, H. Balakrishnan, "An application-specific protocol architecture for wireless microsensor networks", IEEE Trans. Wireless Commun., vol. 1, no. 4, pp. 660-670, Oct. 2002.
[4] L. Li, J. Y. Halpern, P. Bahl, Y.-M. Wang, R. Wattenhofer, "A cone-based distributed topology-control algorithm for wireless multi-hop networks", IEEE/ACM Trans. Networking, vol. 13, no. 1, pp. 147-159, Feb. 2005.
[5] X.-Y. Li, W.-Z. Song, Y. Wang, "Localized topology control for heterogenous wireless sensor networks", ACM Trans. Sensor Networks, vol. 2, no. 1, pp. 129-153, Feb. 2006.
[6] M. Cardei, J. Wu, S. Yang, "Topology control in ad hoc wireless networks using cooperative communication", IEEE Trans. Mobile Computing, vol. 5, no. 6, pp. 711-724, June 2006.
[7] H. Gupta, Z. Zhou, S. R. Das, Q. Gu, "Connected sensor cover: Self-organization of sensor networks for efficient query execution", IEEE/ACM Trans. Networking, vol. 14, no. 1, pp. 55-67, Feb. 2006.
[8] Y. Ma, J. H. Aylor, "System lifetime optimization for heterogeneous sensor networks with a hub-spoke topology", IEEE Trans. Mobile Computing, vol. 3, no. 3, pp. 286-294, July-Sep. 2004.
[9] S. Hussain, A. W. Matin, O. Islam, "Genetic algorithm for energy efficient clusters in wireless sensor networks", 4th Int. Conf. IT: New Generations, 2007-Apr., [online] Available: http://cs.acadiau.ca/\$\sim\$shussain/wsn/ publications/07-itng-hussain-ga.pdf.
[10] O. Younis, S. Fahmy, "HEED: A hybrid energy-efficient distributed clustering approach for ad hoc sensor networks", IEEE Trans. Mobile Computing, vol. 3, no. 4, pp. 366-379, Oct.-Dec. 2004.
ABOUT THE AUTHORS
B.Kameswara Rao, Research scholar from JNTUK, Kakinada from the department of computer science and engineering. He is working as faculty member in department of computer science and Engineering from Vizag Institue of Technology, India. He is a member of ISTE. He published papers in various National /International journals. His areas of interest Web Technology Applications, Wireless Sensor Networks, computer Networks, Spatial Databases, Computer Applications in Geo Science.