© 2017, IRJET | Impact Factor value: 5.181 | ISO 9001:2008 Certified Journal | Page 1951
Selecting best tractor ranking wise by software using MADM
(Multiple –attribute decision making approach)
Raman Gupta
11
Student (M.Tech), Mechanical Engineering Department, PCET Lalru, Punjab, India
---***---Abstract –
An extension of TOPSIS (Technique for orderperformance by similarity to ideal solution), a Multi-attribute decision making (MADM) technique, to a group decision environment investigated. TOPSIS is a useful technique in dealing with MADM problems in the real world. MADM is a practical tool for selection and ranking a number of alternatives its applications are numerous. In classical MADM methods, the ratings and the weights of the criteria are known precisely. Since human judgments including preferences are often vague and cannot be expressed by exact numerical values, the application of fuzzy concepts in decision making is deemed to be relevant. In recent years TOPSIS has been successfully applied to the areas of human resources, management, transportation, product design, manufacturing, water management, quality control and many more areas. We design a model of TOPSIS for the fuzzy environment with the introduction of appropriate negations for ideal solutions. This paper represents an optimization model to determine attribute weights for MADM problems with incomplete weight information. In this method, a series of mathematical programming models are constructed and transformed into a single mathematical programming model to determine the weight of attributes. A concrete problem for selecting best tractor is discussed in the paper, describes the complete process of method.
Key Words:
Tractor, TOPSIS, MADM, Best Tractor,
Software Selection, Best Automobile
1. INTRODUCTION
”Multi-attribute decision making (MADM) is the most well-known branch of decision making. It is branch of a general class of operations research models that deals with decision problems under the presence of a number of decisions criteria. The MADM approach requires that the selection be made among decision alternatives described by the attributes. MADM problems are assumed to have a predetermined, limited number of decision alternatives. Solving a MADM problem involves sorting and ranking. MADM approaches can be viewed as alternative methods for combining the information in a problem’s decision matrix together with additional information from the decision make to a determine a final ranking or selection from among the alternatives.
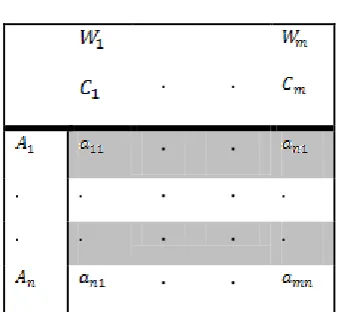
[image:1.595.349.518.359.515.2]A MADM problem with m criteria and n alternatives can present according to C1…Cm and A1…An as criteria and alternatives, respectively. Moreover, A MADM methodology is shown as ‘decision table’ (table 1). Each row and column presents the alternatives and criteria, respectively. The score aij describes the value and amount of alternative Aj against criterion Ci. In addition, weights W1…Wm should be assigned to every criterion. Weight presents the importance of criterion Ci to the decision, and is assumed to be positive. After filling the decision table by decision-maker experience, a MADM technique must be selected in order to rank and select alternatives.
Table -1: Decision Table
. .
. .
. . . . .
. . . . .
. .
Zhang Yao & Fan Zhiping [1] developed a method attribute decision making based on incomplete linguistic judgment matrix. This matrix is transformed into incomplete fuzzy judgment matrix and an optimization model is developed on the basis of incomplete fuzzy judgment matrix provided by the decision maker and the decision matrix to determine attribute weights by lagrange multiplier method. Then the overall values of all alternatives are calculated to rank them.
© 2017, IRJET | Impact Factor value: 5.181 | ISO 9001:2008 Certified Journal | Page 1952
Patricia A. Berger [3] describes the development of amulti-attribute decision model that generates depictions of the agricultural landscape for use in alternative future studies. The model first evaluates any changes in the land base due to conversion of farmland to non-agricultural uses, and then uses field descriptions, crop characteristics, and the decision paradigm of an agricultural producer to determine the preferred crop for each field under a particular policy scenario.
Celik Parkan & Ming-Lu Wul [4] presents a decision-making and performance measurement models with applications to robot selection. This model demonstrates the use of and compares some of the current multi-attribute decision making (MADM) and performance measurement methods through a robots selection problem. The final selection is made on the basis of the rankings obtained by averaging the results of OCRA, TOPSIS, and a utility model.
1.1 TOPSIS
Technique for order preference by similarity to ideal solutions (TOPSIS) is one of the technique for solving decision-making problems. This technique is suggested by Yoon & Hwang in 1981. Any problems of the type of the multi-attribute decision with M alternative and N criteria can be evaluated in a geometric system with ‘m’ points in ‘n’ dimensional space. Based on the idea the best alternative should have the shortest distance from a positive ideal solution (the best possible) and the longest distance from negative ideal solution (the worst possible).
The TOPSIS technique consists of following steps.
Step 1: Normalize the decision matrix: The normalization of the decision matrix is done using the below transformation for each nij :
Then, weights should be multiplied to normalized matrix.
Step 2: Determine the positive and negative ideal alternatives:
Error! Reference source not found. = {Error! Reference source not found. , Error! Reference source not found. , … , Error! Reference source not found.} = {(Error! Reference source not found. | j ϵ J ) , (Error! Reference source not found. | j ϵ J’ | i = 1 , 2 , … , m)}
J = { j = 1 ,2 , … , n | j f or positive attributes }
Positive attribute: The one which has the best attribute values (more is better).
J’ = { j = 1 , 2 , … , n | j f or negative attributes }
Negative attribute: The one which has the worst attribute values (less is better).
In addition, the weighted normalized decision matrix should be calculated with multiplying the normalized decision matrix by its associated weights. The weighted normalized value Error! Reference source not found. is calculated as: Error! Reference source not found. = Error! Reference source not found.
Where Error! Reference source not found. represents the weight of the jth attributes or criterion.
Error! Reference source not found. = {Error! Reference source not found. , Error! Reference source not found. , … , Error! Reference source not found. } = {( Error! Reference source not found. | j ϵ J ) , (Error! Reference source not found. | j ϵ J’ | i = 1,2, … , m)}
J = { j = 1,2, … , n | j f or positive attributes}
J’ = { j = 1,2, … , n | j f or negative attributes}
Step 3: Obtain the separation measure (based on Euclidean distance) of the existing alternatives from ideal and negative one (the separation between alternatives will be found according to distance measure called normalized Euclidean distance (Szmidt & Kacprzyk, 2000)):
dError! Reference source not found.= {Error! Reference source not found. - Error! Reference source not found. ; i = 1,2, … , m
dError! Reference source not found.= {Error! Reference source not found. - Error! Reference source not found. ; i = 1,2, … , m
Step 4: Calculate the relative closeness to the ideal alternatives:
clError! Reference source not found. = dError! Reference source not found. / ( dError! Reference source not found.+
dError! Reference source not found. ) ; 0 ≤ clError! Reference source not found.≤ 1 : i = 1,2, … , m
© 2017, IRJET | Impact Factor value: 5.181 | ISO 9001:2008 Certified Journal | Page 1953
2. PROBLEM FORMULATION
India is a republic and democratic country celebrating its 66th republic day in year 2015. Therefore becoming an advanced country from day to day, year to year there are lots of many up gradations in every field of technology. Today demand for all kind of products is increasing day by day with many options available hence increasing the competition day by day.
Basically, people in India have a single kind of mentality i.e. A person should have as much as he/she can have in lest amount of rupees. But in technical aspects, the product should be good in terms of technical aspects according to the requirement of applications. Therefore this paper will help to find out the best product according to the need of required applications.
[image:3.595.299.568.97.278.2]To carry out the research work in this paper total 6 numbers models have been selected and all the models selected are of same power. The tractor models which have been compared in the paper have been shown in table 2.
Table -2: Models with make
S.No Model Name Tractor Make 1 DI 740 III S3 International Tractors Limited
(ITL)
2 744 FE Punjab Tractors Limited (PTL) 3 5045 D John Deere India Private Limited
(John Deere)
4 EICHER 5150 Tractors and Farm Equipment Limited (TAFE)
5 2042 DI Indo Farm Equipment Limited (Indo Farm)
6 PREET 4549 Preet Group of Companies (Preet)
The technical attributes of the above listed models have been discussed below in the paper.
2.1 Technical attributes
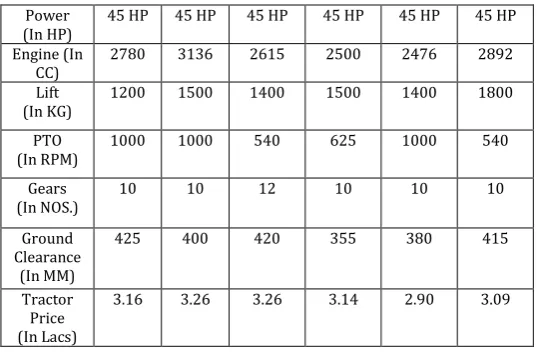
The research has been carried out in this paper to find the best tractor among the six selected tractors. Configurations of all the six tractors have been collected and same have been shown in table 3 in the comparison form. Total six configurations have been compared in the table 3.
Table -3: Comparison of tractor configurations
Make ITL PTL John
Deere TAFE Farm Indo Preet Specs
Model DI 740
III S3 744FE 5045 D EICHER5150 2042DI PREET4549
Power (In HP)
45 HP 45 HP 45 HP 45 HP 45 HP 45 HP
Engine (In CC)
2780 3136 2615 2500 2476 2892
Lift
(In KG) 1200 1500 1400 1500 1400 1800
PTO
(In RPM) 1000 1000 540 625 1000 540
Gears
(In NOS.) 10 10 12 10 10 10
Ground Clearance
(In MM)
425 400 420 355 380 415
Tractor Price (In Lacs)
3.16 3.26 3.26 3.14 2.90 3.09
3. METHODOLOGY
To carry out the research work MADM approach has been used, the work has been carried out in total four number of different phases. All the phases has been described in the paper research work has been done in the different phases.
3.1 Survey
The first initiatory step to carry out the research work is to collect the attributes i.e. data on which the research could be done. The data has been collected on tractors for which six numbers of companies has been surveyed. Survey has been done in the companies like – International tractors limited, Punjab tractors limited, John deere, Tafe, Indofram and Preet tractors.
3.2 Data segregation and preparation
After the data (attributes) has been collected, it is necessary to segregate the data in a tabular form so as to compare the attributes. This has already been shown in table 3.
3.3 Manual comparison of technical attributes
The manual comparison has been done by using TOPSIS of MADM approach. However, to perform the manual comparison there are some steps for manual comparison , equations are used for manual comparison and there are also some rules for manual comparison.
There are total six steps for manual comparison that are given below:
Step 1: Prepare decision matrix Step 2: Normalize the matrix
© 2017, IRJET | Impact Factor value: 5.181 | ISO 9001:2008 Certified Journal | Page 1954
Step 4: Multiply the weightage to the normalized matrix.Step 5: Apply TOPSIS i.e. calculate Ideal positive & Negative alternatives
Step 6: Calculate the relative closeness i.e. 1.
There are total five numbers of different equations used for the manual comparison and those are given below in table 4.
Table -4: Equations used in manual comparison
Sr. No. Area of applying
equation Equation
1. To prepare normalize matrix
2. Multiplying weightage and normalize matrix =
3. Calculating ideal
positive attribute = { -
4. Calculating ideal
negative attribute = { -
5. Relative closeness C = / ( + )
There are also some rules for comparison while using TOPSIS technique. These rules should be always kept in mind while making comparison. Total three rules have been given below in this paper.
Rule 1: The rows and column of decision matrix should be of same quantity i.e. the number of companies (alternative) should be same to the number of specifications (attributes). Therefore in the work content total 6 (six) different attributes have been considered of total 6 (six) different companies.
Rule 2: The specifications (attributes) should be considered of common platform. Therefore, in the work content the specification of 45 HP tractor model has been considered of six different companies.
Rule 3: Weightage should be assigned to every type of specification such that the sum of all the specifications should come out to b one (1) only. Weightage can be assigned according to the need of consumer. It is not necessary to assign a fix weightage to any kind of specification.
The weightages to the specifications will be assigned by the consumer. The higher weightage can be assigned to the specifications which is on most priority and similarly
the weightage will continue to decrease to the least priority specification (attribute).
[image:4.595.29.291.224.427.2]The weightages assigned should be such that the sum of these weightages should comes out to be one (1) only. Table 5 shows the weightage assigned to the specifications (attributes).
Table -5: Weightage assigned to specifications (attributes)
Sr. No. Specification (Attribute) Weightage assigned
1. Engine displacement 0.25
2. Hydraulic lift capacity 0.18
3. Power take off 0.15
4. Gear speeds 0.12
5. Ground Clearance 0.10
6. Tractor Price 0.20
Manual comparison of the problem has been done below in the paper by using TOPSIS technique of MADM approach. The calculation will be done as per the six discussed steps.
Step 1: Prepare the decision matrix
Step 2: Normalize the decision matrix: The above discussed equation will be used to normalize the prepared decision matrix ,and the normalized matrix (Error! Reference source not found.) is given below.
Step 3: Assign weightage (Error! Reference source not found.) to the attributes
= 0.25 = 0.18 = 0.15 = 0.12 = 0.10 = 0.20
[image:4.595.306.548.531.589.2]© 2017, IRJET | Impact Factor value: 5.181 | ISO 9001:2008 Certified Journal | Page 1955
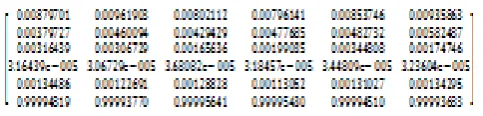
Step 4: Multiplying the weightage matrix (Error! Referencesource not found.) and normalized matrix (Error! Reference source not found.) to form weight normalized matrix (Error! Reference source not found.). The weight normalized matrix (Error! Reference source not found.).
Step 5: Apply TOPSIS, calculate ideal positive and negative attributes
Take out Error! Reference source not found. array [Highest (+ve) value in column] from weight normalized matrix Error! Reference source not found.).
Take out Error! Reference source not found. array [Highest (-ve) value in column] from weight normalized matrix Error! Reference source not found.).
Now, calculate ideal positive (Error! Reference source not found.) & ideal negative (Error! Reference source not found.) alternative.
Ideal positive alternative, Error! Reference source not found. = [Error! Reference source not found. - Error! Reference source not found. Error! Reference source not found.
Ideal negative alternative, Error! Reference source not found. = [Error! Reference source not found. - Error! Reference source not found. Error! Reference source not found.
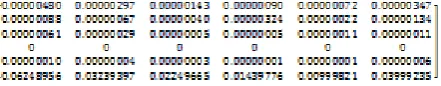
Prepare, separation measurement matrix by using ideal positive (Error! Reference source not found.).
Put all the values in the matrix (Error! Reference source not found.)
Now, add all the rows
Error! Reference source not found. =Error! Reference source not found. Error! Reference source not found.
Error! Reference source not found. = 0.422565, Error! Reference source not found. = 0.424401, Error! Reference source not found. = 0.42525, Error! Reference source not found. = 0.426342, Error! Reference source not found. = 0.425802, Error! Reference source not found. = 0
Prepare, separation measurement matrix by using ideal positive (Error! Reference source not found.).
Put all the values in the matrix (Error! Reference source not found.)
Now, add all the rows
Error! Reference source not found. =Error! Reference source not found. Error! Reference source not found.
Error! Reference source not found. = 0.003741, Error! Reference source not found. = 0.001965, Error! Reference source not found. = 0.001122, Error! Reference source not found. = 0, Error! Reference source not found. = 0.000540, Error! Reference source not found. = 0.426342
Step 6: Calculate the relative closeness (Error! Reference source not found.) by using the below mentioned formula
Error! Reference source not found. = Error! Reference source not found. ; 0 < Error! Reference source not found. < 1
Error! Reference source not found. = 0.0087753, Error! Reference source not found. = 0.0046087, Error! Reference source not found. = 0.0026315, Error!
Reference source not found. = 0, Error! Reference source not found. = 0.0012665, Error! Reference source not found. = 1
[image:5.595.310.531.268.311.2]Hence, based upon the relative closeness calculated, ranking is shown in table 6.
Table -6: Calculated tractor ranking after manual comparison.
Ranking Model Make
1st PREET 4549 PREET Tractors
2nd DI 740 III S3 International Tractors Limited
© 2017, IRJET | Impact Factor value: 5.181 | ISO 9001:2008 Certified Journal | Page 1956
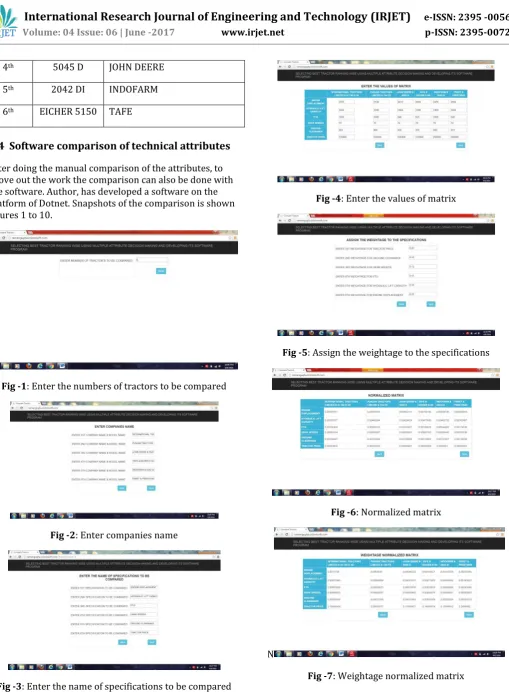
4th 5045 D JOHN DEERE
5th 2042 DI INDOFARM
6th EICHER 5150 TAFE
3.4 Software comparison of technical attributes
After doing the manual comparison of the attributes, to prove out the work the comparison can also be done with the software. Author, has developed a software on the platform of Dotnet. Snapshots of the comparison is shown figures 1 to 10.
Fig -1: Enter the numbers of tractors to be compared
Fig -2: Enter companies name
Fig -3: Enter the name of specifications to be compared
Fig -4: Enter the values of matrix
Fig -5: Assign the weightage to the specifications
Fig -6: Normalized matrix
N
[image:6.595.47.557.39.732.2] [image:6.595.54.271.431.710.2]© 2017, IRJET | Impact Factor value: 5.181 | ISO 9001:2008 Certified Journal | Page 1957
WeFig -8: Ideal positive measurement matrix
Fig -9: Ideal negative measurement matrix
Fig -10: Relative closeness and ranking
4. CONCLUSION
After the manual comparison of attributes by using MADM approach and TOPSIS, it has been truly diversified the range for selecting any best option in any area of application. Here in this paper, the comparison has been done to select a best tractor and to prepare the ranking, similarly this technique can be used to select any best automobile or any other items which have their own particular specifications. Thus the conclusion here comes that MADM approach using TOPSIS can be used in any term or in any area of field to select any of the best option.
ACKNOWLEDGEMENT
The constant guidance and encouragement received from Mr. Raman Arora, assistant professor of mechanical engineering department of PCET, Lalru has been of great help in carrying the research work and is acknowledged with reverential thanks.
REFERENCES
[1] Zhang Yao and Fan Zhiping, “Method for multiple attribute decision making based on incomplete linguistic judgment matrix”, Science Direct, Year 2008, Vol-19, Issue 2, 298-303.
[2] Jian Ma, “An Approach to Multiple Attribute Decision Making Based on Preference Information on Alternatives”, Elsevier North-Holland, Year 2002, Vol.-131, Issue 1, 101-106.
[3] Particia A. Berger, “Generating Agricultural Landscape for Alternative Futures Analysis: A Multiple Attribute Decision-Making Model”, Pergamon Press, Year 1998.