http://dx.doi.org/10.4236/jtts.2016.64020
A Short-Term Traffic Flow Forecasting
Method Based on a Three-Layer
K-Nearest Neighbor Non-Parametric
Regression Algorithm
Xiyu Pang
1, Cheng Wang
1, Guolin Huang
21School of Information Engineering, Shandong Jiaotong University, Jinan, China
2Department of Intelligent Traffic Engineering, Yigou Software Technolog Co. Ltd., Jinan, China
Received 4 July 2016; accepted 19 July 2016; published 22 July 2016
Copyright © 2016 by authors and Scientific Research Publishing Inc.
This work is licensed under the Creative Commons Attribution International License (CC BY).
http://creativecommons.org/licenses/by/4.0/
Abstract
Short-term traffic flow is one of the core technologies to realize traffic flow guidance. In this article, in view of the characteristics that the traffic flow changes repeatedly, a short-term traffic flow fo-recasting method based on a three-layer K-nearest neighbor non-parametric regression algorithm is proposed. Specifically, two screening layers based on shape similarity were introduced in K- nearest neighbor non-parametric regression method, and the forecasting results were output us-ing the weighted averagus-ing on the reciprocal values of the shape similarity distances and the most-similar-point distance adjustment method. According to the experimental results, the pro-posed algorithm has improved the predictive ability of the traditional K-nearest neighbor non- parametric regression method, and greatly enhanced the accuracy and real-time performance of short-term traffic flow forecasting.
Keywords
Three-Layer, Traffic Flow Forecasting, K-Nearest Neighbor Non-Parametric Regression
1. Introduction
ad-X. Y. Pang et al.
vances, both the travelers and administrators urgently want to acquire the dynamic traffic flow conditions in real time, and a real-time and dynamic traffic assignment has become a key technology in intelligent transportation system. To achieve a favorable traffic assignment, we should predict the traffic flow information at the next de-cision moment (t+1) and even several future moments when making decisions of control variables at the mo-ment t. In general, the short-term traffic flow forecasting refers to the case in which the time span between t and
1
t+ does not exceed 15 minutes (or even is smaller than 5 minutes).
Currently, the short-term traffic flow forecasting models were mainly constructed based on parametric regres-sion methods [1] [2] such as history average model, time series model, Kalman filtering model, wavelet theory, neutral network model and etc. Non-parametric regression is another kind of forecasting model. Unlike with pa-rametric regression method, non-papa-rametric regression method sets no strict limits on the data and describes the system based on the sufficient historical data. Moreover, using non-parametric regression method, the relation-ship between input and output is determined only based on the existing data and the time-consuming adjust-ments are not required when new data are generated. Abroad, the study of non parametric regression short-term traffic flow prediction is in the leading position. In 1987, Yakowit first proposed the K nearest neighbor method used in time series prediction. In 1991, Davis and Nihan applied the method of non-parametric regression into traffic prediction .They pointed out that the K nearest neighbor method is suitable for traffic prediction, because the traffic data itself reflects the nonlinear characteristics.
K-nearest neighbor non parametric regression method is proved to be a reliable method for short-term traffic flow forecasting [3] [4], which can favorably reflect the traffic flow’s non-linearity, time-dependent characteris-tic and uncertainty. Non parametric regression method does not require a priori knowledge, only sufficient his-torical data, it is looking for the similar nearest neighbors between hishis-torical data and the current point, and use these “neighbors” to predict the traffic flow of the next time. The non parametric regression algorithm considers that the intrinsic link between all factors of the system is contained in the historical data. Therefore, the non pa-rametric regression method directly obtains the information from historical data instead of the historical data to establish an approximate model.
However, road traffic system is a nonlinear system characterized by time-dependence and complexity and ex-hibits a distinctive feature—high uncertainty, which makes the forecasting model based on a single-layer K-nearest neighbor non-parametric regression present low stability in predicting complex traffic flows. On the other hand, some combined short-term traffic flow forecasting methods exhibit complex algorithms and heavy calculation burdens; additionally, the forecasting accuracy and real-time requirements always cannot be satisfied simulta-neously.
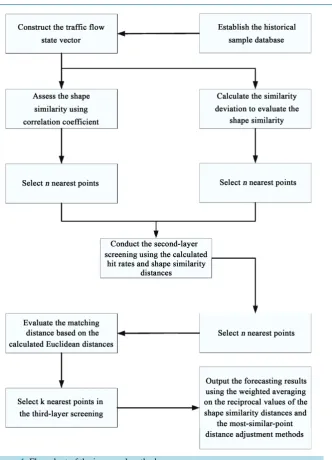
Therefore, this article proposed a short-term traffic flow forecasting method based on a three-layer K- nearest neighbor model. In view of the fact that the traffic flow variations are repeatable, two layers with shape-similarity screening function were introduced in K-nearest neighbor non-parametric regression method, in which the shape similarity between the current point and the data in historical database was measured by similarity deviation and correlation coefficient, respectively. The hit rates in the screening results using two shape-similarity measurement methods were calculated and their respective similarities were ranked. Fur-thermore, the forecasting results were output based on the weighted averaging on the reciprocal values of the shape similarity distances between the traffic flows at each nearest neighbors and the next moment of the cur-rent point.
2. The Improved Short-Term Traffic Flow Forecasting Method
Figure 1. Flow chart of the improved method.
2.1. The First-Layer Screening
Euclidean distance can only reflect the closeness between the current point and the point in historical database
[5], but cannot directly reflect their similarity. Shape similarity can directly reflect the traffic flow’s variation and development rules. The similar variations in traffic flow parameters reflect a similar evolutionary physical process in traffic flow and the similar traffic flow variation rules can produce the similar results.
In this article, using the shape-similarity-based K-nearest neighbor non-parametric regression method, the points in the historical database were firstly matched and screened, and the algorithm is detailed described be-low.
The traffic flow time series was used as the traffic flow state vector V and can be written as:
( )
(
1 ,) (
2 ,)
,( )
V t =v t− +l v t− +l v t (1)
In which, V(t) denotes the traffic flow state vector of the current road at the moment t, v t
(
− +l 1)
,(
2 ,)
,( )
respec-X. Y. Pang et al.
tively, and l denotes the dimension of the state vector.
In the present study, the shape similarity between the current point and the point in historical database was evaluated using the similarity deviation R. The points in historical database were screened based on the calcu-lated R values, and the set of points after the first-layer screening was denoted as A. R can be calcucalcu-lated by:
1
1 l i i
R d E
l =
=
∑
− (2)(
)
(
)
1
1
, 1 1
l
i i h
i
E d d v t i v t i
l =
=
∑
= − + − − + (3)In which, R denotes the similarity deviation between the current point and a point in historical database, l de-notes the dimension of the traffic flow state vector, E denotes the overall mean difference of all the components between the current point and a point in historical database, didenotes the difference of the (l + 1 − i)th Vector component between the current point and a point in historical database and i ranges from 1 to l. Then, the calcu-lated R values between the current point and the points in historical database were sorted in the order of smallest to largest and n points with the nearest distances were selected. The set of points after the similarity-
deviation-based screening was then denoted as A=
{
v t( ) ( )
1 ,v t2 ,,v t( )
n}
.The shape similarity between the current point and a point in historical database was assessed by the correla-tion coefficient R′. R′ can be calculated by:
(
) ( )
(
)
(
(
)
( )
)
(
) ( )
(
)
(
(
)
( )
)
1 2 2 1 1 1 1 1 1 l h h i l l h h i iv t i v t v t i v t
R
v t i v t v t i v t
= = = − + − − + − ′ = − + − ⋅ − + −
∑
∑
∑
(4)In which, R′ denotes the correlation coefficient between the current point and a point in historical database and l denotes the dimension of the traffic flow state vector.
( )
v t represents the average value of all vectors in the current traffic flow state vector V t
( )
, v t( )
is ob-tained by the Equation (5).( )
(
)
1 1 1 l iv t v t i
l =
=
∑
− + (5)( )
hv t represents the average value of all vectors in the historical traffic flow state vector V th
( )
, vh( )
t is obtained by the Equation (6).( )
(
)
1 1 1 l h h iv t v t i
l =
=
∑
− + (6)Then, the calculated R′ values between the current point and the points in historical database were sorted in the order of largest to smallest and n points with the nearest distances were selected. The set of points after the correlation-coefficient-based screening was then denoted as A′=
{
v t( ) ( )
1′ ,v t2′ ,,v t( )
n′}
.The first layer of the matching and screening is completed after getting the set A and A′.2.2. The Second-Layer of Screening
Subsequently, the points in A and A′ were evaluated comprehensively based on the calculated hit rates and shape similarities, and then the set of points after the second layer of matching and screening was acquired and denoted as B.
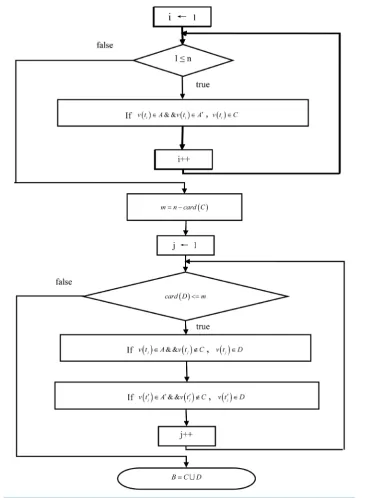
As shown in Figure 2, the comprehensive evaluation on the sets A and A′ based on the calculated hit rates and shape similarities includes the following steps:
1st step: set i = 1;
2nd step: for any a point v t
( )
i in set A, if v t( )
i ∈A′, we can obtain v t( )
i ∈C; 3rd step: set i=1, 2,,n and repeat the 2nd step;Figure 2. Flow chart of the second screening.
5th step: for any a point v t
( )
j in set A, if v t( )
j ∉C, we can obtain v t( )
j ∈D; for any a point v t′( )
j in setA′, if v t
( )
′ ∉j C, we can obtain v t( )
′ ∈j D;6th step: set j=1, 2,,n and repeat the 5th step until card D
( )
=m.Then the union set of set C and set D was acquired and denoted as B, i.e., B=CD. B is the set of points after the second layer of matching and screening.
suc-X. Y. Pang et al.
cessively from set A and set A′ to form the set D. Totally n points were included in set C and set D, which were thus the results after the second layer of matching and screening.
2.3. The Third-Layer Screening
The third-layer matching of the points were conducted using the improved K-nearest neighbor non-parametric regression method, and thus the traffic flow at the next moment could be predicted.
The similarity between the current point and any a point in set B was evaluated by calculating the Euclidean distance between them. The Euclidean distance between two points can be calculated by [6] [7]:
(
)
(
)
(
)
21
l
h h
i
d v t i l v t i l
=
=
∑
− + − − + (7)In which, d denotes the matching distance between the current point and any a point in set B and l denotes the dimension of the traffic flow state vector.
Then the points in set B were sorted according to the matching distances with the current point in the order of smallest to largest, and k points with nearest matching distances were selected.
The forecasting function was then constructed using the weighted averaging on the reciprocal of the shape similarity distances and the most-similar-point distance adjustment methods. The specific formula can be written as:
(
)
(
(
)
)
1
ˆ 1 1
k j
j j
j j
R
v t a v t b
R = ′ + = + +
∑
(8)(
)
(
)
(
)
1 1
1
1 1 ,
l k
j
j j
i j j
R
b v t i v t i a
l = = R
′
=
∑
− + − − + =∑
(9)In which, v tˆ
(
+1)
denotes the predicted traffic flow at the next moment using the three-layer K-nearest neighbor non-parametric regression method, k denotes the number of the selected points with the nearest dis-tances with the current point in set B, R′ denotes the correlation coefficient between the current point and the nearest neighbor, R denotes the similarity deviation between the current point and the nearest neighbor, bj de-notes the overall average difference of all the components between the current point and the nearest neighbor and l denotes the dimension of the traffic flow state vector.3. Conclusions
Short-term traffic flow forecasting is an important part in intelligent traffic forecasting system. The short-term traffic flow forecasting results can be directly input to the advanced traffic information system and traffic man-agement system. The forecasting results can provide the travelers with real-time and effective information, help the travels select better routes and acquire route guidance, so as to shorten the travel time and relieve traffic jams
[8]-[10].
In order to improve the forecasting accuracy of the short-term traffic flow, this article modified the traditional K-nearest neighbor non-parametric regression method and proposed a short-term traffic flow forecasting method based on three layers of screening. The experimental results indicate that the proposed algorithm can further en-hance the accuracy in traffic flow forecasting.
With the development of computer technology, the data size increases significantly and how to enhance the algorithm’s accuracy more effectively appears to be particularly important. We should improve the algorithm constantly so as to be adaptive to the traffic’s real-time characteristic and accuracy, and finally make the short- term traffic flow forecasting be widely applied in traffic guidance.
Acknowledgements
No. KT15143 and National Ministry of housing and urban construction 2016 science and technology project plan Grant No. 2016-K8-057.
References
[1] Jing, Y., Gao, J.W., Wang, B. and Leng, Z.W. (2012) Urban Traffic State Discriminant Method. Qingdao University Journal (Engineering and Technology Edition), 3.
[2] Jia, N., Ma, S.F. and Zhong, S.Q. (2012) Traffic Flow Nonparametric Regression Forecasting Method Based on Ge-netic Algorithm to Optimize the KD Tree. Control and Decision, 7.
[3] Yakowitz, S. (1987) Nearest-Neighbour Methods for Time Series Analyais. Journal of Time Series Analysis, 8, 10-26. http://dx.doi.org/10.1111/j.1467-9892.1987.tb00435.x
[4] Davis, G. and Nihan, N. (1991) Nonparametric Regression and Short-Term Freeway Traffic Forecasting. Journal of Transportation Engineering, 117, 178-188. http://dx.doi.org/10.1061/(ASCE)0733-947X(1991)117:2(178)
[5] Jin, S., Wang, D.-H., Xu, C. and Ma, D.-F. (2013) Short-Term Traffic Safety Forecasting Using Gaussian Mixture Model and Kalman Filter. Journal of Zhejiang University-Science A (Applied Physics & Engineering), 4.
[6] Tchrakian, T.T., Basu, B. and O’Mahony, M. (2012) Real-Time Traffic Flow Forecasting Using Spectral Analysis.
IEEE Transactions on Intelligent Transportation Systems, 13, 519-526. http://dx.doi.org/10.1109/TITS.2011.2174634 [7] Chan, K.Y., Dillon, T.S., Singh, J., et al. (2012) Neural-Network-Based Models for Short-Term Traffic Flow
Fore-casting Using a Hybrid Exponential Smoothing and Levenberg-Marquardt Algorithm. IEEE Transactions on Intelli-gent Transportation Systems, 13, 644-654. http://dx.doi.org/10.1109/TITS.2011.2174051
[8] Xu, Y.Y., Kong, Q.J. and Liu, Y.C. (2013) Short-Term Traffic Volume Prediction Using Classification and Regression Trees. IEEE Intelligent Vehicles Symposium (IV), 493-498.
[9] Min, W. and Wynter, L. (2011) Real-Time Road Traffic Prediction with Spatio-Temporal Correlations. Transportation Research Part C, 19, 606-616. http://dx.doi.org/10.1016/j.trc.2010.10.002
[10] Karlafitis, M.G. and Vlahogianni, E.I. (2011) Statistial Methods versus Neural Networks in Transportation Research: Difference, Similarities and Some Insights. Transprotation Research Part C: Emerging Technologies, 19, 387-399. http://dx.doi.org/10.1016/j.trc.2010.10.004
Submit or recommend next manuscript to SCIRP and we will provide best service for you: Accepting pre-submission inquiries through Email, Facebook, LinkedIn, Twitter, etc.
A wide selection of journals (inclusive of 9 subjects, more than 200 journals) Providing 24-hour high-quality service
User-friendly online submission system Fair and swift peer-review system
Efficient typesetting and proofreading procedure
Display of the result of downloads and visits, as well as the number of cited articles Maximum dissemination of your research work