Munich Personal RePEc Archive
New estimates of the hybrid US Phillips
curve
Rao, B. Bhaskara and Cao, Cung
University of Western Sydney, University of Western Sydney
17 December 2010
New Estimates of the Hybrid US Phillips Curve
B. Bhaskara Rao
raob123@bigpond.com
University of Western Sydney, Sydney (Australia)
Cung Cao
cao_cung@yahoo.com.au
University of Western Sydney, Sydney (Australia)
Abstract
This paper examines the validity of Rudd and Whelan’s (2006) critiques of Gali and Gertler’s
(1999) hybrid Phillips curve (HYPC) by re-estimating the HYPC using full information
maximum likelihood (FIML). We also estimate HYPC with the constraint that the weights for
the sum of forward looking and backward looking expectations should be unity. Our results
support Rudd and Whelan’s conclusion that the weight for forward looking expectations is insignificant.
Keywords: New Keynesian Phillips Curve, Price Rigidities, FIML Estimation
1. Introduction
Empirical studies on the new Keynesian Phillips curve (NKPC) reached different conclusions
on the relative importance of forward looking and backward looking expectations. It is
important to re-examine this difference because the real and nominal effects of policy shocks
depend on the relative importance of the weights for forward and backward looking
expectations (weights hereafter). In an influential paper Gali and Gertler (1999) have
developed a hybrid Phillips curve (HYPC) to estimate these weights and found that although
the weight for backward expectations is significant, it is relatively small. This implies that the
degree of persistence in inflation is small, and, therefore, real effects of policy shocks will
also be small.1 According to Rudd and Whelan (2007), there is near consensus among the
new Keynesian economists (NKEs) that the HYPC, with a large weight for forward looking
expectations and a smaller weight for backward looking expectations, provides a sensible and
empirically plausible theoretical framework to analyse inflation.
In another influential paper, Rudd and Whelan (2006) have argued that the Gali and
Gertler HYPC is inappropriate for estimating the weights because the implied expectations
are not strictly rational as they are not model consistent. Using the closed form solutions for
the Gali and Gertler HYPC, to get model consistent rational expectations, they found that the
weight for forward looking expectations is insignificant. Although the Gali and Gertler
methodology may not be appropriate, Rudd and Whelan’s specifications also have limitations
because their reduced form weights do not sum to unity. It is necessary, therefore, to
re-estimate these weights with the constraint that they should add to unity. This is the main
objective of this paper and is structured as follows. Section 2 presents specifications of the
HYPC. Section 3 discusses our empirical results and Section 4 concludes.
1
2. Specifications
The Gali and Gertler HYPC is:
(1) t (1 ) t1 Et[t1]yyt
where rate of inflation, ya proxy for real marginal costs, e.g., the share of labour income (s) and weight for forward expectation of inflation. This can be estimated with the generalised method of moments (GMM) by replacing Et[t1]with t1. However, as
Rudd and Whelan point out, this does not give model consistent rational expectations. Rudd
and Whelan’s closed form solutions, based on model consistent rational expectations, are different when 0.5and 0.5.The structural closed form solutions, with their reduced forms, are:
(2)
1
0
2 1 1
0
1
=
when 0.5.
t t t t k
k
t t t k
k E y E y
(3) 0 1 2 0 1 1 =when 0.5.
k
t t t k
k
k t t k k E y E y
where the reduced form weights for forward looking expectations are1 and 1 and for backward looking expectations 2 and 2. Rudd and Whelan estimated (2) and (3) without the constraint these weights sum to unity. For example their estimates, in Table 2, for of
1
(4) 1 1 1 0
(1- )
when 0.5.
t t t t k
k E y
and(5) 1 1
0
= (1 )
when 0.5.
k
t t t k
k E y
3. Empirical Results
To conserve space and avoid problems in selecting the instrumental variables, we used full
information maximum likelihood (FIML), instead of GMM, for estimation.2 For comparisons
we estimated the Gali and Gertler specification in equation (1) with alternative proxies for
,
y the driving force of inflation, with the output gap (GAP), share of labour income (s) and
the probability of placement for newly unemployed workers (JFP). GAP gave the best results
and this is shown below.
(6) 1 1
(0.04)*** (0.04)*** (0.03)***
0.8335 0.1665 [ ] 0.4446
t t Et t GAPt
Standard errors are below the coefficients in the parentheses and *** indicates significance at
the 1% level. The implied discount factor to discount future profits is 0.969, which implies a
discount rate of 3.21% and this is plausible. Unlike the Gali and Gertler GMM estimates, our
estimates with the updated data and FIML imply that backward looking expectations are
almost five time more important than forward looking expectations. As noted in footnote 2
above, while our estimates are free from the instrumental variable selection bias, the
2
instrumental variables selected by Gali and Gertler are likely to overestimate the weight for
forward looking expectations and underestimate the weight for backward looking
expectations.
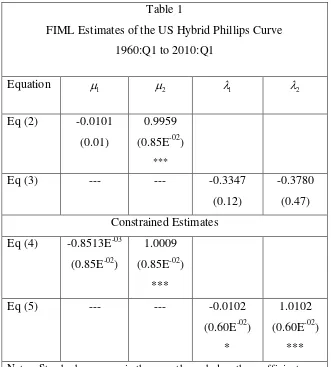
Using GAP as the driving force, FIML estimates of the unconstrained and
constrained reduced form equations (2) to (5) are given in Table 1.
[image:6.595.133.464.215.582.2]
Table 1
FIML Estimates of the US Hybrid Phillips Curve
1960:Q1 to 2010:Q1
Equation 1 2 1 2
Eq (2) -0.0101
(0.01)
0.9959
(0.85E-02)
***
Eq (3) --- --- -0.3347
(0.12)
-0.3780
(0.47)
Constrained Estimates
Eq (4) -0.8513E-03
(0.85E-02)
1.0009
(0.85E-02)
***
Eq (5) --- --- -0.0102
(0.60E-02)
*
1.0102
(0.60E-02)
***
Compared to the estimates of the Gali and Gertler equation, estimates of the Rudd and
Whelan equations, especially estimates of the unconstrained equation (3), are somewhat less
than impressive. In equation (3) both weights are negative and insignificant. In the other three
equations the weight for backward looking expectation is almost unity, implying that forward
looking expectations do not seem to have any effect on the dynamics of inflation. However,
like in the Rudd and Whelan estimates, the weights for the forward looking expectations are
insignificant and have the wrong signs. Broadly, our results support Rudd and Whelan’s
general conclusion that forward looking expectations are insignificant in the inflation
dynamics. Even estimates in the Gali and Gertler equation are supportive of the conclusion
that forward looking expectations play a smaller role in the dynamics of inflation.
A plausible explanation for these differences is as follows. While the Gali and Gertler
specification seems to be more applicable for the short to medium terms, the Rudd and
Whelan specifications, based on the closed form solutions, may be more appropriate for
longer periods. It is also likely that firms may not form model consistent expectations
because there is no correct model for explaining the dynamics of inflation. Furthermore, as
Rudd and Whelan have noted, inertia in the formation of expectations, due to bounded
rationality, may be more important than inertia in adjusting prices by firms.
4. Conclusions
This paper estimated the US NKPC for the period 1960Q1 to 2010Q1. Our estimates with the
Gali and Gertler HYPC showed that forward looking behaviour plays a relatively minor role
in the dynamics of inflation. Estimates with the Rudd and Whelan specifications show that
forward looking expectations have no role at all in the dynamics of inflation. Results of this
paper support the Rudd and Whelan conclusion that a traditional specification of the Phillips
curve, which depends on the output gap and the past rates of inflation is adequate to explain
the dynamics of inflation. Therefore, one would expect that policy interventions to have
significant real effects. A model in which inertia to adjust expectations plays a more
important role, such as in Mankiw and Reis (2003), may explain observed facts better than
the new Keynesian models based on inertia in price adjustments.3 Thus, this paper supports
3
A similar friction in forming rational expectations was used by Rao (1991). His justification is that the
the observation of Rudd and Whelan (2007) that there are a number of reasons to be sceptical
about the new Keynesian framework that has became the new benchmark inflation modelling
and in particular its corner stone of forward looking expectations.
time period. This implies that E[ ]t ( t1t*)t1,where asterisk denotes equilibrium value and
Data Appendix
All series are quarterly data from the United States from 1960Q1 to 2010Q1. We use core
CPI as our measure of inflation and this excludes prices of food and energy.
Variable Definition Source
t
t
is measured as
4
ln t t
p p
using core CPI. Core CPI -
Consumer Price Index (All Items Less Food and Energy),
Index 1982-1984=100.
Bureau of Labor
Statistics (BLS).
y and
GAP
Output Gap (Nonfarm Business Sector Output, Index
1992=100), using the Hodrick-Prescott filter with a
smoothing parameter of 1600.
Bureau of Labor
References
Gali, J. and M. Gertler (1999), “Inflation dynamics: A structural econometric analysis”, Journal of Monetary Economics, 44, 195-222.
Mankiw, Gregory and Ricardo Reis (2002), “Sticky Information Versus Sticky Prices: A
Proposal to Replace The New Keynesian Philips Curve”, The Quarterly Journal of Economics.
Rao, B. B. and Srivastava, V. K. (1991), “A Disequilibrium Model of Rational Expectations for the
U.K.”, Economic Journal, 101: 877-86.
Rudd, Jeremy, and Karl Whelan (2006), “Can Rational Expectations Sticky-Price Models Explain
Inflation Dynamics?” American EconomicReview 96 (March): 303–20.
Rudd, Jeremy, and Karl Whelan (2007), “Modelling Inflation Dynamics: A Critical Review of Recent