Application of AHP in the Design of a Strategy Map
Luis E. Quezada1, Pedro I. Palominos1, Miguel A. Gonzalez2
1
Department of Industrial Engineering, University of Santiago of Chile, Santiago, Chile; 2School of Industry, Andres Bello Univer-sity, Santiago, Chile.
Email: [email protected]
Received July, 2013
ABSTRACT
This paper presents an application of the Analytic Hierarchy Process (AHP) to support the creation of a strategy map. A strategy map is a representation of the cause-effect relationships between strategic objectives of a Balanced Scorecard (BSC). The method proposed establishes the relationships that are important within the strategy map. The case of seven companies is presented, where the method is applied and the results are compared with the actual maps defined by the companies. The comparison is made to determine in which extend the proposed method is useful for establishing the causal relationships in a strategy map.
Keywords: Analytic Hierarchy Process; Strategy Map; Balanced Scorecard
1. Introduction
Neely [1] in his review of the ISI Web of Science data-base found 1352 papers published in 546 different jour-nals containing the phrase “performance measurement” in their title, abstract or keywords. This is a measure of the importance of the subject in the literature. He also found that more than 80% of these papers were published after January 1995, which means that the subject has been received attention only recently. The Balanced Scorecard (BSC) is the performance measurement sys-tem most cited in the literature and that has become very popular among practitioners. [1,2]. The BSC [3,4] was developed by Kaplan and Norton originally as manage-ment control system, but it has developed to become a complete strategic management system [5-7].
The strategy map is part of the BSC. It is composed of a set of strategic objectives linked by cause-effect rela-tionships [8]. The relarela-tionships are defined by managers of firms in a subjective matter [9]. In the same way, Qu-ezada et al. [10] propose a methodology to build a strat-egy map, based on the way companies actually do it.
In the literature, it was found that a small number of authors use quantitative methods to model performance measurements. Some of them use the Analytic Hierarchy Process (AHP) [11,12], such as those proposed by Cheng et al. [13], Bittici et al. [14] Lee et al. [15], Sarkis [16] and Temur et al. [17]. Others such as Yurdakul [18] and Yurdakul and Ic [19] use the Analytic Network Process (ANP) [20]. Other authors, such as Huang et al., [21], Tseng [22] and Yüksel and Dagdeviren [23] utilize AHP/ ANP to support the modeling of a Balanced Scorecard.
In all the cases where AHP and/or ANP are used, the relationships are pre-defined so what they do is to assign priorities to the strategy objectives. In this work, a mechanism to get those relevant relationships is pro-posed.
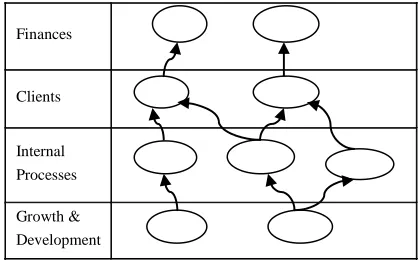
[image:1.595.317.527.588.721.2]As stated above, a strategy map is a graphical repre-sentation of the strategy of a firm. It contains strategic objectives, which are classified into four perspectives: (a) Finances, (b) Clients, (c) Internal Processes and (d) Growth & Development. The objectives are linked ac-cording to a causal relationship.
Figure 1 shows a representation of a strategy map, where the nodes correspond to strategic objectives and the arcs correspond to cause-effect relationships.
The strategy map is modeled as hierarchy, where all the nodes of one level are initially connected to all the levels of the immediate lower level. An initial node is added (level 0).
Finances
Clients
Internal Processes
Growth & Development
Figure 2 shows an example of a hierarchical model. What the method does is to estimate the “priority” of every arc and select those that are “more important”.
2. The Method
The method works at follows:
For the top node (level 0) and level 1:
1
j
w = priority of node j of level 1
For any level K and level K+1, let’s consider a node j and a node i ( Figure 3).
Using AHP techniques, the importance of any node i in relation to a node i can be estimated.
Let
ij
a = importance of node i in relation to a parent node j
K j
w = importance of node j in level K
The importance of the relationship between a node j and a node i is calculated as:
a K i ij ij j
b w , j (1)
Clearly
1 j ij
i
b
(2)The next step is the selection of those relationships (arcs) that are “important”. The arcs i-j with the highest importance that account for the 80% of the importance are selected. This calculation is repeated for all the lev-els.
However, in a strategy map, there must be always a path from any node to the top node, but this method may fail in doing this. So, when a node is not connected, the arc with the highest importance connected to it is added. This is a variation of the method proposed by Quezada and Quintero [24], who uses a different method for se-lecting the “important” arcs they do not make any valida-tion of their proposal, which is the main purpose of this work.
Finances
Clients
Internal Processes
Growth & Development
Figure 2. Hierarchical model of a strategy map.
Level K
Level K+1
nK
1 j
1 i n K+1
Figure 3. Relationships between levels.
3. Evaluation of the Method
The method was applied in 7 companies. They will be called E1, E2, E3, E4, E5, E6 and E7. Table 1 shows the type of products and services they offer. The application aims at comparing the actual strategy map with that ob-tained with the method. The comparison is made to de-termine in which extend the proposed method is useful for establishing the causal relationships in a strategy map.
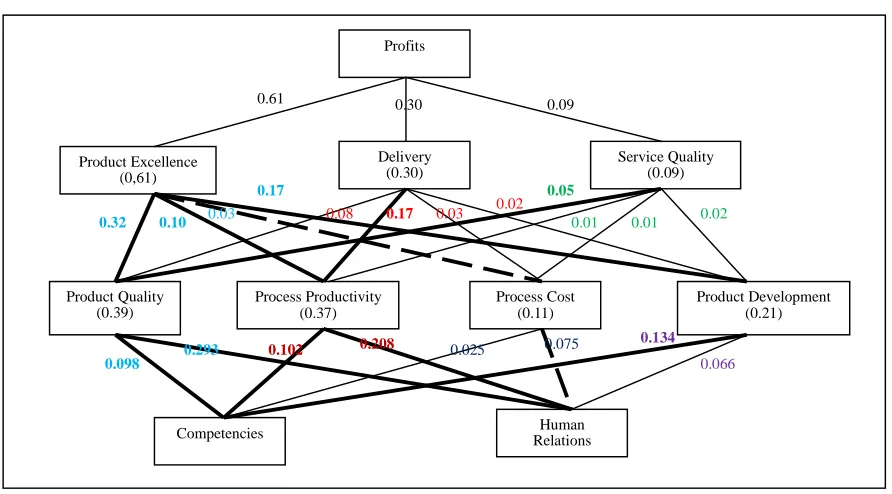
As an illustration, the case of company E2 is described. Figure 4 depicts the initial hierarchical model, where all the nodes (objectives) of a level are connected to all the nodes (objectives) of the subsequent level. The impor-tance of every relationship is estimated using AHP tech-niques [11]. Then the importance of every relationship is weighed by the importance of corresponding parent node. The result of this operation is shown in Figure 5. Finally, those relationships that account the 80% of importance are selected and the rests are eliminated. They are high-lighted in Figure 5. It should be noted that it was neces-sary to add “unimportant” relationships to the strategy map in order to avoid leaving nodes without a connection, which is the case of those relationships drawn with a different type of line in Figure 5. For the same reason, all the arcs from the finances perspective to the clients’ perspective were maintained.
Finally, Figure 6 shows the strategy map of company E2, which was obtained by deleting all the “unimportant” relationships.
Table 1. Products/services of companies.
Company Product/Service
E1 Steel coating
E2 Plastic
E3 Electric generation
E4 Graphic printing
E5 Chemical products
E6 Forestry
Profits
Product Excellence (0,61)
Delivery (0.30)
Service Quality (0.09)
Competencies
Product Development (0.21) Process Cost
(0.11) Process Productivity
(0.37) Product Quality
(0.39)
Human Relations
0.61 0.30 0.09
0.52 0.16 0.05 0.28
0.27 0.57 0.10 0.07
0.56
0.13 0.08 0.22
0.25 0.75 0.25
0.75 0.67
0.33
[image:3.595.67.528.85.331.2]0.33 0.67
Figure 4. Initial hierarchical model.
Profits
Product Excellence (0,61)
Delivery (0.30)
Service Quality (0.09)
Competencies
Product Development (0.21) Process Cost
(0.11) Process Productivity
(0.37) Product Quality
(0.39)
Human Relations
0.61 0.30 0.09
0.32 0.10 0.03 0.17
0.08 0.17 0.03 0.02 0.05
0.01 0.01 0.02
0.098
0.293 0.025 0.075 0.134
0.066
[image:3.595.75.521.354.601.2]0.102 0.208
Figure 5. Final hierarchical model.
The following indicators are calculated for the result-ing strategy map
ARI = average (over the levels) of the accumulated importance of the relationships between two levels per number of relationships between the levels.
AI = accumulated importance of the relationships
be-tween two levels. In the case of company E2 the values are:
RI = accumulated importance of the relationships be-tween two levels divided by the number of relationships between the levels.
Accumulated importance of the relationships between level 2 and 3 = 83.8%
Accumulated importance of the relationships between level 3 and 4 = 91.0%
AAI = average (over the levels) of the accumulated
Profits
Product Excellence (0,61)
Delivery (0.30)
Service Quality (0.09)
Competencies
Product Development (0.21) Process Cost
(0.11) Process Productivity
(0.37) Product Quality
(0.39)
Human Relations Finances Perspective
Clients Perspective
Internal Processes Perspective
[image:4.595.76.522.85.338.2]Growth & Learning Perspective
Figure 6. Strategy map of company E2.
two levels divided by the number of relationships be-tween levels 2 and 3 = 83.8/7 = 14.0%
Accumulated importance of the relationships between two levels divided by the number of relationships be-tween levels 3 and 4 = 83.8/7 = 15.2%
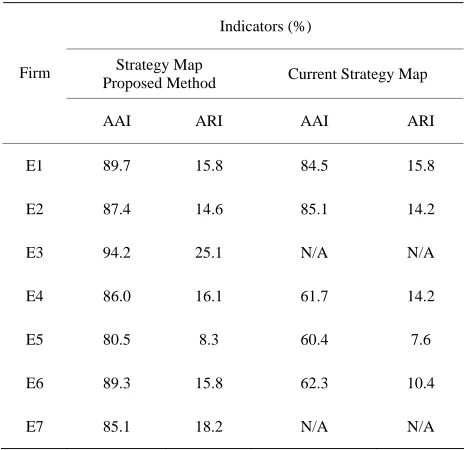
For the seven companies, these indicators were calcu-lated for the strategy map obtained with the proposed method as well as for the strategy map defined by the company (when available).
The Average Accumulated Indicator (AAI) expresses the percentage of the relationships that are considered “relevant”. It is over 80%, because normally it necessary either to add more relationships to connect the bottom level with the top level or the accumulated value of the relationships is not 80% exactly. The Average of the Ac-cumulated Relationships per Number of Relationships (ARI) is a measure of how relevant is every relationship of the strategy map.
It should be noted that in the case of the propose method, AAI is equal or higher than one of the actual strategy map. It means that the proposed method choose more “relevant” relationships. The value of ARI indicates that, in the case of the proposed method, the importance of the selected relationships is higher, but without in-creasing the number of relationships.
The figures show that what a method is doing is ob-taining a balance between the importance of the relation-ships and the number of them. In other words, the method tries to reduce the number of relationships of the strategy map and at the same time it tries to increase their impor-tance.
Table 2. Indicators of company E2.
Indicators of Strategy Map Level
AI (%) Selected Relationships RI (%)
2-3 83.8 6 14.0
3-4 91.0 6 15.2
Average 87.4 14.6
Table 3. Indicators of the 7 companies.
Indicators (%)
Strategy Map
Proposed Method Current Strategy Map Firm
AAI ARI AAI ARI
E1 89.7 15.8 84.5 15.8
E2 87.4 14.6 85.1 14.2
E3 94.2 25.1 N/A N/A
E4 86.0 16.1 61.7 14.2
E5 80.5 8.3 60.4 7.6
E6 89.3 15.8 62.3 10.4
[image:4.595.306.538.510.735.2]4. Conclusions
This paper has presented a quantitative method to obtain the causal relationships of a strategy map. It was found that the method obtains relationships that are more im-portant than those which are included in the current strategy maps of the companies under study. Those rela-tionships had been obtained in a traditional way.
This is a good indication that the method may be a better way for obtaining causal relationships in a strategy map than using just intuition.
The method considers that a strategy map can be mod-eled as a hierarchy, which is not always possible. For this reason, it is proposed to evaluate in future research the use of the Analytic Network Process (ANP).
5. Acknowledgements
This work was supported by the University of Santiago of Chile (Project DICYT-USACH Nº 061117QL).
REFERENCES
[1] A. Neely, “The Evolution of Performance Measurement Research: Developments in the Last Decade and a Re-search Agenda for the Next,” International Journal on of Operations & Production Management, Vol. 25, No. 12, 2005, pp. 1264-1277.doi:10.1108/01443570510633648 [2] C. F. Gomes, M. M. Yasin and J. V. Lisboa, “Literature
Review of Manufacturing Performance Measures and Measurement in an Organizational Context: A Framework and Direction for Future Research,” Journal of Technol-ogy Management, Vol. 15, No. 6, 2004, pp. 511-530. doi:10.1108/17410380410547906
[3] R. S. Kaplan and D. P. Norton, “The Balanced Scorecard - measures that Drive Performance,” Harvard Business Review, Jan.-Feb 1992, pp. 71-79.
[4] R. S. Kaplan and D. P. Norton, “The Balanced Score-card,” Harvard Business School Press, Boston, MA, USA, 1996.
[5] R. Kaplan and D. Norton, “Linking the Balanced Score-card to strategy,” California Management Review, Vol. 39, No. 1, 1996.doi:10.2307/41165876
[6] R. Y. Kaplan and D. Norton, “Transforming the Balanced Scorecard from performance measurement to strategic management: Part I. American Accounting Association,” Vol. 15. No. 1, 2001.
[7] R. Y. Kaplan and D. Norton, “Transforming the Balanced Scorecard from Performance Measurement to Strategic Management: Part II,” American Accounting Association, Vol. 15. No. 2, 2001.
[8] M. Kunc, “Using Systems Thinking to Enhance Strategy Maps,” Management Decision, Vol. 46, No. 5, pp. 2008, pp. 761-778.doi:10.1108/00251740810873752
[9] R. Kaplan and D. Norton, Strategy Maps, Harvard Busi-ness School Press, 2004.
[10] L. Quezada, F. Cordova, P. Palominos, K. Godoy and J.
Ross, “Method for Identifying Strategic Objectives in Strategy Maps,” International Journal of Production Eco-nomics, 2009, pp. 122-500.
[11] T. L. Saaty, “Fundamentals of Decision Making and Pri-ority Theory with the Analytical Hierarchy Process,” RWS Publications, Pittsburgh, PA, 1994.
[12] R. Saaty, “Decision Making in Complex Environment,” RWS Publications, Pittsburgh, PA, 2002.
[13] E. Cheng and H. Li, “Analytic Hierarchy Process, An Approach to Determine Measures for Business Perform-ance,” Measuring Business Excellence, Vol. 5, No 3, 2001, pp. 30-36.doi:10.1108/EUM0000000005864
[14] U. Bititci, Suwignjo and A. S. Carrie, “Strategy Manage-ment through Quantitative Modelling of Performance Measurement Systems,” International Journal of Produc-tion Economics, Vol. 69, 2001, pp. 15-22.
doi:10.1016/S0925-5273(99)00113-9
[15] H. Lee, W. Kwak and I. Han, “Developing a Business Performance Evaluation System: An Analytic Hierarchi-cal Model,” The Engineering Economist, Vol. 15, 2005, pp. 108-127.
[16] J. Sarkis, “Quantitative Models for Performance Meas-urement Systems-alternate Considerations,” International. Journal of Production Economics, Vol. 86, 2003, pp. 81-90.doi:10.1016/S0925-5273(03)00055-0
[17] G. T. Temur, E. Emeksizoghlu and S. Gozlu, “A Study of Performance Measuremet of a Plastic Packaging Organi-zation´s System by AHP Modelling,” PICMET 2007 P ro-ceedings, 5-7 August, Portland, Oregon, USA, 2007. [18] M. Yurdakul, “Measuring Long Term Performance of a
Manufacturing Firm Using the Analytic Network Process (ANP) Approach,” International Journal of Production Research, Vol. 41, No. 11, 2003, pp. 2501-2529.
[19] M. Yurdakul and Y. T. Ic, “Development of a Perform-ance Measurement Model for Manufacturing Companies Using the AHP and TOPSIS Approaches,” International Journal of Production Research, Vol. 23, No. 21, 2005, pp. 4609-4641
[20] T. L. Saaty, “Decision Making with Dependence and Feedback: The Analytic Network Process,” 2nd Edition. RWS Publications, Pittsburgh, PA, 2001.
[21] H. Huang, M. Lai and L. Lin, “Developing Strategic Measurement and Improvement for the Biopharmaceuti-cal Firm: Using the BSC Hierarchy,” Expert Systems and Applications, Vol. 38, No. 5, 2011, pp. 4875-4881. [22] M. Tseng, “Implementation and Performance Evaluation
Using the Fuzzy Network Balanced Scorecard,” Com-puters & Education, Vol. 55, 2010, pp. 188-201.
[23] I. Yuksel and M. Dagdeviren, “Using the Fuzzy Analytic Network Process (ANP) for Balanced Scorecard (BSC): A Case Study for a Manufacturing Firm,” Expert System with Applications, Vol. 37, 2010, pp. 1270-1278.
[24] L. Quezada and D. Quintero, “Quantitative Model for the Design of a Strategy Map,” Proceedings of the 21th In-ternational Conference on Production Research, Stuttgart, Germany, 31 July- 4 August, 2011.