CdHgTe Quantum Dots Sensitized Solar Cell with Using of
Titanium Dioxide Nanotubes
M. Y. Feteha, M. Ameen
Department of Materials Science, Institute of Graduate Studies and Research, Alexandria University, Alexandria, Egypt. Email: [email protected]
Received September 2013
ABSTRACT
The sensitization of TiO2 nanotubes with CdHgTe quantum dots (QDs) was applied by using the direct dispersion tech-nique. The CdHgTe-QDs were fabricated with different Hg% ratio in organic medium for controlling their particle size. While TiO2 nanotubes (NTs) were fabricated by anodization technique. The QDs and NTs were characterized using SEM, TEM and UV-VIS spectrophotometer. In this work, the photovoltaic parameters of the quantum dots sensitized solar cell (QDSSC) depend mainly on the Hg% ratio in the QDs. The most efficient QDSSC was obtained at 25% of Hg ratio with Jsc of 4 mA/cm2, Voc of 0.63 V, FF of 0.32 and efficiency of 0.81%.
Keywords: Solar Cells; Quantum Dots; Nano-Tubes; TiO2; Sensitization
1. Introduction
Quantum dots photovoltaic cells combine low-cost solu-tion process-ability with quantum size-effect tunability to match absorption with the solar spectrum [1]. Relative to the dyes used in solar cells, QDs offer several advantages such as photo-stability, greater molar extinction coeffi-cients, and size-dependent optical properties [2]. They also have the potential to increase the maximum attainable thermodynamic conversion efficiency of solar photon con-version up to 66% by utilizing hot photo-generated carri-ers to produce higher photo-voltages or higher photocur-rents via multi-exciton generation capability. While the charge carriers are confined within an infinitesimal vo-lume, thereby increasing their interactions and enhancing the probability for multiple exciton generation [3,4]. The calculations of the dependence of ideal solar cell conver-sion efficiency on band gap show that CdTe is an excel-lent match to our sun [5,6].
In order to control the CdTe QDs band gap, mercury was added to the preparation medium [2]. The key chal-lenge with such cells, the quantum dot sensitized solar cells (QDSSCs), is the relatively low absorption cross section of the QDs [6]. Titania nanotubes (TNTs) present the key solution for carrier’s recombination and low ab-sorption issues via the highly ordered nano-structured matrix which provides continuous electron pathways to facilitate a good electrons collection with high surface area [7].
TiO2 nanotubes arrays and particulate films were mod-ified with CdS quantum dots with an aim to tune the
re-sponse of the photo-electrochemical cell in the visible region via successive ionic layer adsorption and reaction (SILAR) [8].
The QDSSCs were fabricated by incorporating CdHgTe nanocrystals (NCs) and CdTe quantum dots, which pre-pared separately from aqueous mixtures of NaHTe, Cd(NO3)2, and 3-mercaptopropionic acid in the presence and absence of HgCl2 respectively, then the sensitization of a modified TiO2 nanoparticles was carried out to ob-tain an energy conversion efficiencies of 1.0% and 2.2% [2].
In this work, the sensitization of TiO2 nanotubes-pre- pared with anodization method—with CdHgTe-QDs-pre- pared with organic method—was applied by direct dis-persion. The aim of the present work is to enhance the QDSSCs efficiency by tuning the energy gab of the CdHgTe-QDs with changing Hg% ratio. The effect of Hg ratio in the QDs on the photovoltaic parameters of the QDSSC was investigated.
2. Experimental Work
2.1. Materials
zation process was carried out in an electrochemical cell with two electrodes model where the titanium is the anode and platinum wire is the counter electrode (the cathode). The anodization electrolyte was a mixture of Ethylene Glycol, Ammonium fluoride (0.5%wt), Acetic acid (for pH adjustment) and DI water (2% volume). All experiments were carried out at room temperature (25˚C) and the anodizing voltage was 40 V and applied for 3 hours. Once the process completed, the anodized sample removed from the cell and washed with a large amount of water then dried with nitrogen. The Ti electrode was annealed in air at 500˚C for 3 hours in order to improve Anatase phase. The morphology (i.e. length, diameter, and the shape) of the TiO2 nanotubes was investigated by the scanning electron microscope (SEM: Joel Jsm 6360 LA, Japan).
2.3. Preparation of CdTe and CdHgTe QDs
Tellurium powder (0.127 gm) was added to triocytl-phosphine (TOP, 2 ml) and Octadecene (8 ml) with stir-ring at 60˚C for 30 min. till giving the greenish gray col-or with a complete dissolving. In a three neck rounded flask, Cadmium acetate (0.186 gm) was mixed with Oleic acid (2 ml) and Octadecene (5 ml) and then rising the temperature up to 80˚C. The tellurium precursor was added to the above cadmium solution at 80˚C. To synthe-sis CdHgTe QDs from organic medium, mercury chloride was added to above cadmium solution. The CdTe and CdHgTe QDs were separated in Isopropanol via centri-fuge at 5000 rpm. These QDs were dissolved again in n-hexane to prepare the sensitization solution. UV-visible characterization of the CdHgTe QDs solution was carried out using Thermo-Evolution 600 spectrophotometer and the HRTEM images of the QDs were obtained using JEOL (JEM-2100 LaB6) TEM.
2.4. Preparation of Quantum Dot Sensitized Solar Cell (QDSSC)
The prepared nanotubes electrodes were immersed into the QDs/N-Hexane suspension. Then left for 3 days with sonication every 12 hours in airtight tubes to ensure a good QDs diffusion through the TNTs layer.
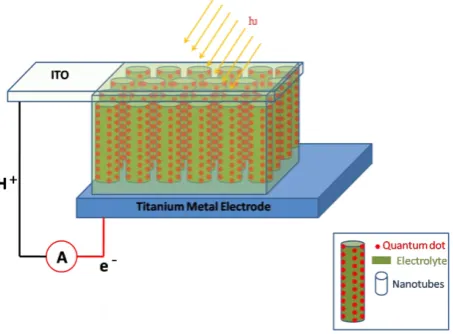
[image:2.595.312.539.87.254.2]The QD sensitized solar cells with a structure of ITO/ liquid electrolyte/CdHgTe-QDs/TiO2 (NTs)/Ti were as-sembled as shown in Figure 1. The sensitized Ti-TNTs
Figure 1. QDSSC assembly.
is the working electrode and a carbon activated indium tin oxide (ITO, R = 14 - 16 Ω) is the other electrode. The two electrodes were spaced by a polymeric spacer with 50 µm thickness. The Redox electrolyte was injected through the cell’s sides.
All cells were illuminated by using Xenon lamp with an intensity of 100 m W/cm2 (AM1.5). The lamp was calibrated with Solarex standard solar cell and the J-V measurements were obtained by using Keithley 2635A source-meter.
3. Results and Discussion
3.1. Characterization of TiO2-NTs
Images of scanning electron microscope (SEM) for the anodized titanium show a highly ordered, smooth, and dense packed Titania nanotubes formed at 40 V for 3 h in Ethylene glycol/ammonium fluoride electrolyte. The ob-tained nanotubes having an average outer diameter of 75 nm and a wall thickness in the range of 10 - 14 nm while the tubular layer thickness was around 24 µm (as shown in Figure 2) which provides a naturally n-type semicon-ductor with a relatively high surface area with a 3.2 eV band gap (after annealing) referred to the anatase crystal structure [9].
The arrangement of the highly ordered Titania nano-tubes array perpendicular to the surface permits a facile charge transfer along the length of the nanotubes to the conductive substrate [10]. The prepared nanotubes may resolve the problem of relatively low absorption cross section of the QDs by increasing the area of contacts in addition with the appropriate layer thickness which ex-pected to increase the solar cell performance.
3.2. Characterization of CdHgTe QDs
3.2.1. UV-Vis. Spectroscopy
(a) (b)
(c) (d)
Figure 2. SEM images for a sample anodized at 40 V for 3 h in Ethylene Glycol: (a) and (b)Top views;(c) Side view; and (d) Side view at higher magnification.
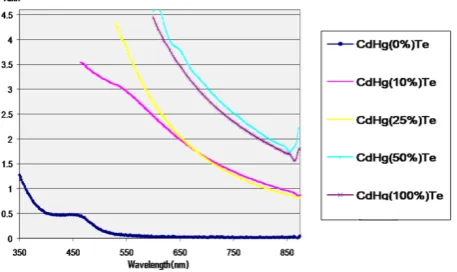
Figure 3. UV-visible absorption spectra of CdHgTe QDs prepared with different ratios of mercury. The obtained curves are similar to those reported in the previous work [12].
QDs prepared using organic medium at different ratios of Hg. For CdTe sample, the absorption peak is around 460 nm indicating the formation of CdTe QDs [11]. It was noted that as the relative concentration of mercury
in-creases, the excitonic absorption peak of CdTe QDs shifts to the longer wavelengths from 460 nm (for 0% of Hg ) to 855 nm(for 100% Hg) due to the quantum confine-ment effect as the QDs grow to larger size and this is a good evidence for the formation of CdHgTe QDs [12].
The Hg2+ ions substitute Cd2+ ions at the surface of the nanocrystals forming a CdHgTe alloy in the near-surface region, possibly with a concentration gradient decreasing towards the dot interior [11].
Using the absorption spectrum, the direct optical band gap energy of the QDs was calculated by simply plotting (αhν)2versus ( hν), obtained from the following relation [11]:
[image:3.595.60.289.495.631.2]the increase in Hg% ratio from 0 to 10, 25, 50 and 100 leads to an increase in the size of QDs from 2.8 to 8.6, 9, 9.5 and 10.8 nm respectively. This is due to the forma-tion of a HgTe layer on the surface [12].
3.3. Characterization of TiO2-NTs
(TNTs)/CdHgTe Quantum Dots Solar Cells (QDSSCs)
The SEM images (Figure 5) showed fully covered TNTs
current and the open circuit voltage as indicated in Table 1. As seen from the Figure 6 that Jsc increased from 0.4 mA/cm2 corresponding to 0% Hg to 3.1 and 4 m A/cm2 for 10% Hg and 25% Hg respectively. The most efficient cell (regarded to 0.81% efficiency) with the highest cur-rent density value (4 m A/cm2) was obtained when using 25% Hg corresponding to a band gap of 1.5 eV. While a noticeable decrease in the values of Voc and Jsc were oc-curred when changing the energy band gap away from
[image:4.595.171.427.318.710.2]Figure 5. SEM images of Titania nanotubes after sensitization: a) Top view for a sample sensitized with CdHgTe QDs, b) Top view of a sample sensitized with CdTe QDs.
[image:5.595.55.540.442.543.2]Figure 6. J-V characteristic curves of TiO2-NTs/CdHgTe-QDs sensitized solar cell with different Hg % ratios.
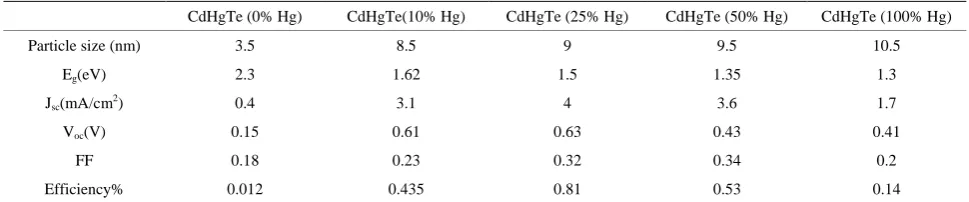
Table 1. Photovoltaic parameters of the prepared QDSSCs.
CdHgTe (0% Hg) CdHgTe(10% Hg) CdHgTe (25% Hg) CdHgTe (50% Hg) CdHgTe (100% Hg)
Particle size (nm) 3.5 8.5 9 9.5 10.5
Eg(eV) 2.3 1.62 1.5 1.35 1.3
Jsc(mA/cm2) 0.4 3.1 4 3.6 1.7
Voc(V) 0.15 0.61 0.63 0.43 0.41
FF 0.18 0.23 0.32 0.34 0.2
Efficiency% 0.012 0.435 0.81 0.53 0.14
this value (i.e. 1.5 eV). This result up to 1.5 eV is due to the excited state of the QD lies well above the TiO2 con-duction band level and photo-excited electrons injection into TiO2 would be energetically favorable[1]. While, by increasing the band gap (>1.5 eV), the hole level exhibits a large discontinuity with the TiO2 valence band, pro-viding a very large barrier to the undesired passage of majority holes from the p-type QD layer into the n-type TiO2 electrode [1].
Additionally, Voc and Jsc values were dramatically drop-ping by increasing the Hg% ratio from 25% to 100%. This behavior can be explained by another cause which is regarded to the distorted QDs structure with an access of mercury concentrations. When the Hg% ratio increased, Hg2+ ions should be substituted at the surface of the
na-nocrystals, and in theory, if complete surface exchange occurs, a core/single-monolayer-shell structure will result [12]. The substitution reaction then completes either due to an exhaustion of Hg ions in solution or because of the formation of a complete “locking” layer of HgTe on the surface. And finally the outer layer forms an almost per-fectly passivated quantum dot [12].
1.35 and 1.3 eV for 0%, 10%, 25%, 50%, and 100% ratio of Hg respectively.
The increase in Voc and Jsc values corresponding to a change in Hg% ratio from 0% to 25% was due to the absorption enhancement in IR region while the decrease in Voc and Jsc values corresponding to a change in Hg ratio from 25% to 100% was due to either the discontinu-ity in the energy level or the formation of locking layer of HgTe on the QDs surface. The most efficient QDSSC was obtained at 25% of Hg ratio with Jsc of 4 mA/cm2, Voc of 0.63 V, FF of 0.32 and efficiency of 0.81%.
The performance of the QDSSC mentioned in this work can be enhanced using a better sensitization tech-nique, better sealing conditions and by the usage of a linker.
5. Acknowledgements
The authors are very grateful to the research team of the US-Egypt project chaired by Prof. Moataz Soliman for the funding support and the research student: Wessam Kamal for her help in preparing the materials.
REFERENCES
[1] A. G. Pattantyus-Abraham, I. J. Kramer, A. R. Barkhouse, X. Wang, G. Konstantatos, R. Debnath, L. Levina, I. Raabe, M. K. Nazeeruddin, M. Grätzel and E. H. Sargent, “Depleted-Heterojunction Colloidal Quantum Dot Solar Cells,” ACS Nano, Vol. 4, No. 6, 2010, pp. 3374-3380.
[2] Z. Yang and H. Chang, “CdHgTe and CdTe Quantum Dot Solar Cells Displaying an Energy Conversion Effi- ciency Exceeding 2%,” Solar Energy Materials and Solar Cells, Vol. 94, No. 12, 2010, pp. 2046-2051.
gineering, John Wiley & Sons Ltd., 2003, pp. 617-662. [6] L. Tsakalakos, “Nanostructures for Photovoltaics,” Mate-
rials Science and Engineering: R: Reports, Vol. 62, No. 6, 2008, pp. 175-189.
[7] C. Grimes, “Titanium Dioxide Nanotube Arrays Improved Solar Cells,” SPIE Newsroom, 2008.
[8] D. R. Baker and P. V. Kamat, “Photosensitization of TiO2 Nanostructures with CdS Quantum Dots: Particulate ver- sus Tubular Support Architectures,” Advanced Functional Materials, Vol. 19, No. 5, 2009, pp. 805-811.
[9] D. Regonini, “Anodised TiO2 Nanotubes : Synthesis, Growth Mechanism and Thermal Stability,” Ph.D. Thesis, University of Bath, UK, 2008.
[10] G. K. Mor, O. K. Varghese, M. Paulose, K. Shankar and C. A. Grimes, “A Review on Highly Ordered, Vertically Oriented TiO2 Nanotube Arrays: Fabrication, Material Properties, and Solar Energy Applications,” Solar Energy Materials and Solar Cells, Vol. 90, No. 14, 2006, pp.
2011-2075.
[11] M. Feteha, S. Ebrahim, M. Soliman, W. Ramdan and M. Raoof, “Effects of Mercaptopropionic Acid as a Stabiliz- ing Agent and Cd:Te Ion Ratio on CdTe and CdHgTe Quantum Dots Properties,” Journal of Materials Science:
Materials in Electronics, Vol. 23, 2012, pp.1938-1943.
[12] M. T. Harrison, S. V. Kershaw, M. G. Burt and A. Eychmu, “Wet Chemical Synthesis and Spectroscopic Study of CdHgTe Nanocrystals with Strong Near-Infrared Luminescence,” Materials Science and Engineering, Vol. 70, 2000, pp. 355-360.