Munich Personal RePEc Archive
Assessing the impact of the
EU-sponsored trade liberalization in the
MENA countries
Cieslik, Andrzej and Hagemejer, Jan
University of Warsaw, National Bank of Poland
June 2009
Online at
https://mpra.ub.uni-muenchen.de/37131/
Assessing the impact of the EU-sponsored trade liberalization
in the MENA countries
Andrzej Cieślik *, Jan Hagemejer **‡
Abstract
The EU-sponsored Barcelona conference in 1995 set the ambitious goal of creating the Euro-Mediterranean Free Trade Area (EUROMED) that would include the European Union and the MENA countries by 2010. The intermediate steps towards building the EUROMED have involved bilateral “vertical” trade liberalization between the EU and the particular MENA countries as well as “horizontal” trade liberalization among themselves. In this paper we evaluate empirically the effects of the new EU Association Agreements with the MENA countries using the augmented gravity equations derived from a variety of neoclassical and new trade theory models and panel data for the period 1980-2004. We find that while these agreements increased significantly imports of the MENA countries from the EU they had no positive impact on their exports to the EU which can be attributed to the asymmetry in trade liberalization between the EU and the MENA countries.
JEL classification codes: F11, F12
Keywords: bilateral trade, gravity equation, preferential trade liberalization
1. Introduction
The inability to achieve far reaching trade liberalization under the auspices of the General
Agreement on Tariffs and Trade (GATT) and later the World Trade Organization (WTO) has
led to the proliferation of regional trade agreements in the world trading system. According to
the WTO convention the term regional trade agreement (RTA) encompasses both reciprocal
free trade or customs areas as well as plurilateral (multicountry) agreements. During the
1990s the European Union (EU) was a major player in the RTA game and an active sponsor
of bilateral association agreements with its closest neighbours located in the Central and
Eastern Europe (CEE) as well as in the Middle East and the North Africa (MENA).
The EU-sponsored Barcelona conference in 1995 set the ambitious goal of
establishing the Euro-Mediterranean Free Trade Area (EUROMED) that would include the
enlarged European Union and the MENA countries by 2010. The creation of the EUROMED
is to be achieved by means of the new generation of the Euro-Mediterranean Association
Agreements between the EU and the MENA countries accompanied by free trade agreements
between the MENA countries themselves. In contrast to earlier, mostly non-reciprocal, trade
liberalization the new Association Agreements provide for the implementation of bilateral
free trade between the EU and the MENA countries.
In this paper we study the trade effects of the new EU Association Agreements for
bilateral imports and exports of the MENA countries using the augmented gravity equation of
international trade derived from a variety of neoclassical and new trade models. While there
exists extensive literature that deals with evaluating empirically the effects of trade
liberalization between the new and the old EU member states relatively little attention has
been devoted to studying the effects of trade liberalization between the EU and the MENA
Two main strands in the empirical trade literature employing gravity models in the
context of the MENA countries can be distinguished.1 The first, and the most numerous,
strand concentrates on estimating the trade potential of the MENA countries and predicting
the volume of trade flows resulting from trade liberalization. Examples that belong to this
strand include: Arnon et al. (1996), Ekholm et al. (1996), and more recently Nugent and
Yousef (2005), Broto et al. (2006) and Tovias et al. (2007). Most of these studies find that the
actual trade of MENA countries is below the predicted values and there exists unexploited
trade potential.
Our study is related to the second, more recent strand that studies the ex-post
consequences of trade liberalization in the MENA countries. This strand compared to the first
one is still less numerous and the provided empirical evidence seems to be study-specific and
dependent on the time period chosen. For example, Al-Atrash and Yousef (2000) estimated
the gravity equation using a pooled dataset for 18 Arab countries and their 43 partners during
the period 1995-1997 to find that the estimated parameters on the dummy variable for the EU
preferential arrangements were statistically significant but displayed counter-intuitive
negative signs both in the case of exports and imports.2
More recently, Peridy (2005) estimated the gravity equation for 7 MENA countries
and their 42 partner countries using a panel dataset for the period 1975-2001. He found that
the EU trade preferences granted to the MENA countries increased their exports by about
20-27% depending on the model specification which evidences a significant gross trade creation.
However, at the same time he noted that the positive trade preference impact has been steadily
1
In addition to the gravity model based approach other approaches based on the CGE modeling have been extensively used to evaluate welfare effects of trade liberalization in the MENA countries. Examples of studies based on this approach include Maskus and Konan (1997), Augier and Gasiorek (2003), and Dennis (2006).
2
dropping over time. For example, the gross trade creation only from 1980 to 1995 decreased
from 27.4 to 11.8%.3
According to Peridy (2005, p.137) “… the conclusion of the EUROMED agreements
should stop preference erosion in the future, unless the market access of Mediterranean
agricultural imports remains restricted for a significant period of time”. However, no attempts
have been made so far to evaluate empirically the effects of the new EU Association
Agreements concluded with the MENA countries. Therefore, our study attempts to fill in a
part of the existing gap in this important field of study by assessing empirically whether the
new EU Association Agreements actually provided a new stimulus to the development of
trade relations between the EU and the MENA countries.
Although the goal of our study may look similar to those of other studies focusing on
evaluation ex-post effects of trade liberalization that can be found in the literature, three major
differences with respect to the previous work can be identified. First, we use the generalized
gravity equation that can be derived from a variety of neoclassical and new trade theory
models and employ an empirical procedure that allows us to identify the appropriate model
that explains the trade pattern of the MENA countries. Second, in our study while focusing on
the effects of the new EU Association Agreements we control also for the effects of other
both plurilateral and bilateral free trade agreements concluded by the MENA countries among
themselves as well as with countries located outside the region. Third, we study the impact of
the association agreements for both exports and imports separately for particular MENA
countries as well as for the whole group.
We find that while the new EU Association Agreements increased significantly
imports of the MENA countries from the EU, they did not contribute to the expansion of their
exports to the EU markets. These findings can be explained by the asymmetry in trade
3
liberalization between the EU and the MENA countries. On the one hand, liberalization of the
EU imports from the MENA countries was a gradual process that extended over the last thirty
years and there was not much to liberalize in the 1990s except for trade in agricultural goods
which still remains very restricted. On the other hand, the MENA countries remained
relatively closed to the EU exports, their initial level of protection was much higher than in
the EU and liberalization of the MENA imports from the EU took place much faster and its
scope was much bigger. Moreover, we find that the estimated impact of the new Association
Agreements on bilateral trade of particular MENA countries differs greatly across the region.
The structure of this paper is as follows. In section 2 we provide a brief description of
the history of trade liberalization in the MENA countries and the role of the EU in this
process. In section 3 we present the analytical framework used for evaluating empirically the
effects of preferential trade liberalization in the MENA countries. In section 4 variables
definitions and data sources are described. In section 5 estimation results for the whole
MENA group as well as for particular countries of the MENA region are presented and
discussed. Final remarks and policy guidelines are presented in the concluding section.
2. The Euro-Mediterranean Integration Process
The integration of the MENA countries with the European Union has a long history that
includes two generations of agreements ranging from unilateral preferences and
non-reciprocal treatment to cooperation and association agreements. The main features of these
agreements were the EU concessions in trade with the MENA countries. The first generation
Euro-Mediterranean Association Agreements with the selected MENA countries that
provided free access for their manufactures exports to the EU markets were concluded already
in the 1960s.4
4
However, given the special historic, economic and political interest in the
Mediterranean region, the European Commission launched in 1972 the Global Mediterranean
Policy (GMP) that was aimed at providing non-discriminatory trade concessions to all MENA
countries (Tovias, 1977). The main goal of this policy was to conclude a series of preferential
trading agreements in industrial products between the EU and each MENA country and to
offer concessions in agricultural imports to the EU that did not interfere with the European
Common Agricultural Policy (CAP). 5
Countries included in the GMP were the Maghreb countries (Morocco, Algeria and
Tunisia), Mashreq countries (Egypt, Jordan, Lebanon and Syria), Israel, Libya, Turkey,
Cyprus, Malta and the former Yugoslavia (Jovanović, 2005).6 The GMP resulted in a series of
the so-called Cooperation Agreements that were concluded with all the MENA countries
between 1973 and 1980. The Cooperation Agreements extended earlier preferences for
MENA exports of agricultural products both in terms of coverage and the margins of
preference, however, at the same time these exports were subject to protectionist measures
imposed by the CAP.
Further liberalization of the EU imports from the MENA countries took place after the
Southern enlargement in 1986 to include Spain and Portugal whose exports obtained
unrestricted access to the EU markets. Following this enlargement the EU concluded a new
series of agreements with the MENA countries called the Adaptation Agreements that were
aimed at reducing increased tariff discrimination between those Mediterranean countries that
joined the EU and those that stayed outside. As a result of this renovated policy by the end of
1993 all tariffs on exports from the MENA countries were eliminated, however, non-tariff
barriers (NTBs) to trade related to the CAP were still in force.
5
Euro-Mediterranean trade liberalization within the framework of the GPM was unilateral except for Israel where reciprocity was required. Most MENA markets remained protected by high tariffs until the middle of the 1990s.
6
The new round of trade liberalization between the EU and the MENA countries was
initiated at the Euro-Mediterranean Conference of Ministers of Foreign Affairs held in
Barcelona on 27-28 November 1995. In the Barcelona Declaration the EU and the MENA
countries established the main objectives of the Barcelona Process, including the creation of
the Euro-Mediterranean Free Trade Area by 2010. The Barcelona Process represents a turning
point in the trade relations between the EU and the MENA countries as it means replacing the
previous system of non-reciprocal preferences for most MENA countries by bilateral free
trade agreements.7
The Barcelona Process has two complementary dimensions: bilateral and regional.
The EU carries out a number of activities bilaterally with each country. The most important
ones are the Euro-Mediterranean Association Agreements that the European Commission
negotiates individually with particular MENA countries. These new generation agreements
that replaced the previous Association and Cooperation Agreements signed in the 1960s and
1970s foresee bilateral trade in manufactured goods and progressive liberalization of trade in
agricultural products.8 The provisions of the Euro-Mediterranean Association Agreements
governing the bilateral relations contain the general principles common to all MENA
countries as well as specific characteristics that vary across countries.
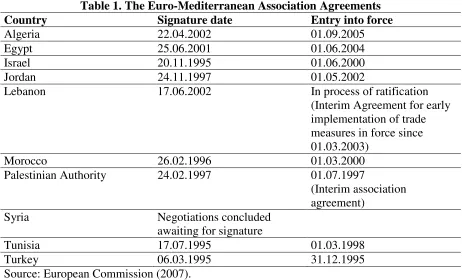
INSERT TABLE 1 HERE
With the conclusion of negotiations with Syria in 2004 the network of bilateral
Association Agreements with the MENA countries has been completed (see Table 1). After
the signature the agreements entered a lengthy ratification process by the national parliaments
7
Included with the EU member states in this potential agreements were the following Mediterranean countries: Algeria, Cyprus (the EU member since 2004), Egypt, Israel, Jordan, Lebanon, Malta (the EU member since 2004), Morocco, the Palestinian Authority, Syria, Tunisia and Turkey while Libya has the observer status since 1999. Together with the EFTA that forms together with the EU the European Economic Area, this zone is foreseen to become world’s largest market place that will eventually include about 40 countries and 800 million consumers.
8
of the EU member states and the MENA countries. The Association Agreements came
progressively into force in Tunisia (1998), Israel (2000), Morocco (2000), Jordan (2002),
Egypt (2004) and Algeria (2005).9
The Interim Agreements for early implementation of trade related matters are in force
in the Palestinian Authority (1997) and Lebanon (2003). Moreover, special agreements
establishing a customs union with the EU were signed with the European Mediterranean EU
candidate countries: Cyprus, Malta and Turkey that entered into force before their accession
into the EU. The EU enlargement on May 1, 2004 brought Cyprus and Malta into the EU,
whereas the customs union agreement with Turkey (1996) is still in force.
In addition to “vertical” bilateral trade liberalization with the EU the MENA countries
are committed to implement “horizontal” trade liberalization among themselves. However,
compared to the Euro-Mediterranean Association Agreements radical trade liberalization
between the MENA countries is still lagging behind. Some doubts about the desirability of
intra-MENA trade liberalization stem from the long history of failure in creating a well
functioning plurilateral free trade agreement.
Commonly mentioned examples of such failure stories include the Arab Common
Market and other initiatives of the Arab League and the Council of Economic Unity, as well
as various sub-regional arrangements such as among Maghreb countries, and many other
trade agreements formed among countries of the MENA region. According to Nugent and
Yousef (2005, p.1) “Not only have these special arrangements been far from fully realized,
but also even normal trade among countries of the region has been periodically and
unexpectedly interrupted by trade boycotts, ad hoc border closings and so on.”
Given the lack of significant progress in liberalizing trade at the regional and
sub-regional levels in the MENA region some countries located both in the Middle East and North
9
Africa decided to liberalize their trade on a bilateral basis. This led to the establishment of the
network of bilateral trade agreements by the end of the 1990s that prepared the ground for the
Agadir Declaration signed in 2001 by the representatives of four MENA countries: Egypt,
Jordan, Morocco and Tunisia. The Agadir Declaration included a commitment to the
establishment of a free trade area (FTA) between these countries that remained open onto
other Arab countries.10
In 2003 the four member countries of the Agadir group finalized the agreement on the
establishment of a free trade area among themselves that would replace the existing bilateral
trade agreements of the 1990s. The Agadir Agreement was signed in 2004 and was initially
foreseen to take effect in 2005. However, due to the slow ratification process by some
countries it has not entered into force until 2007.11
The Agadir Agreement is often perceived as a stepping stone to the formation of a
well functioning regional trade agreement that would complement on-going “vertical” trade
liberalization with the EU and eventually lead to the creation of the EUROMED. However, at
this stage it is too early to evaluate its effectiveness. Nevertheless, it is possible to evaluate
empirically at least the effectiveness of earlier bilateral trade agreements concluded among
the MENA countries that laid the foundations for the Agadir Agreement. Therefore, in
addition to studying the effects of the new EU Association Agreements we also study the
effects of bilateral trade agreements of the Agadir countries concluded in the late 1990s.
3. The Analytical Framework
10
Lebanon and Syria are currently in the process of negotiations to join the Agadir Organization. Other potential entrants include Algeria, Libya, Mauritania and the Palestinian Authority.
11
To assess the effects of various preferential trading agreements concluded by the MENA
countries we use a gravity equation of bilateral trade flows in its extended form that can be
derived from a variety of neoclassical and new trade theory models. The gravity equation has
been widely used in empirical studies of economic integration processes to investigate the
changes in the geographic trade pattern and the effects of RTAs or currency unions on trade
flows. However, most previous empirical studies employ the gravity equation in its simplified
form that assumes complete specialization in production either at the country or the firm level
and foresees no role for factor proportions. These simplistic equations predict that trade
between two countries depends only on their economic size and trade costs between them.
In our view, while such equations may be appropriate for explaining trade flows
between developed countries where most trade takes place in differentiated manufactured
products, they cannot be regarded as fully satisfactory in explaining trade flows of the MENA
countries which are on averaged still at the relatively low level of economic development and
trade in homogenous goods constitutes an important part of their aggregate trade flows.
Therefore, the estimates of the effects of RTAs obtained on the basis of such equations may
be seriously biased due to the lack of controls for factor proportions that play a key role in the
determination of trade flows in the incomplete specialization models especially when they are
estimated for the middle- or low-income countries (Cieślik, 2007).
Moreover, in contrast to previous studies our empirical approach allows discriminating
among alternative theories of international trade developed to explain the empirical success of
the gravity equation.12 Our generalized estimating equation that encompasses specific
estimating equations derived from a variety of theoretical models can be expressed in the
logarithmic form as follows:
12
lnTijt =
∑
=n
k k
1
β RTAijt + α1lnYit + α2lnYjt + α3lnKit/Lit + α4lnKjt/Ljt + α5lnDISTANCEij +
α6CONTIGUITYij + α7ARABICij + α8TURKISHij + α9COLONYij + α10COLONIZERij + ui +
uj + uij + vt + εijt. (1)
where: Tijt is the value of trade flows (exports and imports, respectively) between countries i
and j in year t; RTAijt is a dummy variable indicating whether countries i and j are both the
members of a bilateral or a plurilateral regional preferential trading agreement in year t;13 Yit
and Yjt are the levels of GDP in countries i and j in year t, respectively; Kit/Lit and Kjt/Ljt are
the capital per worker stocks in countries i and j in year t, respectively; DISTANCEij is the
distance between countries i and j; CONTIGUITYij is a dummy variable indicating whether
countries i and j share a common border; ARABICij and TURKISHij is are two dummy
variables indicating whether countries i and j share a common language; COLONYij is a
dummy variable indicating whether countries i and j were in a colonial relationship;
COLONIZERij is a dummy variable indicating whether countries i and j shared a common
colonizer; ui and uj are the individual fixed effects for countries i and j, respectively; uij is the
country-pair specific effect; vt is the time specific effect, and εijt is the error term that satisfies
the standard properties.
The preferential trading agreements once implemented are expected to increase
bilateral trade of both trading partners in the case of reciprocity, hence βi> 0 for all effective
agreements. All theoretical models predict that trade flows should increase with the economic
size of both trading partners, hence α1, α2 > 0. However, the impact of the factor proportion
variables cannot be a priori determined as it varies across various theoretical models and
could be either positive, negative or none depending of the extent of product differentiation.14
13
The year of entry into force of a preferential trade agreement is used as a starting year for an RTA dummy variable.
14
In particular, if both estimated parameters on the factor proportion variables display
opposite signs and are statistically significant then trade of the MENA countries is explained
by the standard Heckscher-Ohlin model with incomplete specialization in production. If only
one of estimated parameters on factor proportion variables shows a positive sign and is
statistically significant then their trade is explained by the Chamberlin-Heckscher-Ohlin
model which is a hybrid of the H-O and monopolistic competition models.
Finally, if none of the estimated parameters on the factor proportion variables is
statistically significant then their trade is explained by one of complete specialization models:
the H-O or C-H-O models with complete specialization in production at the country level or
the pure monopolistic competition model with complete specialization at the firm level.15
Therefore, the signs of the estimated parameters on the factor proportion variables α3 , α4 and
their statistical significance have to be determined empirically to identify the appropriate
theoretical model that explains trade of the MENA countries..
Moreover, we expect trade flows to be negatively related to distance that serves as a
proxy for transportation costs which should be low when countries are located close to each
other, hence α5 < 0. Common border and language indicator variables also serve as proxy for
transaction costs which should be lowered when trading partners share a common border or
speak a common language, therefore α6, α7, α8 > 0. The colonial ties serve as proxies for
historical ties and should positively influence bilateral trade flows, hence α9, α10 > 0.
4. The Definitions of the Variables and the Data Sources
Our dependent variables used in the estimating equation (1) are bilateral exports and imports
of seven MENA countries that are the most advanced in liberalizing their trade with the EU as
determination of the volume of imports. Finally, in the monopolistic competition model where all goods are differentiated capital-labor ratios have no impact on the volume of trade.
15
well as with each other. These include four North African countries: Algeria, Egypt, Morocco
and Tunisia, and three countries located in the Middle East: Israel, Jordan and Turkey. The
sample choice has been determined by data availability. The trade flows data comes from the
UN COMTRADE database and is expressed in the constant US dollars in 2000 prices. The
trade data is available for 196 trading partners and covers the period of 1980-2004. This
yields a total of almost 19 thousand observations. However, due to many missing
observations our panel is unbalanced.
Our main explanatory variables include dummy variables indicating the new EU
Association Agreements as well as dummy variables indicating the bilateral trade agreements
between the Agadir countries discussed in detail in Section 2 that were in force for the time
span covered by our sample. In addition to this in our study we control also for potential
effects of other preferential trading agreements concluded by the MENA countries. These
include: the EFTA agreements, the Arab Maghreb Union, the Arab Cooperation Council,
various bilateral agreements between MENA countries as well as bilateral agreements with
the EU associated states (now new EU member countries) in Central and Eastern Europe and
the NAFTA countries: Canada, Mexico and the US.16
Most MENA countries in addition to the EU Association Agreements concluded at
about the same time also free trade agreements with the EFTA countries that along with the
EU form the European Economic Area since 1994. The EFTA agreements with the MENA
countries that were in force during the period covered by our sample include Turkey (1992),
Israel (1993), Morocco (1999), and Jordan (2002).17 In addition to the bilateral trade
agreement between Israel and Turkey that is in force since 1997 these two countries
16
In our study we take into account potential effects of preferential trading agreements at different stages of their implementation as some of these agreements despite their entry into force have not been fully implemented yet and much of the liberalizing effort is still to come.
17
concluded a number of bilateral agreements with the CEE countries most of which joined the
EU in two subsequent waves of enlargement in 2004 and 2007.
Israeli free trade agreements with the CEE that entered into force include the
agreements with the Czech and Slovak Republics (1997), Hungary (1998), Poland (1998),
Slovenia (1998), Romania (2001) and Bulgaria (2002). Turkish free trade agreements with the
CEE countries that entered into force include the Czech and Slovak Republics (1998), Estonia
(1998), Lithuania (1998), Hungary (1998), Romania (1998), Bulgaria (1999), Latvia (2000),
Poland (2000), Slovenia (2000) and Croatia (2003).18
In our study we control also for the potential effects of plurilateral and bilateral trade
agreements concluded among the MENA countries. The plurilateral agreements include the
Arab Maghreb Union (AMU) and the Arab Cooperation Council (ACC). These are two
sub-regional agreements established in 1989 in the MENA region. The AMU includes five North
African countries: Algeria, Libya, Mauritania, Morocco and Tunisia while the ACC includes
four countries located in the Middle East: Egypt, Iraq, Jordan and Yemen. Although none of
these agreements was perceived as a successful in achieving trade liberalization the inclusion
of AMU and ACC dummy variables allows controlling for regional differences between two
main groups of countries in the MENA region: Maghreb and Mashreq.19
Given the failure of plurilateral trade liberalization at the sub-regional level some of
the MENA countries decided to pursue trade liberalization on a bilateral basis. This resulted
in a series of bilateral agreements concluded both between the MENA countries as well as
18
In addition to these Turkey concluded also bilateral agreements with the Balkan countries that emerged from the former Yugoslavia. These include the FTA with the FYR of Macedonia that entered into force in 2000 and was followed by the entry into force of the FTA with Bosnia-Hercegovina in 2003.
19
with the countries outside the region. In this respect the most active countries in the region
were Egypt and Jordan that liberalized trade not only among themselves but also with other
MENA countries including two other future members of the Agadir group: Tunisia and
Morocco, as well as with other Arab countries.20
Finally, to complete the analysis of the impact of bilateral free trade agreements we
also control for the agreements concluded by some MENA countries with the North American
countries that formed the NAFTA. The agreements that were in force during the period of our
investigation include the agreements concluded by Israel with the US (1985), Canada (1997)
and Mexico (2000) as well as the agreement concluded by Jordan with the US (2001).
Our main control variables derived from the trade theory include two types of
variables. The first refers to economic country size measures while the second to the measures
of factor proportions. The country size is measured using the data on trading partners’ GDPs
expressed in constant 2000 US dollars and evaluated in the PPP terms to assure their cross
country comparability. The GDP data comes from the World Development Indicators 2006
(WDI) database compiled and published on a CD-ROM by the World Bank in Washington.
Unfortunately, the data on capital per worker is not available neither for the MENA
countries and nor for the majority of their trading partners. Therefore, in our study we
approximate capital-labor ratios in trading partners with their per capita GDP.21 Data on GDP
per capita also comes from the WDI CD-ROM and is expressed in constant 2000 US dollars
and evaluated in PPP terms to enable its cross-country comparability. To test for the
robustness of our estimates we also use land to labor ratios that are calculated as the ratios of
areable land to total population. Both variables also come from the WDI CD-ROM.
20
These four future members of the Agadir group by the end of the 1990s have established a network of bilateral trade agreements among themselves most of which entered into force in 1999. In addition to these agreements we take into account in our study also other agreements that entered into force concluded by Egypt with Syria (1991), and by Jordan with United Arab Emirates (2001), Bahrain (2002), Syria (2002), Sudan (2004). Other agreements that were in force but whose effectiveness cannot be verified empirically due to the lack of data include the agreements concluded by Egypt with Libya (1991), Lebanon (1995) and Iraq (2001), and by Jordan with Kuwait (2002) and Lebanon (2003).
21
The remaining control variables include proxies for transportation and transaction
costs. Distance between trading partners is measured as simple geographic “as the crow flies”
distance between their capital cities and is expressed in kilometers. Distance data comes from
the CEPII database available online at www.cepii.fr. In addition to the simple geographic
proximity of trading partners we also include a dummy variable for the existence of a
common border that takes the value 1 when countries share a common border, zero otherwise.
Following other studies we also include two dummy variables for a common language
of trading partners. Language differences are often regarded as a major non-tariff barrier to
trade. Since Arabic is the official language in all countries in the MENA region except Turkey
we use a dummy variable that takes a value of 1 if Arabic is an official language in the partner
country and zero otherwise. For Turkey we define a special dummy variable that takes a value
of 1 if Turkish is an official language in the partner country and zero otherwise.22 Finally, to
control for historical ties we include two dummy variables indicating whether trading
countries were in a colonial relationship or had a common colonizer. Language and historical
ties data also comes from the CEPII database available online at www.cepii.fr. The summary
statistics are provided in the Appendix.
5. Empirical results
In this section we present two sets of empirical results based on estimating equation (1) that
include the averaged estimates for the whole MENA sample as well as the estimates obtained
separately for particular MENA countries.
5.1. Estimates for the whole MENA sample
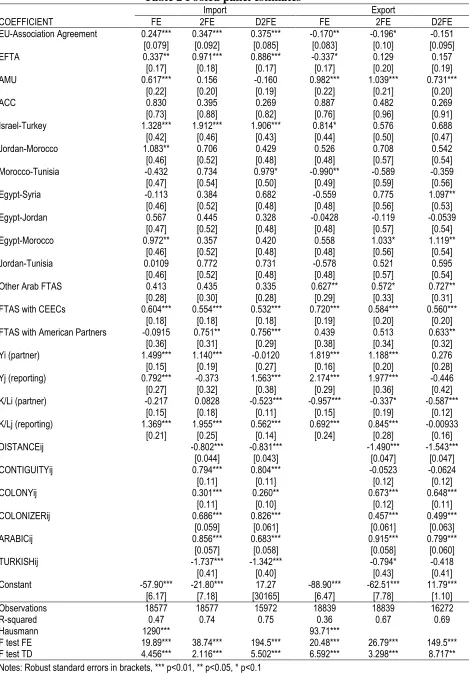
The estimation results for the whole MENA sample obtained using different estimation
methods are reported in Table 2. The baseline estimates for bilateral imports and bilateral
22
exports of the MENA countries obtained using the fixed effects estimation method that allows
controlling for country-pair specific effects as well as individual time effects for particular
years of our sample are reported in columns (1) and (4), respectively.23 The estimation results
show that both in the case of imports and exports of the MENA countries the estimated
parameters on the indicator variables for the new EU Association Agreements are statistically
significant already at the 1 percent level.
INSERT TABLE 2 HERE
However, while the estimated parameter on the EU dummy in the case of imports
displays a positive sign, it is negative in the case of exports. This finding confirms the
frequently expressed opinion that while the new EU Association Agreements provided a new
stimulus to the development of trade between the EU and the MENA countries it was only
due to the opening of the MENA markets to the manufactured goods produced in the EU. The
negative sign on the EU dummy variable in the case of MENA exports to the EU clearly
indicates the presence of barriers to trade on the EU side as trade in agricultural goods in
which the MENA countries have a comparative advantage still remains very restricted.
Very similar results can be reported for the case of free trade agreements concluded
with the EFTA countries where trade in agricultural goods has not also been liberalized.
Interestingly, in the case of free trade agreements concluded by Israel and Turkey with the
Central and Eastern European EU candidate countries the estimated parameters on the CEE
dummy both in the case of imports and exports are statistically significant and display
positive signs.24
23
The F-test for time specific effects confirms the appropriateness of including time dummies for particular years of our sample, while the Hausman test advocates the use of fixed effects instead of random effects in all estimated regressions for the whole MENA sample.
24
The parameter estimates on the intra-MENA agreements are mostly not statistically
significant, which confirms the general view that trade between these countries still remains
restricted, although some exceptions can be identified. In particular, among the plurilateral
intra-MENA agreements only the parameter on the Arab Maghreb Union dummy variable is
statistically significant at the 1 percent level both in the case of imports and exports. 25
Among the bilateral intra-MENA agreements only the parameters on Israel-Turkey agreement
is statistically significant at the 1 percent level, and only in the case of imports.
Moreover, it is worth noting that the estimated parameters on both factor proportion
variables and statistically significant at the 1 percent level and display the opposite signs. This
finding supports the general view that the standard Heckscher-Ohlin model with incomplete
specialization in production does well in explaining foreign trade of the MENA countries
which is still dominated by the inter-industry rather than intra-industry exchange.
The robustness of our baseline estimates is subsequently investigated in the remaining
columns of Table 2. It has been frequently argued that the fixed effects estimation method that
controls for country-pair specific effects might not be fully correct and specific effects
separately for trading countries must be taken into account (Matyas, 1997). The estimation
results obtained via the two-way fixed effects estimation method for imports and exports of
the MENA countries are reported in columns (2) and (5), respectively. However, compared to
the baseline results presented in columns (1) and (4), very little difference can be seen and our
major conclusions concerning the signs and statistical significance of the estimated
parameters remain unchanged.
Finally, in columns (3) and (6) we report the estimation results for imports and
exports, respectively, obtained using two-way fixed effects for the specification where the
from the world economy for almost fifty years after the World War II has been liberalized only recently which led to substantial trade creation.
25
factor proportions were expressed as land to labor ratios instead of GDP per capita and the
GDP series for both trading countries were expressed in first differences to address the
non-stationarity problem. However, these changes in the specification of our estimating equation
had no impact on our major conclusions. This means that the EU countries, at least in the
short-run, are the main beneficiaries of the new EU Association Agreements and the pattern
of trade of the MENA countries can be well explained by the standard Heckscher-Ohlin
model.
5.2. Estimates for particular MENA countries
To gain a deeper insight into what drives our empirical results we split our sample into seven
sub-samples for the particular MENA countries and estimate the gravity equations for their
bilateral exports and imports separately for each country using the fixed effects estimator that
allows controlling for the individual fixed effects for the partner country.26 The estimation
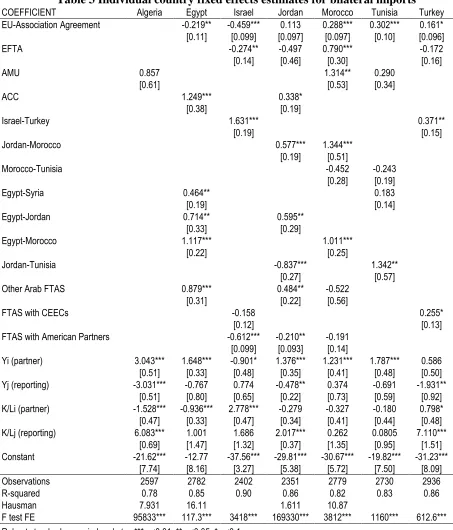
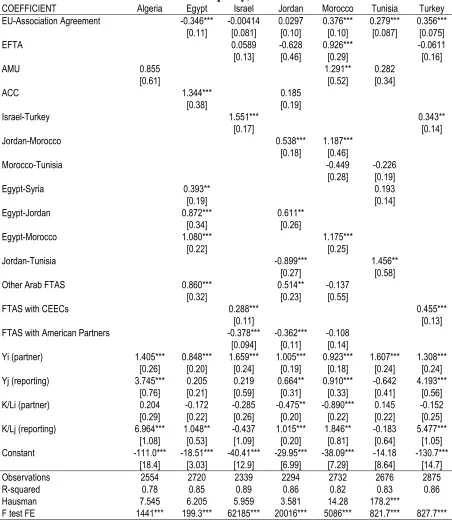
results for bilateral imports of the individual MENA countries are presented in Table 3 while
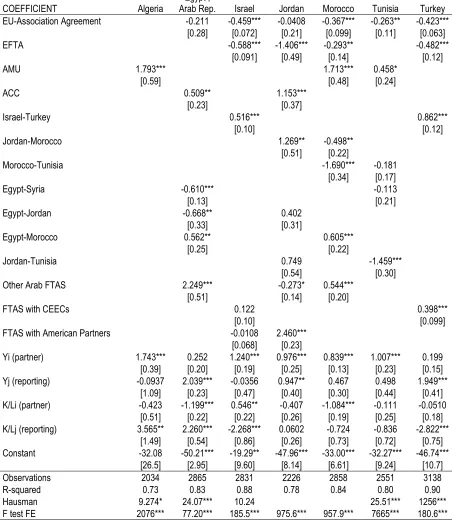
for bilateral exports in Table 4.
INSERT TABLE 3 HERE
We find that the estimated trade effects of the new EU Association Agreements are not
the same for all MENA countries and significant heterogeneity between them exists. In the
case of bilateral imports we obtained positive and statistically significant coefficients of the
indicator variables for the new EU Association Agreements only for Morocco, Tunisia and
Turkey. The estimated parameters on the EU dummy variable were not statistically significant
for Israel and Turkey, while for Egypt the estimated parameter was statistically significant but
displayed a negative sign.27
26
Time dummies are not included due to the perfect collinearity with the reporting country’s GDP.
27
INSERT TABLE 4 HERE
In the case of bilateral exports all estimated parameters on the EU dummy variables
display negative signs and the majority of them are statistically significant. The estimated
parameters are not statistically significant only for Egypt and Jordan - the countries that
concluded their association agreements with the EU only recently and are the least integrated
with the EU among the MENA countries as measured by the shares of their exports to the EU
in their total exports.
Very similar results can be reported also for free trade agreements concluded with the
EFTA countries. In the case of imports the only statistically significant and positive parameter
estimate on the EFTA dummy variable is reported for Morocco while for the other countries
parameter estimates are not statistically significant. In the case of exports all estimated
parameters on this variable display negative signs and the majority of them are statistically
significant.
Interestingly, all the estimated coefficients on the indicator variables for free trade
agreements with the Central and Eastern European EU candidate countries display positive
signs both in the case of imports and exports and are statistically significant except for Israel
in the case of exports. The estimated coefficient on the NAFTA dummy variable display
negative signs in most cases but not all of them are statistically significant. The only positive
and statistically significant coefficient on the NAFTA variable is reported for Jordan and only
in the case of exports.
The parameter estimates obtained for intra-MENA plurilateral agreements always
display positive signs but not all of them are statistically significant while in the case of
bilateral intra-MENA agreements, especially those concluded by the future members of the
Agadir group many parameters display negative signs and are highly statistically significant
which evidences existing barriers to trade.
Summing up, these empirical results generally support the commonly made claims that
trade liberalization among the MENA countries in the form of bilateral trade agreements that
preceded the Agadir Agreement was insufficient and its effectiveness can be called into
question. Nevertheless, we were able to demonstrate that they allowed at least some MENA
countries, although not necessarily the future members of the Agadir group, to increase their
bilateral trade flows.
6. Concluding remarks
In this paper we have studied the effectiveness of the recent EU-sponsored trade liberalization
in the MENA countries. We have found that while trade liberalization with the EU in the form
of new Association Agreements was on average effective in raising their bilateral imports
from the EU at the same time they did not contribute positively to the expansion of their
exports to the EU. The negative and statistically significant coefficients on the EU indicator
variables evidence the presence of trade restrictions on the MENA exports to the EU. This
suggests that the EU member states are the main beneficiaries of the new EU Association
Agreements, due to the opening of the MENA markets to industrial products from the EU
while keeping the EU markets closed to imports of agricultural goods from the MENA
countries.28
Regrettably, the new Association Agreements did not bring any significant progress in
the field of trade liberalization in agricultural goods in which the MENA countries have
comparative advantage and where a strong unexploited trade potential exists. Moreover, the
EU continues to subsidize its agricultural production through the costly and inefficient CAP
which counterbalances comparative advantage of the MENA countries and by preventing full
exploitation of the gains from trade hurts their economic development. Therefore, if the new
28
Association Agreements are to exert a symmetric impact on bilateral trade flows between the
EU and the MENA countries the EU countries should make their markets more open to
agricultural imports from the MENA countries and allow them compete on an even playing
field.
Another important issue is that vertical “hub and spoke” trade liberalization between
the EU and the MENA countries in the form of Association Agreements if not complemented
by horizontal trade liberalization among the MENA countries themselves might have adverse
effects for the location and development of their industrial activity leading to increased
unemployment in these countries as suggested by some new economic geography models.29
Therefore, future empirical studies should address this important issue by looking at the
impact of asymmetric trade liberalization on investment creation and investment diversion in
the MENA countries.30
Moreover, while the majority of the EU Association Agreements have already entered
into force horizontal trade liberalization among the MENA countries is still lagging behind.
Therefore, it is to be hoped that the EU Association Agreements will spur far reaching trade
liberalization in the MENA countries resulting in the creation of the regional FTA that would
counterbalance or at least reduce the impact of “hub and spoke” trade liberalization with the
EU. The Agadir Agreement is frequently seen as a stepping stone to the formation of such a
regional trading agreement. However, given the delays in its implementation it is too early to
evaluate its effectiveness. Therefore, trade liberalization among the Agadir group member
countries deserves closer attention in future empirical studies.
29
See for example Puga and Venables (1997). Although their insights turned out not to be robust with respect to model assumptions as demonstrated in Baldwin et al. (2003) the potential threat still exists.
30
References
Al-Atrash, H. and Yousef, T. (2000) Intra-Arab Trade: Is It too Little?, IMF Working Paper
No. 2000/10.
Augier, P. and Gasiorek, M. (2003), The Welfare Implications of Trade Liberalization between the Southern Mediterranean and the EU, Applied Economics, 35, 1171-1190.
Arnon, A., Spivak A., and Weinblatt, J. (1996) The Potential for Trade between Israel, the Palestinians and Jordan, World Economy, 19, 113-134.
Baldwin, R., Forslid, R., Martin, P., Ottaviano, G.M. and Robert-Nicoud, F. (2003) Economic Geography and Public Policy, Princeton University Press, Princeton.
Banks, A.S., (ed.), (1995) Political Handbook of the World 1994-1995, CSA Publications, Binghamton, NY.
Broto, C., Ruiz, J. and Vilarrubia, J. (2006) Firm Heterogeneity and Selection Bias: Estimating Trade Potential in the Euromed Region, Bank of Spain Working Paper, http://www.eco.uc3m.es/jruiz/research.
Cieślik, A. (2007) Augmented Gravity Equation and Incomplete Specialization in Production, Warsaw University, Department of Economics Working Paper.
Deardorff, A.V. (1998) Determinants of Bilateral Trade: Does Gravity Work in a Neoclassical World?, in: Frankel, J.A. (ed.), The Regionalization of the World Economy, The University of Chicago Press, Chicago.
de la Torre, A. and Kelly M. (1992) Regional Trading Arrangements, IMF Occasional Paper
No. 93.
Dennis, A. (2006) The Impact of Regional Trade Agreements and Trade Facilitation in the Middle East North Africa Region, World Bank Policy Research Working Paper WPS 3873. Ekholm, K., Torstensson, J. and Torstensson R. (1996) The Economics of Middle East Peace Process; Are there Prospects for Trade and Growth?, World Economy, 19, 555-574.
Evenett, S.J. and Keller, W. (2002) On the Theories Explaining the Success of the Gravity Equation, Journal of Political Economy, 110, 281-316.
Fischer, S. (1993) Prospects for Regional Integration in the Middle East, in: de Mello J. and Panagariya A. (eds.) New Dimensions in Regional Integration, Cambridge University Press, Cambridge.
Frankel, J.A. (1997) Regional Trading Blocs in the World Economic System, Institute for International Economics, Washington, D.C.
Hummels, D. and Levinsohn, J. (1995) Monopolistic Competition and International Trade: Reconsidering the Evidence, Quarterly Journal of Economics, 110, 799-836.
Jovanović, M.N. (2005) The Economics of European Integration: Limits and Prospects, Edward Elgar, Cheltenham.
Maskus, K.E. and Konan, D.E. (1997) Trade Liberalization in Egypt, Review of Development Economics, 1, 275-293.
Matyas, L. (1997) Proper econometric specification of the gravity model, World Economy,
20, 363–368.
Nugent, J.B. and Yousef, T.M. (2005) Does MENA Defy Gravity? How MENA has Performed in its Intraregional, EU and Other Trade: Implications for EU and Intra-MENA Trade Arrangements, EUI Working Paper No. 2005/26.
Peridy, N. (2005) The Trade Effects of the Euro-Mediterranean Partnership: What are the Lessons for ASEAN Countries?, Journal of Asian Economics, 16, 125-139.
Puga, D. and Venables, A. (1997) Preferential Trading Arrangements and Industrial Location,
Journal of International Economics, 43, 347-368.
Rutherford, T.J., Rutstrom, E.E. and Tarr, D. (1993) Morocco’s Free Trade Agreements with the European Community, World Bank Policy Research Working Paper WPS 1173.
Söderling, L. (2005) Is the Middle East and North Africa Region Achieving Its Trade Potential?, IMF Working Paper No. 2005/90.
Tovias, A. (1977) Tariff Preferences in Mediterranean Diplomacy, Macmillan, London. Tovias, A. (1997) The Impact of the Euro-Mediterranean Free Trade Area Initiative on Mediterranean Non-Member Countries, Mediterranean Politics, 2, 113-128.
Tovias, A., Kalaycioglu, S., Dafni, I., Ruben, E., and Herman, L. (2007) What Would Normalization of Economic Relations between Mashrek Countries, Turkey and Israel Imply?,
World Economy, 30, 665-684.
Table 1. The Euro-Mediterranean Association Agreements
Country Signature date Entry into force
Algeria 22.04.2002 01.09.2005 Egypt 25.06.2001 01.06.2004 Israel 20.11.1995 01.06.2000 Jordan 24.11.1997 01.05.2002
Lebanon 17.06.2002 In process of ratification (Interim Agreement for early implementation of trade measures in force since 01.03.2003)
Morocco 26.02.1996 01.03.2000 Palestinian Authority 24.02.1997 01.07.1997
(Interim association agreement)
Syria Negotiations concluded awaiting for signature
Tunisia 17.07.1995 01.03.1998 Turkey 06.03.1995 31.12.1995 Source: European Commission (2007).
Table 2 Pooled panel estimates
! " "#$ "!"
% #& % # & % '!& % ' & % " & % #!&
# " ''$ " # "!
% " & % "'& % " & % " & % & % "#&
( $" "!$ "$ #' " # "
% & % & % "#& % & % "& % &
' #! $# '' ' $#
% & % ''& % ' & % $& % #$& % #"&
) * + , " ' " #" " # $ '" ! $ $''
% & % $& % & % & % ! & % &
- . ( " ' $ # ! $ ' !
% $& % ! & % '& % '& % ! & % ! &
( * # # ## !'# !#
% & % ! & % ! & % #& % !#& % !$&
, /, "" ' $' !!# ! " #
% $& % ! & % '& % '& % !$& % ! &
, - . !$ ! ' ' ""# ! #
% & % ! & % '& % '& % ! & % ! &
, ( # ! !!' " " ""#
% $& % ! & % '& % '& % !$& % ! &
- . * " # " ! ' ! " !#!
% $& % ! & % '& % '& % ! & % ! &
0 1 / " ! ! $ !
% '& % & % '& % #& % & % "&
/ 2 0 $ !! ! !' !$
% "'& % "'& % "'& % "#& % & % &
/ 2 0 3 #"! !" !$ # !" $
% $& % "& % #& % '& % & % &
4 5 6 " ## " " " " '"# " "'' $
% "!& % "#& % & % "$& % & % '&
47 5 6 # " !$ " " # $
% & % & % '& % #& % $& % &
89: 5 6 " ' ' ! #! !'
% "!& % "'& % ""& % "!& % "#& % " &
89:7 5 6 " $# " #!! !$ $# ' ! #
% "& % !& % " & % & % '& % "$&
/ 7 ' ' " " # " !
% & % & % & % &
; 4 7 # ' ! $
% ""& % ""& % " & % " &
: 4 7 " $ $ $ '
% ""& % " & % " & % ""&
: < = 7 $'$ ' $ ! ##
% !#& % $"& % $"& % $ &
= > 7 '!$ $' #"! ##
% ! & % !'& % !'& % $ &
=8 /? 7 " " # "'
% "& % & % & % "&
! # " ' " '' # $ !" "" #
%$ " & % "'& % "$!& %$ & % '& %" " &
1 @ "'! "'! "!# "'' # "'' # "$
= A* . ! $ $ $#
? * " # # "
"# '# ' "# ! ' $ # " # !
!$ ""$ ! ! $ !# #' ' "
B = 1* . . 1 + C D "C D !C D "
E F . FF 5 6C E F . FF F . * , F )*. ; 3 .
0 C 1) ) . 89: , . F . FF F . * , )) F )*.
Table 3 Individual country fixed effects estimates for bilateral imports
) , ) - . ( * * + ,
"# !# "" '' "$"
% ""& % ##& % # & % # & % " & % #$&
# # "
% " & % $& % & % "$&
( '! " " #
% $"& % ! & % &
" # '
% '& % "#&
) * + , " $ " "
% "#& % "!&
- . ( ! "
% "#& % !"&
( * !
% '& % "#&
, /, $ "'
% "#& % " &
, - . " !#!
% & % #&
, ( " "" " ""
% & % !&
- . * ' "
% & % ! &
0 1 / ' # ' !
% "& % & % !$&
/ 2 0 "!' !!
% " & % " &
/ 2 0 3 $" " "#"
% ##& % # & % " &
4 5 6 " $ ' # " " $ " " " ' !'$
% !"& % & % '& % !& % "& % '& % ! &
47 5 6 " $ ' $#" " # "
% !"& % ' & % $!& % & % & % !#& % # &
89: 5 6 " ! ' # $ ' # "' #'
% & % & % & % & % "& % & % '&
89:7 5 6 $ ' " " " $'$ " $ ' ! ""
% $#& %" & %" & % & %" !& % #!& %" !"&
" $ " !$ # '" $ "# ' "
% & %' "$& % & %! '& %! & % ! & %' #&
1 @ !# ' !" # # $
= A* . ' '! # '$ ' ' '$
? * # " "$ "" " $"" " '
#!' "" "' "$# '" ""$ $" $
= 1* . . 1 + C D "C D !C D "
/ F )*. F . FF F * , 0 .* )*. . .* 1@ * )) , 2 0
Table 4 Individual country fixed effects estimates for bilateral exports
) , ) - . ( * * + ,
$! # "$ " ! #
% & % ''& % & % # & % " & % '&
" #' "
% ##& % #& % " & % " &
( " ' " ! #
% !#& % '& % &
" '
% !& % $&
) * + , !" ' $
% " & % ""&
- . ( " $
% !"& % "#&
( * " ' "!'
% & % " &
, /, $ " '
% ""& % "&
, - . " " #
% "& % "&
, ( $#
% & % &
- . * $ " $
% !!& % &
0 1 / "' $' $
% '& % " & % &
/ 2 0 !'" "
% " & % " &
/ 2 0 3 """ '
% $"& % &
4 5 6 ! #" "' " ! ' $' " '! ! !
% $"& % '& % !& % $& % #& % & % &
47 5 6 " #$ " " ' $ " " ! '
% $ & % '$& % ! & % & % $!& % "& % $ &
89: 5 6 " ! $" " !" " "
% !'& % $& % & % & % & % '& % &
89:7 5 6 '## # $ " #"$ # '!
% # & %" ! & %" $& % !!& %" & %" " & %" '&
! #$ ! '' ! # # ' """ $
%"" $& %' $!& % $#& %' '& %! #& % "$& %! #&
1 @ $' #" '#" # !# "#
= A* . ' '# ' ' ' '#
? * ! # $$ "! !$' !$ !
$ ""$ "$ " ' "" # " "$ "
= 1* . . 1 + C D "C D !C D "
/ F )*. F . FF F * , 0 .* )*. . .* 1@ * )) , 2 0
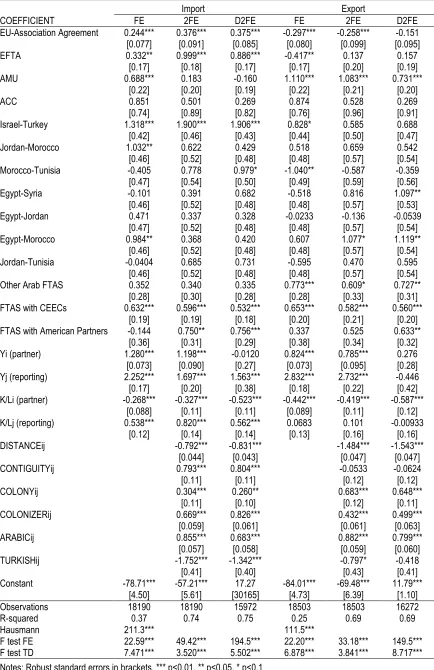
Table 5 Pooled panel estimates (arable land per capita as K/L proxy)
$ ! # !' "!"
% & % #"& % '!& % ' & % ##& % #!&
### ''$ " " "!
% " & % "'& % " & % " & % & % "#&
( $'' "' "$ " "" " ' "
% & % & % "#& % & % "& % &
'!" ! " $# ' ! ' $#
% & % '#& % ' & % $& % #$& % #"&
) * + , " "' " # " # $ ' ' !'! $''
% & % $& % & % & % ! & % &
- . ( " $ # !"' $!# !
% $& % ! & % '& % '& % ! & % ! &
( * ! ' # # " !' !#
% & % ! & % ! & % #& % !#& % !$&
, /, " " #" $' !"' '"$ " #
% $& % ! & % '& % '& % ! & % ! &
, - . " ' " $ ! #
% & % ! & % '& % '& % ! & % ! &
, ( #' $' $ " " ""#
% $& % ! & % '& % '& % ! & % ! &
- . * $'! " !#! !#!
% $& % ! & % '& % '& % ! & % ! &
0 1 / ! ! $ #
% '& % & % '& % '& % & % "&
/ 2 0 $ !#$ ! $! !' !$
% "#& % "#& % "'& % & % "& % &
/ 2 0 3 " ! !$ ! ! $
% $& % "& % #& % '& % & % &
4 5 6 " ' " "#' " ' '! $
% & % # & % & % & % #!& % '&
47 5 6 ! " $# " !$ ' $
% " & % & % '& % "'& % & % &
89: 5 6 $' ! "# !'
% ''& % ""& % ""& % '#& % ""& % " &
89:7 5 6 ! ' ' !$ $' " " #
% " & % " & % " & % " & % "$& % "$&
/ 7 # ' " " ' " !
% & % & % & % &
; 4 7 # ' ! $
% ""& % ""& % " & % " &
: 4 7 $ $' $ '
% ""& % " & % " & % ""&
: < = 7 $$# ' $ ##
% !#& % $"& % $"& % $ &
= > 7 '!! $' '' ##
% ! & % !'& % !#& % $ &
=8 /? 7 " ! " # "'
% "& % & % & % "&
' " ! " " ' " $# ' "" #
% ! & %! $"& % "$!& % & %$ #& %" " &
1 @ "'"# "'"# "!# "'! "'! "$
= A* . ! ! $# $#
? * "" """ !
!# # "# ! "' " # !
" ! ! ! $ ' ' ' " ' "
B = 1* . . 1 + C D "C D !C D "
1) ) . 89: , )) F E F . FF 5 6C E F . FF F .
* , F )*. ; 3 . 0 . F . FF F .
Table 6 Individual country fixed effects estimates for bilateral imports (arable land as K/L proxy)
) , ) - . ( * * + ,
$ " # $ # !$
% ""& % '"& % " & % " & % ' & % !&
!'# $ ' # $ $""
% " & % $& % #& % "$&
( '!! " #" '
% $"& % ! & % &
" "'!
% '& % "#&
) * + , " !!"
% " & % " &
- . ( ! ' " "'
% "'& % $&
( * # $
% '& % "#&
, /, # "#
% "#& % " &
, - . ' $""
% & % $&
, ( " ' " " !
% & % !&
- . * '## " !$
% & % !'&
0 1 / '$ !" "
% & % & % !!&
/ 2 0 '' !!
% ""& % " &
/ 2 0 3 ' $ " '
% # & % ""& % " &
4 5 6 " ! ' ' " $!# " ! # " $ " '
% $& % & % & % "#& % "'& % & % &
47 5 6 ! ! "# $$ #" $ "#
% $& % "& % !#& % "& % & % "& % !$&
89: 5 6 " '! ! '# " ! "!
% #& % & % $& % & % & % & % !&
89:7 5 6 $ #$ " ' " "! " ' $ "' !
%" '& % ! & %" #& % & % '"& % $ & %" !&
""" "' !" " # #! ' # " "' "
%"' & % & %" #& %$ ##& % #& %' $ & %" &
1 @ !! # # $ $ ' !
= A* . ' '! '# '$ ' ' '$
? * ! ! $ ! ! #!# !'" " ' " '
" " "## $ "'! "$ ! '$ ' " '
= 1* . . 1 + C D "C D !C D "
1) ) . 89: , / F )*. F . FF F * , 0 .*
)*. . .* 1@ * )) , 2 0 * , ; 3 ( ? * . @ . F
Table 7 Individual country fixed effects estimates for bilateral exports (arable land as K/L proxy)
)
, C
1 = ) - . ( * * + ,
"" !# ' $ $
% '& % & % "& % ##& % ""& % $ &
!'' " $ # '
% #"& % #& % " & % " &
( " # " " !'
% !#& % '& % &
! # " "!
% & % &
) * + , !"$ '$
% " & % " &
- . ( " $# #'
% !"& % &
( * " $# "'"
% & % " &
, /, $" ""
% " & % "&
, - . $$'
% & % "&
, ( !$ $ !
% !& % &
- . * # " !#
% ! & % &
0 1 / # !
% !"& % " & % &
/ 2 0 " #'
% " & % ##&
/ 2 0 3 " ' $
% $'& % &
4 5 6 " ! " # $ ' # " "##
% #& % & % "#& % !& % " & % & % "!&
47 5 6 # # !$ # $ #' " # #
%" #& % & % & % & % & % & % "&
89: 5 6 " "## ! $ " ' """ !"
% !"& % & % & % $& % "#& % !& % "'&
89:7 5 6 !$! $ $' $ ' $ '
%" #& % ! & % '$& % $& % & % & % !&
' ! " "# # #$ $
% $ !& % #!& %# $ & %' " & %$ $"& %# & %" &
1 @ '$! ' " $ '!' !!" " '
= A* . ' '' ' ' ' #
? * # " ! !" " !$
$ "'! ! # ! $ #! # $$! "' $
= 1* . . 1 + C D "C D !C D "
1) ) . 89: , / F )*. F . FF F * , 0 .*
)*. . .* 1@ * )) , 2 0 * , ; 3 ( ? * . @ . F