Munich Personal RePEc Archive
Terrorist Incidents in India, 1998–2004:
A Quantitative Analysis of Fatality Rates
Borooah, Vani
University of Ulster
2009
Online at
https://mpra.ub.uni-muenchen.de/19423/
Terrorist Incidents in India, 1998-2004:
A Quantitative Analysis of Fatality Rates
+Vani K. Borooah
*University of Ulster
December 2008
Abstract
Using data from the University of Maryland’s Global Terrorism Database II, this
paper first provides information on the nature of terrorist incidents in India in the
period 1998-2004: the Indian states that were worst affected by terrorist incidents and
fatalities; the terrorist groups responsible for such incidents and their modus operandi.
Next, the paper focuses on the issue of fatalities from terrorist incidents. It inquires
into the extent to which the number of fatalities following an incident was influenced
by the type of attack (bombings, armed assault etc.) and the extent to which it was
influenced by the type of terrorist group. By examining the number of fatalities
resulting from terrorist attacks in India, the paper disentangles the influence on this
number of attack type and attack group. Lastly, the paper applies Atkinson’s concept
of equality-adjusted income to terrorism to arrive at the concept of equality-adjusted
deaths from terrorist incidents: in order to avoid spectacular incidents resulting in the
loss of a large number of lives – as in New York on September 11, 2001 and in
Mumbai 26-29 November 2008 –“society” might be prepared to tolerate “low-grade”
terrorism which resulted in a larger number of deaths in total but avoided a large
number of deaths from a single iconic incident.
Keywords: Terrorism, Terrorist groups, Attack Type, India
+ The data used in this paper are from the Global Terrorism Database II, 1998-2004 available from the
Inter-University Consortium for Political and Social Research (ICPSR), http://www.icpsr.umich.edu. An earlier version of this paper was presented at a seminar at the Indira Gandhi Institute of
Development Research (IGIDR). Comments from participants at this seminar and from two anonymous referees to this journal have vastly improved the paper. However, I am entirely responsible for the results reported, for their interpretation, and, indeed, for the paper’s deficiencies.
* School of Economics, University of Ulster, Newtownabbey, Northern Ireland BT37 0QB. (Email:
Terrorist Incidents in India, 1998-2004:
A Quantitative Analysis of Fatality Rates
Abstract
Using data from the University of Maryland’s Global Terrorism Database II, this
paper first provides information on the nature of terrorist incidents in India in the
period 1998-2004: the Indian states that were worst affected by terrorist incidents and
fatalities; the terrorist groups responsible for such incidents and their modus operandi.
Next, the paper focuses on the issue of fatalities from terrorist incidents. It inquires
into the extent to which the number of fatalities following an incident was influenced
by the type of attack (bombings, armed assault etc.) and the extent to which it was
influenced by the type of terrorist group. By examining the number of fatalities
resulting from terrorist attacks in India, the paper disentangles the influence on this
number of attack type and attack group. Lastly, the paper applies Atkinson’s concept
of equality-adjusted income to terrorism to arrive at the concept of equality-adjusted
deaths from terrorist incidents: in order to avoid spectacular incidents resulting in the
loss of a large number of lives – as in New York on September 11, 2001 and in
Mumbai 26-29 November 2008 –“society” might be prepared to tolerate “low-grade”
terrorism which resulted in a larger number of deaths in total but avoided a large
number of deaths from a single iconic incident.
1. Introduction
This paper uses data from the LaFree and Dugan (2008) Global Terrorism
Database II (see also, LaFree, Dugan, Fogg, and Scott, 2006) to study the nature of
terrorist incidents in India in the seven-year period, 1998-2004. As LaFree and
Dugan (2008) observe, although the heightened consciousness of the menace of
terrorism of the past decade has led to a considerable increase in the literature on this
subject, much of this literature has been based on non-quantitative evidence: informed
opinion, intuition, and anecdotal evidence. In order, therefore, to provide a
quantitative base for the study of terrorism, LaFree and Dugan (2008) and LaFree,
Dugan, Fogg, and Scott (2006), under the auspices of the National Consortium for the
Study of Terrorism and the Response to Terrorism, have provided two Global
Terrorism Databases (GTD): GTD1 and GTD2 record, as far as is feasible, all known
terrorist incidents in the world1, along with ancillary information about the nature of
these incidents, for, respectively, the periods 1970-1997 and 1998-2004.2
Silke (2001) has addressed the issue of methodological issues in research on
terrorism. He argued that “most research [on terrorism] is based on secondary data
analysis and more specifically on analysis based on archival records” and that, in
particular, “over 80 per cent of all research on terrorism is based either solely or
1
In order to be considered a "terrorist incident" by the GTD, the event had to have been committed by non-state actors, had to have been violent, and intentional. In addition the act must have met two of the following three criteria: (1) The act must have been aimed at attaining a political, economic, religious, or social goal. In terms of economic goals, the exclusive pursuit of profit did not satisfy this criterion. (2) There must have been evidence of an intention to coerce, intimidate, or convey some other message to a larger audience (or audiences) than the immediate victims. (3) The action must have been outside the context of legitimate warfare activities, i.e. the act must have been outside the parameters permitted by international humanitarian law (particularly the admonition against deliberately targeting civilians or non-combatants). (LaFree and Dugan , 2008).
2
To produce the GTD2 an administrative staff managed both paid and volunteer researchers who monitored a variety of open sources, identified potential cases for inclusion in the database and then coded these cases. Data in this collection contain 7,154 events .The main variable categories presented in these data include: Identification Numbers, Incident Date, Incident Location, Incident Information, Attack Information, Target Information, Perpetrator Information, Perpetrator Statistics, Perpetrator Claim of Responsibility, Weapon Information, Casualty Information, Consequences,
primarily on data gathered from books, journals, the media (or media-derived
databases), or other published documents.” (p.5). However, within this research
genre, Silke (2001) shows that there has been very little attempt to match data from
secondary sources to the tools of statistical analysis: 5 percent of papers published in
major terrorism journals in 2000 involved inferential analysis; 15 percent used
descriptive statistics, and the remaining 80 percent did not involve any statistical
analysis whatsoever.3
Against this background, the purpose of this paper is to undertake a
quantitative analysis of deaths from terrorism using data from GTD2. The focus of the
analysis is on India. GTD2 recorded 7,184 terrorist incidents between 1998 and 2004.
The largest number of terrorist incidents occurred in India (784), followed by
Colombia (571), the Russian Federation (435), and Algeria (426).4 In terms of
terrorist-related fatalities, India (3,008 deaths) again headed the list of countries
followed by the USA ((2,385), Algeria (2,273), Iraq (2,203) and the Russian
Federation (2,097).5 Consequently, there is a strong justification for examining
terrorist actions in India.6 This justification has only been strengthened with the brutal
and bloody terrorist attack on Mumbai’s residents in November 2008.
The issue of terrorist related deaths has been addressed by Hultman (2007):
employing monthly data on 60 rebel groups, involved in armed conflict in the period
January 2002 to December 2004, she showed that rebels killed more civilians the
3 By contrast, 86 percent of papers in forensic psychology and 60 percent of papers in criminology
contained some form of statistical analysis with a majority of these employing inferential methods.
4 Other countries in which a substantial number of terrorist incidents occurred were: the Philippines
(380), Iraq (317), Spain (284), Northern Ireland (235), Turkey (224), Indonesia (214), Palestine (209), Federal Republic of Yugoslavia (202), Afghanistan (199), Israel (191), and Sri Lanka (158).
5 Other countries in which a substantial number of terrorist-related fatalities occurred were: Colombia
(1,696), Angola (1,464), Nepal (1,386), Sri Lanka (1,296), the Philippines (912), and Pakistan (878).
6 More recently, only Iraq has had more terrorist incidents than India. Even so, there have been seven
more fighters they lost in battle. Piazza (2009) has examined the hypothesis that
Islamist terrorist groups are more dangerous than non-Islamist groups because they
cause more casualties. The rise in the casualty rate from terrorism (the average
number of dead and wounded from terrorist incidents), from 2.08 between 1968 and
1979 to 10.89 for the period 200 to 2005, is conventionally explained by the parallel
rise in religious (i.e. Islamic) terrorism. Using data from the Terrorism Knowledge
Base for 135 groups and 383 incidents he showed that such a sweeping conclusion
needed to be tempered by the “ideological orientation” of the Islamist groups with
groups associated with al-Qaida being much more lethal than other, more secular,
Islamist groups.
This paper complements existing (quantitative) studies of the number of
victims (dead and wounded) from terrorism by taking a different, but not unrelated,
line. It hypothesises that the number of fatalities following a terrorist incident would
be influenced by the type of attack (bombing, armed assault etc.) and by the type of
terrorist group carrying out the attack. For example, ceteris paribus armed assaults
might, on average, result in more deaths than bombings but the number of deaths
might also be influenced by whether the armed assault or bombing was carried out by
Islamic jihadists or by Marxists. By examining the number of fatalities resulting from
terrorist attacks in India, it disentangles, using the decomposition methodology of
Blinder (1973) and Oaxaca (1973) – hereafter, the B-O decomposition - the influence
on this number of attack type and attack group.
The second strand of this paper is concerned with the “price” society might
be prepared to pay to avoid spectacular (and iconic) terrorist incidents. Weinberg et.
al. (2008) have drawn attention to the restrictions on civil liberties that followed the
clamour for war with Pakistan.7 In order to avoid such political and social (and
economic) turbulence, “society” might be prepared to tolerate a higher number of
terrorist-related deaths, provided these were sufficiently evenly distributed between
incidents as to obviate any particular incident being viewed as iconic.8
This strand is grounded in Atkinson’s (1970) concept of equality-adjusted
income: being averse to inequality, society regards a smaller level of national income,
which is equally distributed, as yielding the same amount of social welfare as a larger,
but unequally distributed, income; the reduction in income that society is prepared to
countenance depends upon its aversion to inequality. In this paper the concept is
extended to terrorism by developing the idea of the “equality-adjusted number of
deaths” from terrorist incidents: in order to avoid the social and political fall-out from
spectacular incidents resulting in the loss of a large number of lives – as in New York
on September 11, 2001 and in Mumbai 26-29 November 2008 –“society” might be
prepared to tolerate “low-grade” terrorism which resulted in a larger number of deaths
in total but avoided a large number of deaths from a single iconic incident. Estimates
of such equality-adjusted deaths, under different degrees of inequality aversion, are
provided.
2. An Overview of Terrorist Incidents in India
This section provides information on the nature of terrorist incidents in India
in the period 1998-2004: the Indian states worst affected by terrorist incidents and
fatalities and the terrorist groups responsible for such incidents and their modus
7 The Financial Times reported a former Indian ambassador to the United Nations as demanding that “if there is anotherattack we should go in and bomb the daylights out of them” (Indian hawks call for strike on Pakistan, 19 December 2008)
8 Frey (2004) has drawn attention to the economic effects of terrorism. The targeting of tourism means
operandi. Over the period 1998-2004, there were, according to GTD2, 784 terrorist
incidents in India which resulted in 3,008 deaths. Table 1 shows that 61 percent of
these incidents (480 in number) and 55 percent of these fatalities (1,658 in number)
occurred in Jammu and Kashmir followed by: 11 percent of incidents (85) and 13
percent of fatalities (376) in Assam; 6 percent of incidents (48) and 3 percent of
fatalities (90) in Andhra Pradesh; and 3 percent of incidents in Bihar and Tripura (26
and 25 respectively) but with 5 percent of fatalities (156) in Bihar and 3 percent (25)
in Tripura. If one considers the North-East of India in its entirety – Arunachal
Pradesh, Assam, Manipur, Meghalaya, Mizoram, Nagaland, and Tripura – then 123
incidents (16 percent of the all-India total of 784 incidents) and 682 fatalities (23
percent of the all-India total of 3,008 fatalities) occurred in this region. Thus,
between 1998 and 2004, the states of Jammu and Kashmir, Andhra Pradesh, and
Bihar and the North-East of India collectively accounted for 86 percent of terrorist
incidents and of incident-derived fatalities in India.9
None of these three theatres of conflict – Jammu and Kashmir, the North-East
of India, and Bihar and Andhra Pradesh – should be viewed as isolated conflicts,
independent of events on the international stage and of each other. Haleem (2004) has
argued that, apart from home grown terrorists, the Kashmir dispute has attracted
al-Qaida fighters who view the dispute as part of a larger Islamic strategy. The
Lashkar-e-Taib’s agenda, as outlined in a pamphlet titled, "Why are we waging jihad,"
includes the restoration of Islamic rule over all parts of India; the pamphlet also
declares the United States, Israel, and India as existential enemies of Islam (Haqqani,
2005). Similarly, Mehra (2000) has drawn attention to the absence of agrarian reform
9 The largest number of fatalities from a single incident were: 52 in Mumbai, 25 August 2003; 35 in
in India, and Borooah (2009) to poverty and illiteracy in Indian districts, as factors
explaining the rise in Marxist violence in certain parts of India. Lastly, Saikia (2003)
has linked the ethnic-based and non-Islamic terrorist movements in the North-East of
India to a wider Islamic agenda in which al-Qaida operatives in Bangladesh are
fomenting the creation of a “Greater Bangladesh” (Brihot Bangladesh) and are
subordinating the traditional pro-Hindu loyalties of the United Liberation Front of
Assam (ULFA) to this end.
Table 2 shows terrorist incidents, and fatalities resulting from such incidents
by the main terrorist groupings. In the Indian context there were three main groups of
terrorists: Islamic; Marxist; and North-Eastern terrorist groups. These three groups
collectively accounted for 298 (38 percent of the total of 784) incidents and 1,667 (55
percent of the total of 3,008) fatalities in India.10 The main Islamic groups were the
Lashkar-e-Taiba (47 incidents, 371 fatalities), Hizb-ul-Mujahidin (34 incidents, 173
fatalities), and Jaish-e-Mohammad (11 incidents, 39 fatalities).11 The main Marxist
groups were the People’s War Group (46 incidents, 189 fatalities) and the Maoist
Communist Centre (14 incidents, 98 fatalities).12 The main North-East groups were
10 The perpetrators of the remaining incidents were either unknown (399 out of 784) or small, isolated
groups.
11Lashkar-e-Taiba (Soldiers of the Pure) rose to prominence nearly 10 years ago and has often been
blamed by the Indian authorities for carrying out armed attacks, not only in Kashmir, but also elsewhere in India.. It is held responsible for the Mumbai bombings of August 2003 and of the attack on the Indian Parliament in December 2001(http://news.bbc.co.uk/1/hi/world/south_asia/3181925.stm).
Hizb ul-Mujahidin, the largest Kashmiri militant group, was founded in 1989 and officially supports the liberation of Jammu and Kashmir and its accession to Pakistan, although some cadres are pro-independence. The group is the militant wing of Pakistan’s largest Islamic political party, the Jamaat-i-Islami. It currently is focused on Indian security forces and politicians in Jammu and Kashmir and has conducted operations jointly with other Kashmiri militants (http://www.fas.org/irp/world/para/hm.htm).
the United Liberation Front of Assam (36 incidents, 165 fatalities), the National
Liberation Front of Tripura and the All Tripura Tiger Force (collectively, 27
incidents, 196 fatalities), the National Democratic Front of Bodoland and the Bodo
Liberation Tigers (collectively, 20 incidents, 141 fatalities).13
Of the 126 incidents for which the Islamic groups were responsible, 12 were
suicide attacks and, of these 12 suicide attacks: six were by the Lashkar-e-Taiba, two
were by its surrogate, Al-Mansurian [LeT front], and two were by the
Jaish-e-Mohammad. The Marxist and North-Eastern groups were responsible for one suicide
attack each by, respectively, the People’s War Group and the United Liberation Front
of Assam.
3. Fatalities, Attack Type, and Terrorist Groups
For each of the 784 terrorist incidents in India between 1998 and 2004, GTD2
provided details of the incident’s primary type of attack: bombing (378 incidents);
armed assault – that is, an attack whose primary objective was to cause physical harm,
including death, to individuals by means other than explosives (298); assassination –
that is, an attack whose primary objective was to kill one or more prominent persons
(52); infrastructure attack – that is, an attack whose primary objective was to damage
non-human targets using non-explosive means like arson (35); hostage taking – that
is, an attack whose primary objective was to obtain concessions in exchange for
militia groups (like the Ranvir Sena) defending upper-caste interests
(http://en.wikipedia.org/wiki/Maoist_Communist_Centre_of_India#Dakshin_Desh).
13 The United Liberation Front of Assam is a militant group from Assam, among many other such
groups in North-East India. It seeks to establish a sovereign Assam via an armed struggle. The Government of India had banned the organization in 1990 and classifies it as a terrorist group. (http://en.wikipedia.org/wiki/United_Liberation_Front_of_Asom). The National Democratic Front of Bodoland aims to get a sovereign Bodoland north of the Brahmaputra River. It was very active during the 1990s. However, under an agreement on May 24, 2005 with the Government of India, it has been maintaining a ceasefire (http://en.wikipedia.org/wiki/National_Democratic_Front_of_Bodoland). The
National Liberation Front of Tripura was formed in December 1989 to create an independent state of Tripura. It has conducted a systematic and violent campaign for secession from India and has been declared by the Government of India as a terrorist organization
release of hostages (20). It should be emphasised that these were the primary types of
attack; some incidents involved more than one type of attack.
GTD2 also provided details of the target of attack. If one collapses its
information into military/police (MP) and non-military/police targets (NMP), then of
the total of 784 terrorist incidents in India, in the period 1998-2004, 394 incidents (40
percent) were directed towards MP targets. Islamic terrorists directed 56 percent of
their incidents (71 out of 126) towards MP targets, followed by Marxists and
North-Eastern terrorists who directed, respectively, 37 and 27 percent of their incidents
towards MP targets.
The number of fatalities resulting from an incident depended upon both the
type of attack. Table 3 shows that armed assaults resulted in 6.05 fatalities per
incident, followed by 2.78 fatalities for bombings. However there was hardly any
difference in fatality rates in respect of the target of attack: it was 3.75 for MP targets
(1,164 deaths from 310 incidents) and 3.80 for NMP targets (1,844 deaths from 474
incidents). Table 4 shows that average fatalities were: 6.21 per incident when Islamic
group carried out attacks; 5.63 per incident for North-Eastern groups; and 4.52 for
Marxist groups. Consequently, the number of fatalities from a terrorist incident
would depend upon the type of attack and upon the group responsible for the attack.
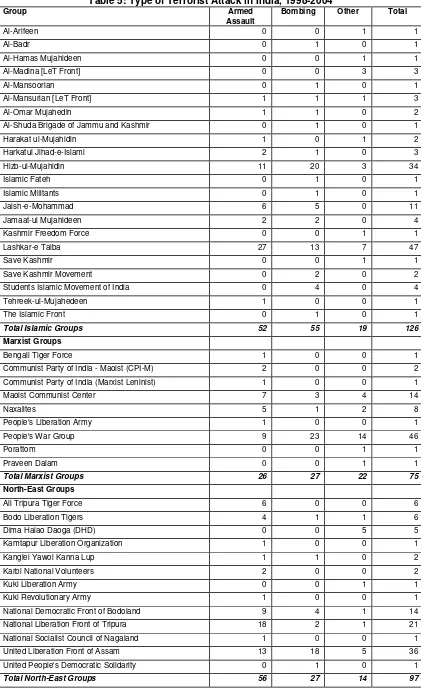
Table 5 combines Tables 3 and 4 to show the modes of attack in terrorist incidents in
India, between 1998 and 2004, for which Islamic, Marxist and North-Eastern groups
were responsible
Table 6 shows the estimates from a regression equation in which the number
(bombing, armed assault, “other” attack types14
) and by the type of terrorist group
(Islamic, Marxist, North-Eastern, “residual”15).
Terrorist groups differ in the quality of their “equipment” where this may be
psychological (ruthlessness, commitment, preparedness to die) as well as physical
(quality of weapons and training, the size and quality of the support group).16 It is,
therefore, possible that the fatalities resulting from a particular attack type (say, armed
assault) might be different if it was carried out by an Islamic group compared to a
North-Eastern group. In order to account for this, the fatalities equation was
estimated allowing the coefficients on the bombing and armed assault terms to vary
by terrorist group.17
Table 6 shows that an incident caused by a residual group (that is, one which
was not Islamic/Marxist/North-Eastern), using a type of assault which was neither
bombing nor an armed assault, would result in (an average of) 1.11 casualties; a
bombing would have added 0.74 fatalities, and an armed assault would have added
3.79 fatalities, to this number. When, however, an Islamic group carried out an armed
assault, the average number of fatalities would rise by a further 2.07+1.01=3.08
reaching a total of 7.98. Table 7 sets out more succinctly the fatalities implied by the
regression estimates of Table 6.
The results shown in Tables 6 (and its derivative, Table 7) raise the question
of why the number of fatalities (fatality rates), following a terrorist incident, differed
according to the terrorist group responsible. Was it due to inter-group differences in
“equipment” (as defined earlier)? For example, as Table 7 shows, the fatality rate
14Assassination, infrastructure attack, hostages. This “other” type of attack was the residual. 15 Identified and unidentified perpetrators.
16 They differ also in the quality of the opposition that they face: dealing with the might of the Indian
army and Indian paramilitary forces in Kashmir is a different proposition from dealing with the district police in Bihar and Andhra Pradesh.
from terrorist incidents, under an armed assault, was: 7.98 when Islamic groups were
responsible, 5.54 when Marxist groups were responsible and 7.94 when North-Eastern
groups were responsible. Or could the inter-group difference in fatality rates be
explained by the fact that different groups were disposed towards different types of
attack? For example, as Table 5 shows, 41 percent of Islamic incidents involved
armed assault as the primary mode of attack, compared to 35 percent for Marxist
groups, and 58 percent for North-Eastern groups. The next section addresses this
question.
4. The Decomposition of Fatalities from Terrorist Incidents
The B-O method (Blinder, 1973; Oaxaca, 1973) of decomposing differences
between groups, in their respective mean values, into “discrimination” and
“characteristics” components is, arguably, the most widely used decomposition
technique in economics. In this section, this method is applied to decomposing the
average number of fatalities from terrorist incidents into an “attack type” and a “group
type” effect.
The basic idea behind this decomposition is as follows, the details being
provided in the technical appendix to this paper. The difference between average
fatalities from, say, Islamic and Marxist terrorist incidents could be due to, at least,
two reasons. First, the two groups employed, on average, different attack types: as
Table 3 shows, the fatality rate was different between incidents in which the primary
modes of attack were bombing and armed assaults. Second, the two groups differed
in terms of their residual factors: that is all those factors not explicitly controlled for
in the regression equation. At the risk of simplification, we identify this residual
as Table 4 shows, the fatality rate was considerably higher in incidents for which
Islamic, compared to Marxist, groups were responsible.
There is evidence establishing the rigours of jihadisttraining. Lia (2008)’s
study of such training argues that there is considerable agreement among jihadists
about the importance of training - “training and preparation is an integral part of jihad
and therefore an individual religious duty…ideological indoctrination and spiritual
preparation takes precedence over physical and military training. Moreover, since
jihad is such a painful and brutal process, the preparatory process must accustom the
recruit to this reality: they must learn determination, patience, and self-sacrifice; they
should learn to endure the brutality of war, but also to employ its savagery against
Islam’s enemies.” (p. 519).
In addition to the rigours of training, Pakistani jihadists appeared to have the
full support of their families. Fair (2008) surveyed 141 Pakistani families whose male
members had become shaheed (martyrs) in Kashmir and Afghanistan. As Fair (2008,
p. 60) notes “Pakistan, like Palestine and other theatres for Islamist conflict, has a rich
martyrdom culture wherein the community confers an important status to families of
shaheed.” Fair (2008) argues that, contrary to popular belief, Pakistani terrorists
operating in Kashmir and Afghanistan, and their households, were very well educated
by Pakistani standards. So, in terms of equipment, there is evidence that Islamic
jihadists operating in India were sufficiently well educated and motivated to readily
absorb the high quality of training they received.
We can disentangle these influences by considering a hypothetical situation in
which the “equipment” factor is held constant. This is done by answering the
(hypothetical) question: what would the average number of fatalities have been if, in
using Islamic “equipment”? Call this the “Marxist [Islamic]” fatality rate. The
difference between the average fatality rate from incidents for which Islamic groups
were responsible and the “Marxist [Islamic]” fatality rate isolates the effect of attack
type: holding “equipment” constant at Islamic levels, this difference represents the
inter-group difference in fatality rates due to differences between the two groups in
their attack types. Call this the inter-group attack type difference.
The hypothetical question could, of course, have been posed differently: what
would the average number of fatalities have been if, in incidents for which Islamic
groups were responsible, the “attacktype” had been carried out using Marxist
“equipment”? Call this the “Islamic [Marxist]” fatality rate. The difference between
the average fatality rate from incidents for which Islamic groups were responsible and
the “Marxist [Islamic]” fatality rate also isolates the effect of attack type: holding
“equipment” constant at Marxist levels, this difference also represents the inter-group
difference in fatality rates due to differences between the two groups in their attack
types.
The gap between the observed inter-group difference in fatality rates and the
attack type difference is the residual difference. It represents that part of the
(observed) difference in average fatality rates between Islamic and Marxist terrorist
incidents that cannot be explained by differences between them in their attack type.
By default, this residual is then attributed to differences between them in their
“equipment”. It is important to point out that the two separate conceptions of
inter-group attack type difference –the first based on the “Marxist [Islamic]”, and the
second on the “Islamic [Marxist]”, fatality rate - need not be equal. Consequently, the
residual effects, from the two formulations of the hypothetical question, need not be
sizes of the two attribute (“attack type”) effects will be different depending upon the
choice of a common set of coefficients (Islamic or Marxist) for comparing the effects
of the two different sets of attributes (“attack types”).
Table 8 shows the results from the B-O decomposition of fatality rates by the
three main terrorist group types operating in India: Islamic, Marxist, and
North-Eastern. The first row panel of the Table compares Islamic with Marxist groups. The
second column item in this row shows that the difference in average fatality rates
between Islamic (6.21) and Marxist (4.52) terrorist incidents was 1.69. The column
following this shows that if Marxist terrorist incidents had been carried out using
Islamic “equipment”, the fatality rate from Marxist incidents would have risen to
5.75, narrowing the Islamic-Marxist fatality rate gap to 0.46.
In other words, 27 percent of the observed difference in fatality rates between
Islamic and Marxist groups (0.46 of 1.69) could be explained by the fact that,
compared to Islamic terrorists, Marxists, on average, adopted a different attack type:
as Table 5 shows, 41 percent of Islamic, compared to 35 percent of Marxist, incidents
involved armed assault as the primary mode of attack. The remaining difference (73
percent: 1.23 of 1.69) was explained by “equipment” differences between Islamic and
Marxist terrorist groups.
The last panel of Table 8, under the column headed “attack type difference”,
shows that if Islamic terrorist incidents had been carried out using Marxist
“equipment”, the fatality rate from Islamic incidents would have fallen to 5.19
narrowing the gap between Islamic and Marxist fatality rates to 0.67. Thus, on this
reckoning, 40 percent of the observed difference in fatality rates between Islamic and
Marxist groups (0.67 of 1.69) could be explained by the fact that, compared to Islamic
percent was explained by “equipment” differences between Islamic and Marxist
terrorist groups.
The middle row panel of Table 8 compares Islamic with North-Eastern groups.
There was a difference of 0.58 in the average number of fatalities resulting from
incidents for which the two groups were responsible (Islamic: 6.21; North-Eastern:
5.63). If North-Eastern terrorist groups had carried out their attacks using Islamic
“equipment” the fatality rate from such incidents would have risen to 6.65, higher
than the average fatality rate of 6.21 from Islamic terrorist incidents. Similarly, as the
last panel of Table 8 shows, if Islamic terrorists had carried out their attacks using
North-Eastern levels of “equipment”, the average fatality rate from Islamic incidents
would have fallen to 4.95, lower than the average fatality rate of 5.63 from
North-Eastern terrorist incidents.
The reason for this is two-fold. First, as Table 3 shows, the fatality rate from
armed assault was substantially higher than that from other attack forms. Second, as
Table 5 shows, 58 percent of North-Eastern - compared to 44 percent of Islamic -
incidents, involved armed assault as the primary mode of attack. Consequently, what
keeps the fatality rate from terrorist incidents perpetrated by North-East groups lower
than those perpetrated by Islamic groups is that the former do not operate with the
“equipment” of Islamic terrorists: had they received the training and weapons of, and
been as ruthless and committed as, Islamic terrorists, the fatality rate in the North-East
from terrorist incidents would have been much higher than it was.
It is possible to offer some justification for the above statement. First, the
quality of training received by Islamic jihadists, operating mainly in Kashmir but also
in other parts of India, has been commented upon. Second, as is widely accepted, the
role in providing such training and the ancillary guns and explosives.18 Of the
countries neighbouring the north eastern states of India, the role of Bhutan and Nepal
has largely been to provide safe havens for terrorists from these states: indeed, ULFA
and the National Democratic Front of Bodoland have had their headquarters in
Bhutan. However Saikia (2002) reports that the ISI is operating camps in Bangladesh
providing training in terrorist activities to North-Eastern groups collectively known as
the United Liberation Front of the Seven Sisters.19 Indeed, as long ago as March
1994 the Assam Assembly was told that about 200 ULFA members had received
training from the ISI (Verghese, 1996, p. 60).
The last panel of Table 8 compares fatality rates between North-Eastern and
Marxist group incidents. The average number of fatalities rates from Marxist incidents
was 1.11 fewer than from North-Eastern incidents. Of this difference, 60 percent
could be explained by differences in attack type between the two groups if Marxist
incidents were carried out using North-Eastern “equipment” (0.68 of 1.11); on the
other hand, if North-Eastern incidents were carried out using Marxist “equipment”, 51
percent of the North-Eastern-Marxist difference in fatality rates (0.57 of 1.11) could
be explained by differences in attack type between the two groups.
5. Inequality Analysis of Deaths from Terrorist Incidents in India
The previous discussion was based on an analysis of the average number of
fatalities from incidents for which terrorist groups in India were responsible.
However, focusing exclusively on the average ignores the distribution of the total
number of deaths across incidents: the total that results from a few spectacular
incidents producing a large number of deaths, with the majority of incidents being
18 The ISI, with its headquarters in Islamabad and headed by a lieutenant general of the Pakistani army,
is in complete charge of all covert operations outside Pakistan.
relatively light on fatalities, might also be the result of a relatively equal distribution
of fatalities across incidents.
In order to address the distributional issue, we computed the Gini coefficient
for the distribution of fatalities, in incidents for which the three main terrorist groups
in India – Islamic, Marxist, and North-Eastern - were responsible, for the two major
types of attack: armed assault and bombing. Applied to the distribution of fatalities
from terrorist incidents, if N is the number of incidents, and Fi is the number of
(non-terrorist) deaths from incident i(i=1…N), and
1
/
N i i
F N
represents the averagenumber of deaths, the Gini coefficient is defined as:
2
1 1
1
| |
2
N N
i j i j
G F F
N
In other words, the Gini coefficient is computed as half the mean of the difference in
the number of deaths between pairs of incidents, divided by the average (). So,
G=0.45 implies that the difference in the number of deaths between two incidents
chosen at random will be 90 percent of the average number of deaths: if =1, this
difference will be 0.9 fatalities.
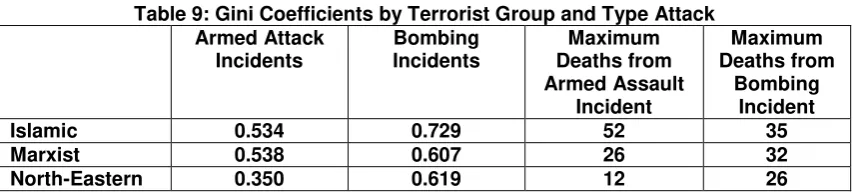
Table 9 shows that, judging by the values of the Gini coefficient, the
distributions of the 415 deaths resulting from the 52 armed assault incidents for which
Islamic groups were responsible, and the 144 deaths resulting from the 26 armed
incidents for which Marxist groups were responsible, displayed similar degrees of
inequality (Gini coefficient of 0.534 and 0.538, respectively); however, the
inter-incident distribution of the 445 deaths resulting from the 56 armed assault inter-incidents
for which the North-Eastern groups were responsible was much more equal (Gini
coefficient of 0.35). On the other hand, as Table 9 shows, there was considerable
values of the Gini coefficient for bombing deaths were 0.7229 for Islamic groups;
0.607 for Marxist groups; and 0.619 for North-Eastern groups.
What is the social loss from terrorist incidents? If the number of fatalities is
used as an indicator of loss, then both the average number of deaths and the
inter-incident distribution of deaths serve to determine the size of social loss. In his seminal
paper on income inequality, Atkinson (1970) argued that “society” would be prepared
to accept a reduction in average income, provided the lower income was equally
distributed, from a higher average income which was unequally distributed.20 The size
of this reduction depended upon our degree of "inequality aversion" which Atkinson
(1970) measured by the value of an “inequality aversion” parameter 0.21
In a similar vein, Anand and Sen (1997) compared the Honduras (with an
average literacy rate of 75%, distributed between men and women as 78%, 73%) with
China (with an average literacy rate of 80%, distributed between men and women as
92%, 68%) and asked which country should be regarded as having the "better"
achievement with regard to literacy: China with a higher overall rate or the Honduras
with greater gender equality?
These ideas can, equally well, be applied to the measurement of the social loss
from terrorism. If one is to averse to spectacular, high-profile incidents – 9/11 in New
York, 26/11 in Mumbai – in which a large number of innocent lives are lost, with the
consequence that the prevailing socio-political mood becomes one of fear, insecurity,
and paranoia, then one might “prefer” low-grade terrorism with several low-fatality
incidents, and no high-fatality ones, to an iconic incident(s) which inflicts death on a
20 In the language of economics, the two situations would yield the same level of social welfare, i.e. be
'welfare equivalent'.
21 When 0, we are not at all averse to inequality implying that we would not be prepared to accept
large scale. We can increase the average number of deaths from terrorist incidents in a
country,F, by the amount of inter-incident inequality in fatalities, to arrive at e
F , an
"equity sensitive" fatality rate for the country, e .
F F . We refer to e
F as the equally
distributed equivalent fatality rate: when every terrorist incident results in exactly e
F
deaths, e
F is welfare equivalent toF.
Following from this, Atkinson’s (1970) index, defined with respect to the
parameter,, as applied to differences between terrorist incidents in their number of
deaths, yields:
1/(1 ) 1
1
1
( / ) 1 1
N
e i
i
F
A F F N
F
When =0, society is indifferent about the inter-incident distribution of a
given total of deaths from terrorist incidents and e
F F; for >0, e
F F andA 0.
The higher the value of the inequality aversion parameter, , the greater will the value
of e
F and hence of Ae.
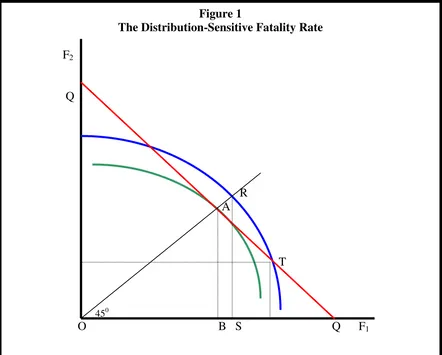
The above points can be illustrated diagrammatically in Figure 1. If there are
two incidents, each point on QQ represents a (F1, F2) combination that yields the
same (given) total of deaths, F=F1+ F2 and, therefore the same (given) value of
F=F/2: QQ is the fatality-possibility locus corresponding to F and its slope is -1.
For N incidents, the loss function is:
1 2
( , ,..., N), 0, 0, if i 0 and i/ i 0,
LL F F F L L F i L F i. In additively
decomposable form, the loss function becomes:
1
( ), where (.) 0
N i i L F
is strictly convex then social marginal loss increases for increases in .Fi Consequently,
for a given total of deaths, F, social loss will be minimised when: F1 F2 .. FN.
For N=2, the indifference curves associated with the loss function, with curves
further away representing higher levels of loss, are superimposed upon QQ . Social
loss is minimised at a point where an indifference curve is tangential to QQ and this
will occur, by convexity of the loss function, when F1=F2. Consequently, tangency
between the indifference curve and QQ occurs at a point (A) on the 450 line:
equilibrium occurs when both incidents result in an identical number of deaths.
If, however, the outcomes with respect to the two incidents are at T, then the
total number of deaths, AB, if distributed according to T, is welfare-equivalent to a
larger total RS, where RS is equally distributed between the two incidents. The degree
of inequality in the inter-incident distribution of the number of deaths is (RS/AB)-1
and this is also the percentage amount by which the social loss from locating at T
exceeds its minimum value at A. The greater the aversion to inequality, the more
bowed will be the indifference curves, the higher will R be along the 450 line, and the
greater will be the social loss associated with the point T.
Table 10 shows the equally distributed equivalent (ede) number of deaths and
the ede fatality rate for the three main terrorist groups in India (Islamic, Marxist,
North-Eastern), for the two main attack types (armed assault and bombing) under
different degrees of inequality aversion. When =0.25 (mildest inequality aversion),
“society” would be prepared to tolerate 466 deaths (as compared to the actual number
of 415 deaths) from the 53 Islamic-engendered armed assault attacks, and 396 deaths
(as compared to the actual number of 313 deaths) from the 56 Islamic-engendered
bombing attacks, provided these higher numbers were equally distributed between the
For deaths caused by incidents for which North-Eastern groups were
responsible, “society” would be prepared to tolerate 468 deaths (as compared to the
actual number of 445 deaths) from the 56 armed assaults carried out by North-Eastern
groups, and 108 deaths (as compared to the actual number of 93 deaths) from the 27
bombing attacks carried out by North-Eastern groups, provided these higher numbers
were equally distributed between the incidents.
As inequality to aversion increased, the ede number of deaths and, by
corollary, the ede fatality rate rose: in order to compensate for the unequal distribution
of deaths between the different terrorist incidents, “society” would be prepared to
tolerate increasingly larger numbers of deaths, provided these were equally
distributed between the incidents.
6. Conclusions
This paper analysed fatality rates from terrorist incidents in India between
1998 and 2004 with respect to the terrorist groups responsible for such incidents. The
two main conclusions to emerge from this study are that, of the three main terrorist
groups in India, Islamic terrorists are best “equipped” - by way of temperament,
weapons, training - to cause the maximum number of fatalities. On the other hand, in
terms of “attack type”, North-Eastern terrorist groups, whose favoured mode of attack
was armed assault, were best placed to cause fatalities. That the number of fatalities
from terrorist incidents in the North-East of India was not still higher was due to
North-Eastern terrorist groups not possessing the “equipment” of Islamic terrorists:
many cases of armed assault in the North East involved traditional weapons like bows
and arrows or machetes. If terrorist groups in the North East were equipped to
Islamic terrorist standards, the fatality rate in the North East would be considerably
Conversely, Islamic groups did not engage in armed assault to the same degree
as the North-Eastern groups. If Islamic terrorist groups showed the same proclivity
towards armed assault as North-Eastern terrorist groups then, in consequence of their
superior “equipment”, fatality rates from terrorist incidents bearing an Islamic stamp
would rise sharply. The death toll from the Mumbai attacks of 26-29 November 2008
- when modern weaponry, meticulous planning, rigorous training were all harnessed
to a cold-blooded disregard for human life – might then be a precursor of further
carnage in the years to come.
Lastly, the paper then applied Atkinson’s (1970) concept of equality-adjusted
income to terrorism to arrive at the concept of equality-adjusted deaths from terrorist
incidents: in order to avoid spectacular incidents resulting in the loss of a large
number of lives – as in New York on September 11, 2001 and in Mumbai 26-29
November 2008 –“society”might be prepared to tolerate “low-grade” terrorism
which resulted in a larger number of deaths in total but avoided a large number of
References
Abadie, A., Gardeazabal, J. (2003), “The Economic Costs of Conflict”: a Case
Study for the Basque Country”, American Economic Review, vol. 93, pp. 113-32.
Blinder, A.S. (1973), “Wage Discrimination: Reduced Form and Structural
Estimates”, Journal of Human Resources, vol. 8, pp. 436-455.
Anand, S. and A. Sen (1997). Concepts of Human Development and Poverty:
A Multidimensional Perspective, Human Development Report 1997 Papers, New
York, UNDP.
Atkinson, A.B. (1970). “On the Measurement of Inequality.” Journal of
Economic Theory vol. 2, pp. 244-263.
Enders, W., Parise, G.F., and Sandler, T. (1992), “An Econometric Analysis of
the Impact of Terrorism on Tourism”, Kyklos, vol. 45, pp. 531-54.
Enders, W. and Sandler, T. (1996), “Terrorism and Foreign Direct Investment in
Greece and Spain”, Kyklos, vol. 49, pp. 331-52.
Frey, B.S. (2004), Dealing with Terrorism – Stick or Carrot?, Cheltenham:
Edward Elgar.
Haqqani, H. (2005), “Casting the Wrong Blame”, Wall Street Journal, July 22.
LaFree, G; Dugan, L; Fogg, H. V.; Scott, J., (2006) "Building a Global
Terrorism Database." NCJ 214260, United States Department of Justice, National
Institute of Justice, Apr 27, 2006.
(http://www.ncjrs.gov/pdffiles1/nij/grants/214260.pdf).
LaFree, G, and Dugan, L. (2008),. Global Terrorism Database II,
1998-2004 [Computer file]. ICPSR22600-v2. Ann Arbor, MI:
Inter-university Consortium for Political and Social Research [distributor],
Nitsch, V. and Schumacher, D. (2004), “Terrorism and international trade: an
empirical investigation”, European Journal of Political Economy, vol. 20, pp. 423-33.
Oaxaca, R. (1973), “Male-Female Wage Differentials in Urban Labor
Table 1: Terrorist Incidents in India by State: 1998-2004
State Number
of Incidents
Percentage of Total Incidents
Number of Fatalities
Percentage of Total Fatalities
Andhra Pradesh 48 6.12 90 2.99
Arunachal Pradesh 1 0.13 1 0.03
Assam 85 10.84 376 12.5
Bihar 26 3.32 156 5.2
Chandigarh 1 0.13 0 0
Chhattisgarh 2 0.26 21 0.70
Delhi 14 1.79 25 0.83
Goa 1 0.13 0 0
Gujarat 8 1.02 2 0.07
Himachal Pradesh 4 0.51 46 1.53
Jammu and Kashmir 480 61.22 1658 55.11
Jharkhand 11 1.40 86 2.89
Karnataka 2 0.26 0 0
Kerala 3 0.38 0 0
Madhya Pradesh 1 0.13 22 0.74
Maharashtra 14 1.79 93 3.09
Manipur 17 2.17 94 3.12
Meghalaya 1 0.13 12 0.40
Mizoram 1 0.13 8 0.27
Nagaland 1 0.13 12 0.40
Orissa 3 0.38 7 0.23
Punjab 4 0.51 10 0.33
Tamil Nadu 18 2.3 72 2.39
Tripura 25 3.19 179 9.95
Uttar Pradesh 4 0.51 23 0.76
Uttaranchal 1 0.13 2 0.07
West Bengal 5 0.64 11 0.37
Unknown 3 0.38 2 0.07
Total 784 100 3008 100
Table 2: Terrorist Incidents in India by Major Groups Responsible, 1998-2004
Group Number of Incidents Number of Fatalities
Al-Arifeen 1 6
Al-Badr 1 0
Al-Hamas Mujahideen 1 0
Al-Madina [LeT Front] 3 4
Al-Mansoorian 1 4
Al-Mansurian [LeT Front] 3 13
Al-Omar Mujahedin 2 13
Al-Shuda Brigade of Jammu and Kashmir 1 8
Harakat ul-Mujahidin 2 1
Harkatul Jihad-e-Islami 3 38
Hizb-ul-Mujahidin 34 173
Islamic Fateh 1 1
Islamic Militants 1 1
Jaish-e-Mohammad 11 39
Jamaat-ul Mujahideen 4 25
Kashmir Freedom Force 1 0
Lashkar-e Taiba 47 371
Save Kashmir 1 1
Save Kashmir Movement 2 9
Students Islamic Movement of India 4 63
Tehreek-ul-Mujahedeen 1 2
The Islamic Front 1 10
Total Islamic Groups 126 782
Marxist Groups
Bengali Tiger Force 1 2
Communist Party of India - Maoist (CPI-M) 2 4
Communist Party of India (Marxist Leninist) 1 6
Maoist Communist Center 14 98
Naxalites 8 31
People's Liberation Army 1 8
People's War Group 46 189
Porattom 1 0
Praveen Dalam 1 1
Total Marxist Groups 75 339
North-East Groups
All Tripura Tiger Force 6 56
Bodo Liberation Tigers 6 42
Dima Halao Daoga (DHD) 5 1
Kamtapur Liberation Organization 1 4
Kanglei Yawol Kanna Lup 2 8
Karbi National Volunteers 2 10
Kuki Liberation Army 1 0
Kuki Revolutionary Army 1 11
National Democratic Front of Bodoland 14 99
National Liberation Front of Tripura 21 140
National Socialist Council of Nagaland 1 10
United Liberation Front of Assam 36 165
United People's Democratic Solidarity 1 0
Table 3: Fatalities by Attack Type
Assault Type Number of Incidents Number of Fatalities Fatalities-to-Incidents
Bombings 378 1049 2.78
Armed Assault 298 1803 6.05
Assassination 52 85 1.63
Infrastructure Attack 35 45 1.29
Hostages 20 26 1.30
Unknown 1 0 0
Total 784 3008 3.84
Table 4: Fatalities by Terrorist Group
Groups Number of
Incidents
Number of Fatalities
Fatalities-to-Incidents
Islamic 126 782 6.21
Marxist 75 339 4.52
North-Eastern 97 546 5.63
Other Groups 87 210 2.41
Unknown 399 1131 2.83
[image:29.595.85.513.265.374.2]Table 5: Type of Terrorist Attack in India, 1998-2004
Group Armed
Assault
Bombing Other Total
Al-Arifeen 0 0 1 1
Al-Badr 0 1 0 1
Al-Hamas Mujahideen 0 0 1 1
Al-Madina [LeT Front] 0 0 3 3
Al-Mansoorian 0 1 0 1
Al-Mansurian [LeT Front] 1 1 1 3
Al-Omar Mujahedin 1 1 0 2
Al-Shuda Brigade of Jammu and Kashmir 0 1 0 1
Harakat ul-Mujahidin 1 0 1 2
Harkatul Jihad-e-Islami 2 1 0 3
Hizb-ul-Mujahidin 11 20 3 34
Islamic Fateh 0 1 0 1
Islamic Militants 0 1 0 1
Jaish-e-Mohammad 6 5 0 11
Jamaat-ul Mujahideen 2 2 0 4
Kashmir Freedom Force 0 0 1 1
Lashkar-e Taiba 27 13 7 47
Save Kashmir 0 0 1 1
Save Kashmir Movement 0 2 0 2
Students Islamic Movement of India 0 4 0 4
Tehreek-ul-Mujahedeen 1 0 0 1
The Islamic Front 0 1 0 1
Total Islamic Groups 52 55 19 126
Marxist Groups
Bengali Tiger Force 1 0 0 1
Communist Party of India - Maoist (CPI-M) 2 0 0 2
Communist Party of India (Marxist Leninist) 1 0 0 1
Maoist Communist Center 7 3 4 14
Naxalites 5 1 2 8
People's Liberation Army 1 0 0 1
People's War Group 9 23 14 46
Porattom 0 0 1 1
Praveen Dalam 0 0 1 1
Total Marxist Groups 26 27 22 75
North-East Groups
All Tripura Tiger Force 6 0 0 6
Bodo Liberation Tigers 4 1 1 6
Dima Halao Daoga (DHD) 0 0 5 5
Kamtapur Liberation Organization 1 0 0 1
Kanglei Yawol Kanna Lup 1 1 0 2
Karbi National Volunteers 2 0 0 2
Kuki Liberation Army 0 0 1 1
Kuki Revolutionary Army 1 0 0 1
National Democratic Front of Bodoland 9 4 1 14
National Liberation Front of Tripura 18 2 1 21
National Socialist Council of Nagaland 1 0 0 1
United Liberation Front of Assam 13 18 5 36
United People's Democratic Solidarity 0 1 0 1
Table 6:Regression Estimates, by Group, of the Number of Fatalities from Terrorist Attacks in India, 1998-2004
Type of Assault Coefficient Estimate t-value
Intercept 1.111 1.50
Islamic groups 2.065 1.37
Marxist groups 0.508 0.36
North-Eastern groups -0.540 -0.33
Bombing 0.743 0.91
Islamic bombing 1.772 1.04
Marxist bombing 3.601 2.03
North-East bombing 2.130 1.08
Armed Assault 3.791 4.45
Islamic armed assault 1.014 0.58
Marxist armed assault 0.129 0.07
North-East armed assault 3.584 1.96
772 observations, 1998-2004
Table 7: Number of Fatalities by Terrorist Group and Attack Type
Residual Group
Islamic Groups
Marxist Groups
North-Eastern Groups
Bombing 1.85 5.69 5.96 3.44
Armed assault 4.90 7.98 5.54 7.94
[image:31.595.99.498.365.444.2]Table 8
The Decomposition of Fatality Rates by Terrorist Group:
“Blinder-Oaxaca” Method
Sample Average
Group s treated as group r Group r treated as group s
Fr - Fs Attack Type Difference*
Residual Attack Type Difference**
Residual
r=Islamic
s=Marxist
6.21 – 4.52 = 1.69
6.21 – 5.75 = 0.46
5.75 – 4.52 = 1.23
5.19 – 4.52 = 0.67
6.21 - 5.19 = 1.02
r=Islamic
s=North Eastern
6.21 – 5.63 = 0.58
6.21 – 6.65 =-0.44
6.65 – 5.63 = 1.02
4.95 – 5.63 = -0.68
6.21 – 4.95 = 1.26
r =North-Eastern
s=Marxist
5.63 – 4.52 = 1.11
5.63 – 4.95 = 0.68
4.95 – 4.52 = 0.43
5.09 – 4.52 = 0.57
5.63 – 5.09 = 0.54
Fr and Fs are the average number of fatalities (fatality rates) from terrorist incidents for which group r and group s were, respectively, responsible.
*
Attack type difference: holding “equipment” constant at group r levels, this difference represents the inter-group difference in fatality rates due to differences between the two groups, r and s, in their attack types.
**
Attack type difference: holding “equipment” constant at group s levels, this difference represents the inter-group difference in fatality rates due to differences between the two groups, r and s, in their attack types.
Table 9: Gini Coefficients by Terrorist Group and Type Attack Armed Attack Incidents Bombing Incidents Maximum Deaths from Armed Assault Incident Maximum Deaths from Bombing Incident
Islamic 0.534 0.729 52 35
Marxist 0.538 0.607 26 32
[image:32.595.85.512.399.495.2]Table 10: Equally Distributed Equivalent Number of Deaths and Fatality Rates for Terrorist Groups in India: Armed Assault and Bombing
Armed assault Bombing
Islamic Marxist
North-East
Islamic Marxist North-East
Number of Incidents 53* 26 56 56* 27 27
Number of Deaths 415 144 445 313 161 93
Deaths per Incident: Fatality Rate
7.98 5.54 7.95 5.69 5.96 3.44
Inequality Aversion:
=0.25
Equally distributed equivalent (ede) number of deaths
466 163 468 396 187 108
Equally distributed equivalent (ede) fatality rate
8.96 6.27 8.36 7.20 6.93 4.00
Inequality Aversion:
=0.5
Equally distributed equivalent (ede) number of deaths
516 182 491 478 209 122
Equally distributed equivalent (ede) fatality rate
9.92 7.00 8.77 8.69 7.74 4.52
Inequality Aversion:
=0.75
Equally distributed equivalent (ede) number of deaths
563 202 513 560 230 133
Equally distributed equivalent (ede) fatality rate
10.82 7.77 9.16 10.18 8.52 4.93
Inequality Aversion:
=1.0
Equally distributed equivalent (ede) number of deaths
608 222 535 640 248 143
Equally distributed equivalent (ede) fatality rate
11.69 8.54 9.55 11.64 9.19 5.30
Figure 1
The Distribution-Sensitive Fatality Rate F2
Q
R A
T
450
Technical Appendix
Derivation of the attack-type/attack-group interaction equation
Define the variables I Mj, j, and Nj to take the value 1 if incident j was caused
by, respectively, Islamic, Marxist, or North-Easter groups, and the value 0 otherwise.
Then the regression equation estimated over M terrorist incidents, j=1…M, was:
( ) ( _ )
( ) ( _ )
( ) ( _ )
( ) ( _ )
j B j A j
B j j A j j
B j j A j j
B j j A j j
Fatalities bombing armed assault
bombing I armed assault I
bombing M armed assault M
bombing N armed assault N
The coefficients B and A in the above equation are the fatalities associated
with bombings and armed assault, respectively, when a
non-Islamic/Marxist/North-Eastern group was responsible for the incident; theB and A are the additional
fatalities associated with bombings and armed assault, respectively, when an Islamic
group was responsible for the incident; theB and A are the additional fatalities
associated with bombings and armed assault, respectively, when a Marxist group was
responsible for the incident; and theB and A are the additional fatalities associated
with bombings and armed assault, respectively, when a North-Eastern group was
responsible for the incident.
Derivation of the Blinder-Oaxaca decomposition as applied to
terrorism
There are K incidents (indexed, k=1…K) of which KI are by Islamic groups,
KM by Marxists, and KN by North-Eastern groups. j=I (Islamic), M (Marxist.), j=N
(North-East). Let j
ksj, 1...
s X s S
X represents the vector of observations, for
that incident, and let ˆj
j, 1...
s s S
β represent the associated vector of coefficient
estimates for persons from group j.
Then the average number of fatalities from terrorist incidents for which group
j was responsible, j=I, M, N, is:
1
1 1
ˆ , ,
j K S
j j j
j ks s k s
Y K X j I M N
So that: 1 11 1 1 1
1 1
1 1 1 1
1 1
1 1 1
ˆ ˆ
ˆ ˆ (A)
ˆ ˆ
I M
I M
M
K S K S
I M I I M M
I ks s M ks s k s k s
K S K S
I I M I I ks s M ks s
k s k s
K S S
M I M M M ks s M ks s
k s k s
Y Y K X K X
K X K X
K X K X
1 (B) M K
Alternatively: 1 11 1 1 1
1 1
1 1 1 1
1 1
1 1 1
ˆ ˆ
ˆ ˆ (C)
ˆ ˆ
I M
I M
I
K S K S
I M I I M M
I ks s M ks s k s k s
K S K S
I M M M I ks s M ks s
k s k s
K S S
I I I M I ks s I ks s
k s k s
Y Y K X K X
K X K X
K X K X
1 (D) M K
The term (A), above, represents the attack type difference when Marxist attack
types are evaluated at Islamic equipment; the term (C) represents the attack type
difference when Islamic attack types are evaluated at Marxist equipment. The terms
(B) and (D) are the residual terms. By definition, I M
Y Y A B C D.
However, this does not imply that A=C and B=D: that is, it does not imply that the
size of the attribute (“attack type”) and coefficient (“residual”) effects are invariant to