Ecology, trade and states in pre-colonial
Africa
Fenske, James
University of Oxford, Department of Economics
December 2010
Online at
https://mpra.ub.uni-muenchen.de/29202/
JAMES FENSKE†
ABSTRACT. I test Bates’ view that trade across ecological divides promoted the develop-ment of states in pre-colonial Africa. My main result is that sub-Saharan societies in ecologically diverse environments had more centralized pre-colonial states. I use spa-tial variation in rainfall to control for possible endogeneity. I construct artificial societies and present narrative evidence to show the results are not due to conquest of trading re-gions. I also test mechanisms by which trade may have caused states, and find that trade supported class stratification between rulers and ruled.
1. INTRODUCTION
The states that existed in Africa before colonial rule continue to shape its modern de-velopment. Pre-colonial state centralization is positively correlated with modern cross-country differences in school attainment, literacy, paved roads and immunizations (Gen-naioli and Rainer, 2007). It better predicts nighttime lights today than country-level institutional quality (Michalopoulos and Papaioannou, 2010). The few modern states in Africa that inherited the legitimacy of a pre-colonial predecessor have done better (Englebert, 2000). The parts of French West Africa with more centralized states before colonial rule better resisted French settlement, but these same areas received less in-vestment during the colonial period (Huillery, 2008). These recent empirical findings are in line with those of historians and political scientists, who have argued that alien rulers had to take African systems as given and build upon them during the colonial pe-riod (Austin, 2008b; Berry, 1992; Mamdani, 1996). In other contexts, economists have similarly found that the long historical roots of modern states are relevant for modern development (Banerjee and Iyer, 2005; Bockstette et al., 2002; Iyer, 2007). Explaining pre-colonial states, then, is necessary for understanding modern Africa.
In this paper, I test a “Ricardian” view of sub-Saharan states presented by Bates (1983), in his Essays on the political economy of rural Africa. He builds on earlier arguments made by Oliver and Fage (1962) and Vansina (1966), among others, who argued that
†DEPARTMENT OFECONOMICS, UNIVERSITY OFOXFORD
E-mail address:james.fenske@economics.ox.ac.uk.
Date: February 28, 2011.
I am grateful to Achyuta Adhvaryu, Robert Bates, Prashant Bharadwaj, Timothy Guinnane, Namrata Kala, Elias Papaioannou, Aloysius Siow and Christopher Udry for their comments. I am also thankful for the feedback I have received from seminars at the University of Oxford, Hebrew University, and Tel Aviv Uni-versity.
TABLE1. Bates’ Evidence
[Table 1 here]
long-distance trade required centralized authorities for administrative purposes, dif-fused concepts of centralized polities, and stimulated territorial expansion (Bisson, 1982). His model is verbal:
One of the basic arguments linking political centralization with economic reward rests upon the desire of people to benefit from the gains in welfare which can be reaped from markets. In essence, the argument is Ricar-dian... the contribution of the state is to provide order and peace and thereby to render production and exchange possible for members of so-ciety. The origins of the state, then, lie in the welfare gains that can be reaped through the promotion of markets.
He suggests that gains from trade are greatest where products from one ecological zone can be traded for products from another. It is near ecological divides, then, that we should expect to see states. To support his view, he takes 34 pre-colonial African so-cieties, asks whether they “abut an ecological divide,” and classifies them as having a “kinship” political structure, “chiefs,” or “central monarchs.” I present a condensed ver-sion of his results in Table 1. The proportion of societies with central monarchs is greater on an ecological divide.
In this paper, I argue that Bates (1983) is ultimately correct. His argument has been overlooked because his sample size prevents him making a credible econometric argu-ment that this correlation is causal. In this paper, I use ethnographic and geographic data to overcome this limitation. I take data on state centralization for 440 societies in pre-colonial sub-Saharan Africa from Murdock’s (1967)Ethnographic Atlas. Merging the map of African ethnic groups from Murdock (1959) with information on African eco-logical zones from White (1983), I am able to compute for each society an index of its “ecological diversity,” which I take as a proxy for the gains from trade that existed before colonial rule. I show that this index is strongly related to the presence of pre-colonial states. I use spatial variation in rainfall to control for possible reverse causation, and show that the OLS estimates of the impact of ecological diversity are not overstated. I also use exogenous geographic features to predict raster-level ecological regions, and find that the diversity measured by these predicted points is also related to pre-colonial African states. The relationship between trade and states is robust to several additional controls, removing influential observations, alternative measures of states and trade, and a variety of estimation strategies.
available for these ethnic groups, I am not able to conclusively show that societies that independently developed state centralization did not migrate to capture the regions in which the gains from trade were high. In order to argue that this does not explain my results, I construct artificial societies and present narrative evidence on the histories of the most influential observations in the data. By adding similar controls, I am able to show that two other stories – dense population in diverse regions and defense of “is-lands” of land quality – do not explain away the relationship between trade and states. Fifth, I show that the diversity of grains available for cultivation do not explain away the main results. Sixth, while diverse areas are more ethnically fractionalized, ecology directly impacts states even when this is included in the sample of artificial countries. I test for several mechanisms by which trade may have facilitated state centralization, and find that class stratification is the channel best supported by the data. No one type of trade is shown to be more important than others.
The Ricardian view is only one of many theories of the long-run geographic origins of strong states. It is not my aim, however, to test the Ricardian view against these except insofar as they may also explain the observed link between states and ecological di-versity. Diamond (1997) argues that Eurasian endowments of domesticable plants and animals, combined with an East-West orientation that facilitated their diffusion, gave that landmass an early advantage over the Americas and Africa. Jones (2003) makes an argument for Europe that is remarkably similar to the Ricardian view, stating that:
In Europe’s case, the most relevant aspect of the resource endowment was probably the way it was dispersed across a geologically and climatically varied continent, since this provided an inducement to trade (p. xxxii).
Specifically, he suggests that the gains from bulk, low value trade encouraged rulers to gain their revenues through taxation of protected trade, rather than the arbitrary confis-cations that would be possible with trade in luxuries (p. 89). Olson (1993), by contrast, suggests that above the level of hunter-gatherers, most societies have some vestige of a state because it is in the interests of “roving” bandits to establish themselves as ruling “stationary” bandits and encourage economic activity that they can tax. In this light, my study highlights a geographic condition that makes this possible through trade. States are only one of many imperfect ways to govern the market (Dixit, 2004), and this study then draws attention to one condition under which they emerge. There are also reasons why we might expect ecological homogeneity to facilitate trade and states. Societies that can only produce a narrow range of goods may be compelled to trade. Moav and Mayshar (2011) suggest that the homogeneity of ancient Egypt benefitted that state’s centralization, compared with Israel and Babylon. Because all farmers depended on the Nile flood, which could be easily monitored, the state was uniquely able to tax them effectively.
it is not the purpose of this paper to test between these hypotheses unless they are al-ternative explanations of the relationship between ecological diversity and states. First, the “land-abundance” view (Austin, 2008a; Herbst, 2000) of Africa argues that the rel-ative absence of large states in pre-colonial Africa was the result of sparse population. Unable to tax land, which had little value, African states had to rely on trade taxes for revenue. This is to be understood in contrast with the view of Tilly and Ardant (1975), who argue that it was the need to secure and defend territory that gave rise to modern nation states in Europe. I show in this paper that, even controlling for population den-sity, gains from trade allowed states to exist in Africa. Second, contributions by Nunn (2008) and Robinson (2002) have built on older views, such as those of Rodney (1972), and argued that the slave trade and colonial rule undermined institutional development in Africa, including state centralization. I show that the relationship between states and ecology is robust to measures of access to the transatlantic slave trade.
In the remainder of this paper, I proceed as follows. In section 2, I describe my sources of data, how I measure state centralization, and how I compute ecological diversity for each society. In section 3, I outline the principal econometric specification and the baseline results. In section 4, I demonstrate the robustness of these results to endo-geneity, unobserved heteroendo-geneity, influential observations, and alternative measures of trade and states. In section 5, I give evidence that five alternative stories – area ne-cessitates centralization, states migrate to capture gains from trade, states emerge to protect “islands” of land quality in otherwise barren regions, ecological diversity prox-ies for population density, and ecological diversity produces ethnic diversity – do not explain the results. In section 6, I present suggestive evidence that centralized states emerged from trade because it supported class differentiation, and that no one type of trade mattered most. In section 7, I conclude.
2. DATA
In order to test the Ricardian theory of African states empirically, I need data on three things – African states, the gains from trade, and other variables whose omission could potentially bias the results. In this section I describe my sources of for each.
To measure African states, I take data from Murdock’s (1967)Ethnographic Atlas. This was originally published in 29 issues ofEthnology between 1962 and 1980. It contains data on 1267 societies from around the world.1
From this source, I use variable 33, “Ju-risdictional Hierarchy Beyond Local Community” to measure state centralization. This gives a discrete categorization between “No Levels” and “Four Levels.” This is the same
1In particular, I use the revised Atlas posted online by J. Patrick Gray at
FIGURE1. State centralization
Source:(Murdock, 1967). Darker regions have more centralized states.
variable that was used by Michalopoulos and Papaioannou (2010), and originally verted by Gennaioli and Rainer (2007) into a discrete variable to capture the same con-cept.2
The sample used for the analysis consists of the 440 sub-Saharan societies, in-cluding Madagascar, for which this variable is not missing. I map this measure of state centralization on Murdock’s (1959) ethnic map of Africa in Figure 1.3
To measure the gains from trade, I follow Bates (1983) in assuming that the ability to trade across ecological zones will be particularly beneficial. To get information on ecology, I use White’s (1983) vegetation map of Africa.4
This classifies African vegetation into 17 major types, which I plot in Figure 2.5
2In particular, they took a society as “centralized” if it had at least one level of jurisdiction above the local,
and weighted this by each society’s share in the national population in 1960 to construct a country-level measure of pre-colonial state centralization in Africa.
3This map is available on Nathan Nunn’s website.
4This is available at http://www.grid.unep.ch/data/download/gnv031.zip.
5Altimontaine, anthropic, azonal, bushland and thicket, bushland and thicket mosaic, cape shrubland,
FIGURE2. Vegetation types and ecological diversity
Source:White (1983). In the left-hand map of vegetation types, each shade of grey represents a different one of each of the sixteen major types. In the right-hand side map of ecological diversity, darker regions are more ecologically diverse
To construct a measure of how location relative to these regions could give rise to gains from trade, I calculate the sharest
iof each societyi’s area that is occupied by each
ecological typet. Then, I use a Herfindahl index to construct a measure of each society’s ecological diversity:
(1) Ecological diversityi = 1−
t=17
X
t=1
(st i)
2
.
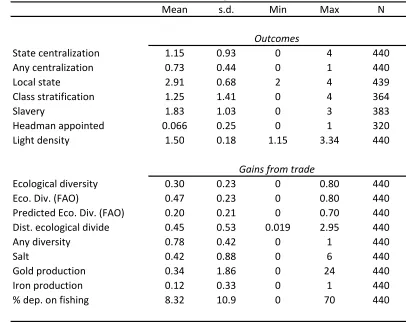
TABLE2. Summary statistics
[Table 2 here]
It is possible that, even if there is a strong correlation between ecological diversity and state centralization, this is due to omitted variables correlated with the diversity index. I am able to join several other geographic variables to the data on ecology and states using the Murdock (1959) map of Africa. Except where I note otherwise, I take data stored in raster format, and for each society I compute the average value of the points within its territory.6 In particular, I control for:
Major river: This is a dummy that equals one if the Benue, Blue Nile, Chire, Congo, Lualaba, Lukaga, Niger, Nile, Orange, Ubangi, White Nile, or Zambezi Rivers inter-sect the ethnic group’s territory.
Ag. constraints: This is an index of combined climate, soil and terrain slope con-strains on rain-fed agriculture, taken from the FAO-GAEZ project (see Fischer et al. (2001)). I interpret it as an inverse measure of land quality.
Dist. coast: This is average distance from each point in the ethnic group territory to the nearest point on the coast, in decimal degrees, calculated in ArcMap.
Elevation: This is average elevation in meters.
Malaria: This is average climatic suitability for malaria transmission, computed by Adjuik et al. (1998).
Precipitation: This is average annual precipitation (mm). Because some societies are too small for a raster point to fall within their territory, I impute missing data using the nearest raster point.
Ruggedness: This is a measure of terrain ruggedness used by Nunn and Puga (2009). It computes the average absolute difference between an elevation grid cell and its neighbors.
Temperature: This is the accumulated temperature on days with mean daily tem-perature above 0◦C, computed using monthly data from 1961 to 2000 collected by
the Climate Research Unit (CRU) of the University of East Anglia. I treat 55537 is as an error code and drop these points. I impute missing values using the nearest raster point.
Dist. L. Victoria: I compute the distance between each ethnic group’s centroid and Lake Victoria using the globdist function in Stata.
6Raster data taken from the following sources: Ag. Constraints, http://www.iiasa.ac.at/Research/
TABLE3. Summary statistics
[Table 3 here]
Date observed: This is the rough date at which the information on the society was recorded, according to the Ethnographic Atlas. Dates of observation are missing for the Bomvana and Betsileo. I recode the Bomvana to 1850, to match the date of observation for the other Xhosa. I recode the Betsileo to 1900, the modal date for the other Malagasy societies in the data.
Dist. Atlantic ST: This is the minimum distance between the ethnic group’s centroid and the nearest major source of new world demand for slaves (Virginia, Havana, Haiti, Kingston, Dominica, Martinique, Guyana, Salvador, or Rio), computed using the globdist function in Stata. The choice of ports here follows Nunn (2008).
Dist. Indian ST: This is, similarly, the distance to the nearest of Mauritius and Mus-cat.
Dist Saharan ST: This is the minimum distance to Algiers, Tunis, Tripoli, Benghazi, or Cairo.
Dist Red ST: This is the minimum distance to Mussawa, Suakin, or Djibouti.
Crop type: I construct dummy variables out of the major crop types recorded in the
Ethnographic Atlas. I treat these as exogenous characteristics of the natural envi-ronment, not as choices.
Summary statistics for these controls and any other variables used in the later analysis are given in Table 3. It is clear that the greatest difficulty with these data are that they are anachronistic – the institutional variables are recorded at an earlier date than the geographic controls and the measure of ecological diversity. Insofar as broad differences across regions in their capacities for rainfed agriculture, terrain ruggedness, ecological regions and similar variables do not change much, this should only add measurement error to the analysis. It is possible, however, that states transform their environments in ways that state societies cannot. I use both instrumental variables and non-anthropogenic predictors of ecological types in Section 4 to address this concern.
3. RESULTS
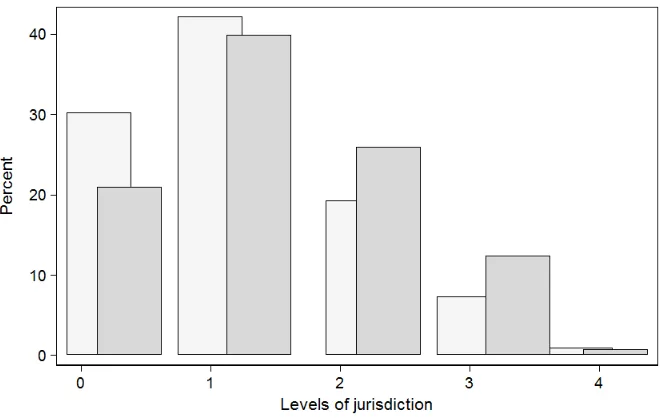
FIGURE3. State centralization when ecological diversity is above and
be-low the median
The dark bars are for ecological diversity above the median, the light bars for ecological diversity below it. Percentage is on the y axis and levels of jurisdiction on the x axis.
the median, it is quite uncommon for societies to have four such levels. The general pat-tern is clear; as ecological variation rises, the distribution of state centralization skews to the right.
To test econometrically whether there the gains from trade due to ecological diversity predict the existence of centralized states in pre-colonial Africa, I estimate the following using an ordered probit:
(2) State centralizationi =α+βEcological diversityi+Xi′γ+ǫi.
In (2), state centralization is the number of levels of jurisdiction recorded by the Ethno-graphic Atlas. Ecological diversity is the index defined above. The matrixXiincludes the
other controls reported listed in section 2, as well as (in some specifications) dummy variables for the thirteen ethnographic regions recorded in the sample.7 Standard er-rors are clustered by region.
Table 4 presents the resulting estimates of β. I report the full set of coefficient es-timates in Table 19 in the appendix, omitting them in the text for space. In column 1, only the measure of ecological diversity is included. Ecological diversity has a significant
7These are: African Hunters, South African Bantu, Central Bantu, Northeast Bantu, Equatorial Bantu,
[image:10.612.144.475.113.323.2]TABLE4. Main results
[Table 4 here]
and positive correlation with state centralization. This is robust to the inclusion of ad-ditional controls in column 2, and the coefficient does not fall by much. While regional dummies do knock away some of the magnitude of the coefficient estimate, it remains significant at the 10% level. Surprisingly, few of the additional controls are statistically significant. The exceptions are elevation (positive in column 3), date of observation (negative in both columns), no major crop (negative in column 2), roots and tubers (positive in columns 2 and 3), major river (positive in columns 2 and 3), and rugged-ness (positive in both columns). The positive effect of elevation is likely capturing ben-efits associated with mountainous regions, such as defensibility, less susceptibility to disease, and soil fertility. The negative effect of the date of observation likely suggests that colonial-era anthropologists chose to first study the least remote and most central-ized African societies – the low hanging academic fruit. The negative effect of no major crop suggests that it is difficult to form a state without an agrarian base of any sort. The positive effect of roots and tubers is a surprise, and is likely proxying for unobservable features of forest-zone Bantu societies that better enabled them to create states. Major rivers are associated with trade, and further suggest that the Ricardian view of African states is largely correct. Ruggedness will be related to defensibility. Following Nunn and Puga (2009), it also predicts the ability of African societies to have escaped the worst effects of the slave trades.
FIGURE4. Kernel density of ecological diversity
4. ROBUSTNESS
4.1. Validity of the state centralization measure. The measure of state centralization I use is far from ideal. One deficiency is that weak but pyramidal states will appear to be centralized in this data. The Bemba, as an example, have two levels of jurisdiction above the local. I would like to replicate these results with alternative measures of state strength. I am not, however, aware of any similar measure available for more than a small sub-sample of the ethnic groups in my data. Instead, I take two other approaches to validate the state centralization measure.
First, I show that it is strongly correlated with other measures of states for which I have data in other samples. Bockstette et al. (2002) and Chanda and Putterman (2007) construct indices of “state antiquity” for modern countries that reflect, in a given fifty year period, a) the existence of a government, b) the proportion of the modern coun-try’s territory covered, and c) whether the state was indigenous or externally imposed. I take this measure for the period 1850-1900 as a measure of state strength from roughly the same period as the centralization index. Gennaioli and Rainer (2007) aggregate the state centralization index to the country level using ethnic groups’ population shares reported in theAtlas Narodov Mira. For 41 countries, I have both of the antiquity and centralization measures. In Figure 5, I show that there is a positive correlation between country-level centralization and state antiquity in the late nineteenth century.
FIGURE5. State antiquity and state centralization
State centralization is the country-level measure of Gennaioli and Rainer (2007). State antiquity is the variable “aosnew2,” covering the period 1851-1900, based on Bockstette et al. (2002), and available on Louis Putterman’s website. The regression coefficient is 15.096, and the standard error is 4.970. There are 41 observations.
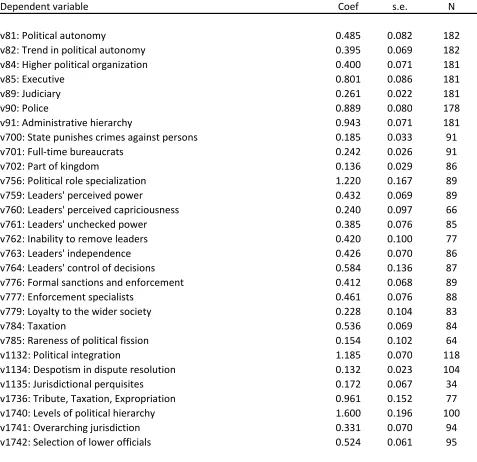
TABLE 5. Robustness: Regressions of alternative SCCS measures of states
on state centralization
[Table 5 here]
TABLE6. Robustness: Alternative measures of states and diversity
[Table 6 here]
from sub-Saharan Africa. I can, however, show that the centralization measure I use is strongly correlated with the other measures of states coded in the SCCS.8
For nearly thirty variables from the SCCS that capture ordinal measures of various aspects of state strength, I regress the variable on my measure of state centralization and report the re-sults in Table 5. All of these are significantly related to state centralization, whether they measure the existence of a police force, the presence of taxation, or the capacity of states to enforce their decrees. The measure used in this study, then, is a valid proxy for state strength.
Second, I recode the state centralization measure into a dummy that equals one if the society has any levels of jurisdiction above the local. This may better capture state strength if, for example, it is impossible for a central authority to delegate administrative functions to regional leaders without also losing some control over them. I show in Table 6 that this measure is also positively related to ecological diversity.
TABLE7. Robustness: Estimation methods
4.2. Validity of the gains from trade measure. While ecological variation captures to some degree the presence of gains from trade, it is not clear that it is the best measure available. Bates (1983) divides societies into those that abut a divide, those that are di-verse, and those that have no significant variation. As an alternative measure of the gains from trade, I use the White (1983) map to compute the average distance (in deci-mal degrees) of all points in a group’s territory from the nearest boundary between two ecological regions. I present the results in Table 6. The statistical robustness of these results is stronger than the results obtained using ecological diversity. The results are consistent with a one standard deviation increase in the distance from an ecological di-vide raising the probability of having no levels of jurisdiction above the local by roughly 5 percentage points, with this increase coming from reductions in the probabilities that a society would have two or three levels of jurisdiction. Results using a binary indica-tor for whether the society is diverse at all (equivalent to whether it is intersected by a divide) are similar. Finally, because some of the ecological types recorded in White’s map are similar, potentially leading to over-estimation of ecological diversity, I collapse these classifications into eight “simpler” types.9
Results are again similar, though the ef-fect of ecological diversity becomes marginally insignificant when regional fixed efef-fects are added. Simplifying the classes in this manner does not do away with the sharply bi-modal distribution of diversity.
In addition, the FAO-GAEZ project created its own separate classification of ecologi-cal zones that can be used to construct an alternative diversity measure.10
This source categorizes raster points in Africa into eleven “dominant ecosystem classes.”11
For each ethnic group in the data, I construct a measure analogous to that in (1) using the share of raster points for each ecosystem class, rather than the share of area. Results using this alternative measure of ecological diversity are presented in Table 6. As with the distance from an ecological divide, the coefficient estimates here are more statistically robust than main results.
4.3. Validity of the estimation. There are many possible reasons the approach taken to the estimation may be questioned. First, the “parallel regression” assumption of the standard ordered probit model, that the explanatory variables have the same impact on
9Mountain if altimontane, other if anthropic, water or azonal, bushland if bushland and thicket or
bush-land and thicket mosaics, shrub if cape shrubbush-land, transitional scrubbush-land or grassy shrubbush-land, desert if desert or semi-desert, grassland if grassland, secondary wooded grassland or edaphic grassland mosaics, forest if forest or forest transitions and mosaics, and woodland if woodland or woodland mosaics and transitions.
10This is plate 55, downloaded from http://www.iiasa.ac.at/Research/LUC/GAEZ/index.htm.
11These are Undefined; Grassland; Woodland; Forest; Mosaics including crops; Cropland; Intensive
TABLE8. Robustness: Influential observations
[Table 8 here]
the latent index at all points, is often violated in real data. In Table 7, I re-estimate the main results using a generalized ordered probit model (Maddala, 1986), in which the co-efficients on the latent variables are allowed to vary with the points where the categories of the dependent variable are separated. Convergence could not be achieved with re-gional fixed effects, so this specification is not reported. As before, ecological diversity predicts greater state centralization. Here, it is clear that this effect is not confined to any single level of centralization. Excepting at four levels, for which few observations exist, the effect is positive throughout.
Another potential concern is that, with only 440 observations in most specifications and thirteen regions, the clusters used for the standard errors may be too small. I have re-defined alternative clusters corresponding roughly to the United Nations’ division of Africa into regions – Southern Africa (African Hunters, South African Bantu), Western Africa (Guinea Coast, Western Sudan, Nigerian Plateau, Moslem Sudan), Central Africa (Central Bantu, Equatorial Bantu, Eastern Sudan) and Eastern Africa (Northeast Bantu, Upper Nile, Ethiopia/Horn, Indian Ocean). Re-estimating the main results, I show in Table 7 that the results are now more statistically robust. The coefficient estimate falls less with the addition of these broader fixed effects than with fixed effects added for the regions as defined in theEthnographic Atlas.
Finally, the inclusion of the major river dummy and distances from the coast, Lake Victoria, and slave trade ports may be capturing elements of trade based on features other than ecological diversity. Similarly, while the inclusion of the date of observation is intended to control for both remoteness and the possible impacts of European in-fluence, it may be endogenous to state centralization. I show in Table 7 that excluding these variables barely affects the results.
TABLE9. Robustness: Reverse causation
[Table 9 here]
effects. It is not the contrast between a handful of states and their neighbors that is driving the results.
4.4. Possible reverse causation. It is also possible that stronger states shape the en-vironment; McCann (1999) describes, for example, the careful regulation of forest re-sources in Ethiopia before the twentieth century. To control for this possible reverse causation, I employ the standard deviation of temperature within an ethnic group’s ter-ritory as an instrument for its Ecological diversity. This is intended to capture varia-tion in ecological condivaria-tions that are beyond human control, and which give rise to dif-ferences in actual vegetation. The disadvantage of this instrument is that it cannot be computed for societies so small that they have only one raster point for temperature, or whose temperature measure was imputed from a nearest neighbor. I present the results in Table 9. In columns 1 through 3, I replicate the main results from Table 4 using OLS, for comparability with the other columns. In columns 4 through 6, I repeat the analysis, but restrict the sample to societies for which the instrument is available. The coefficient estimates are roughly similar, suggesting that selection into non-missing observations of temperature variance will not drive the results. In columns 7 through 9, I present the IV results. I also present the Kleibergen-Paap Lagrange multiplier and F statistics. While these are less statistically robust than the OLS results, the coefficients grow larger. There is no evidence that the ordered probit estimates overstate the effect of ecologi-cal diversity on state centralization. This argument is analogous to Frankel and Romer (1999), who instrument for trade openness using using geographical features in a cross-country setting and find that, while their effects are statistically insignificant, there is no evidence that OLS overstates the causal effect of trade on growth.
I am also able to use the FAO classifications to construct an alternative measure of ecological diversity that is not endogenous to human action. For each of the 365,788 raster points in that data, I regress an indicator for each of the eleven ecosystem classes on deciles in latitude, longitude, average precipitation, distance from the coast, accu-mulated temperatures above five and ten degrees, ruggedness, length of the growing period, and terrain slope, as well as dummies for each type of thermal growing period, frost-free period, and soil class.12From each of these linear regressions, I take the linear prediction as the probability that the raster point falls into that ecosystem type. I take the most probable class as the predicted type, and I am able to correctly predict a bit
12All of these are downloaded from the FAO-GAEZ website, calculated in ArcMap, or already described
FIGURE6. Kernel density of predicted ecological diversity (FAO)
TABLE10. Robustness: Reverse causation
[Table 10 here]
more than 70% of the raster points by this method. I re-calculate the diversity index us-ing these predicted types. The results usus-ing this as a diversity measure are presented in Table 9. I continue to find that this predicts state centralization, except when regional fixed effects are included. This degree of robustness is surprising; because this method is particularly bad at predicting raster points in the less common ecological types, it under-predicts ecological diversity (see the kernel density in Figure 6). This further sug-gests the results are not due to strong states transforming their landscapes.
4.5. Possible omitted heterogeneity. As with any cross-sectional analysis, one of the most pernicious concerns is that the results are driven by unobservables that happen to be correlated with the causal variable of interest – in this case ecological diversity. While I have included an index of ecological diversity constructed from the area shares
st
iof each ecological type for each ethnic group, I have not generally controlled for these
directly. This is primarily for statistical power. These may, however, be significant de-terminants of states and correlated with ecological diversity. In Table 10 I add these as additional controls. The estimated effect of diversity is now larger, and more statistically robust.
[image:17.612.142.475.98.320.2]are robust to including this, though they become insignificant when region fixed effects are also included. This is not surprising, since this leaves little variation in the data to provide identification.
In Table 10, I also account for omitted heterogeneity by estimating the main re-sults using a spatial error model. This replaces the vector of errors in (2) with a spatially-weighted vectorλW ǫ, and a vector of iid errors,u.Wis a row-normalized spatial weights matrix. I selectW so that all societies whose centroids are within ten decimal degrees of each other are given a weight inversely proportionate to their distance from each other. I report the results in Table 10.13 The effect of ecological diversity remains sta-tistically significant before fixed effects are included, though the estimated coefficients are smaller than in Table 9. Once additional controls are added, I find no evidence that
λ is statistically significant. This may be because neighbors’ observables fully explain correlations in states across space. In Table 10 I add the observableX of each society’s neighbors, weighted by the matrixW. While these are strongly significant – neighbors’ characteristics matter – a Moran’s I test conducted on the residuals suggests that there is no spatial correlation conditional on these.
In Section 5, I attempt to deal with specific unobservables that are related to alterna-tive interpretations of the data.
Finally, I take three more general approaches to deal with unobservables. First, I use the strategy suggested by Wooldridge (2002) for testing robustness to unobserved heterogeneity. I de-mean all of the standard controls included in Table 4, and interact them with my ecological diversity measure. A similar approach is used by Bhalotra and Cochrane (2010), for example. Results are reported in Table 10. I find that, while some of these interactions are significant, they do little to diminish the main result, suggesting that it cannot be explained away by heterogeneous treatment effects once controls are added.
Second, I employ a nearest neighbor matching estimator in order to shift the bulk of identifying variation to those observations that are most similar along their observ-ables.14 Because these estimators consider a binary “treatment,” I divide the sample into observations above and below the median in ecological diversity. Results are given in Table 10. The main results look qualitatively similar using this measure of ecological diversity. If observations are matched using their observable controls (column 4), the difference in state centralization between “treated” and “untreated” societies (the aver-age treatment effect) remains statistically significant and is similar in magnitude to the comparable regression in column 2.
Third, I compute Altonji-Elder-Taber statistics. Replicating the main regression us-ing OLS, I obtain the estimated coefficient on ecological diversityβˆ1 and the estimated
variance of the residuals Vˆ1. Regressing state centralization on the controls, I obtain
FIGURE7. Ecological diversity and state centralization for artificial
coun-tries
Source: Murdock (1967) and White (1983). In the left-hand map of ecological diversity, darker regions are more diverse. In the right-hand map of state centralization, darker regions are more centralized.
the predicted valuesxband the estimated variance of the residualsVˆ2. Regressing
eco-logical diversity onxb, I obtain the coefficient estimateβˆ2. Altonji et al. (2005) suggest
that if βˆ1Vˆ2
ˆ
β2Vˆ1 > 1, it is unlikely that unobservables will explain away the result of interest.
The estimates reported, 4.51 if fixed effects are not included and 3.08 if they are, do not support selection on the unobservables.
5. ALTERNATIVE STORIES
The results presented so far are not, however, completely dispositive. They are consis-tent with at least five alternative stories of the relationship between ecology, trade and states in pre-colonial Africa. In the remainder of this section, I give evidence that the Ricardian view of African states better fits the data.
5.1. Larger areas are more diverse and require more centralized administration. It is possible that, if administering a larger area requires more levels of administration, states that happen to cover greater territories for reasons unrelated to their strength will appear more centralized in the data. Further, larger areas may be mechanically more likely to be ecologically diverse. Conversely, there is the “territorial expansion model” of Spencer (1998, 2010), who argues that the delegation of administrative authority to regional units is a ruler’s rational response to territorial expansion. Again, this could create a link between diversity and states that operates through the geographic scope of a society, and not through trade.
TABLE11. Alternative stories: Artificial countries and area groups
[Table 11 here]
African continent into squares1◦ by1◦ (see Figure 7) and repeat the main analysis.
Ex-cepting coastal societies, the units of observation now all have the same area. Because several ethnic groups might intersect a single square, I keep the levels of jurisdiction of the most centralized state as that square’s measure of state centralization; that so-ciety’s crop type, date of observation, and ethnographic region are also kept for the analysis. Results are presented in Table 11. These are even more statistically robust than the main results. Similarly, because the unit of observation for the main analysis is the ethnic group, this approach mitigates the concern that multi-ethnic states will be “double-counted” in the data.
Second, I restrict the sample to societies of similar areas. I compute area quintiles for all ethnic groups. In Table 11, I report the results if the smallest quintile (Q1), largest quintile (Q5) or both are dropped. Results are robust to this sample restriction, and the coefficients on ecological diversity are greatest when both the largest and smallest ethnic groups are removed from the sample. Third, I control for area directly in Table 13 and show that the main effect does not disappear. I discuss this in greater detail below.
5.2. States conquer trading regions. The second alternative explanation of the results is that states emerge for reasons unrelated to the gains from trade, and then move to occupy prime trading regions through migration or conquest. My first argument against this alternative story is to appeal to the artificial country results above. That similar results can be achieved using units with regular boundaries suggests that diversity does not result from the irregularly-shaped boundaries of ethnic groups that have conquered their surroundings in ways that overlap with ecology. My second strategy for dismissing this alternative story is to give narrative evidence on the most influential (in terms of dfbeta) societies in the data. The top fourteen of these are listed in Table 12. The central argument of this paper is that trade causes states. If the centralized societies in this list are known to have developed states where they are, rather than migrating to capture them, this supports the Ricardian view. Further, if these states derived their wealth and power from their location relative to geographically-shaped trade routes, it is evidence that profitable trade routes were necessary for states to exist in these locations. I choose six of the most influential centralized states for case study evidence.
TABLE12. Alternative stories: Six influential states
[Table 12 here]
There are six centralized states in Table 9 – the Yoruba, Songhai, Toro, Suku, Luba and Lozi. To test the “Ricardian” view, I ask five questions in each case. First, did these so-cieties participate in trade? Second, was trade a source of wealth for the society? Third, was trade a source of state power? Fourth, did these polities rise and fall with the for-tunes of external trade? Fifth, did these states move to capture trading regions after they grew strong? I summarize the answers to these questions in Table 12. While the evi-dence does not in every case support the view that trade promotes states rather than the reverse (especially the answers to the fourth question), it is broadly consistent with this interpretation.
Yoruba. Morton-Williams (1969) argues that Yoruba Oyo and Akan Ashanti “devel-oped under the stimulus of external trade, owing much from their beginnings to their proximity to the Mande trade routes in the north, and later also to their fortunate posi-tions in the hinterlands during the growth of the maritime markets on the coast.” Law (1977) is more guarded, suggesting that three factors together explain the rise of Oyo – the strength of its imported cavalry, its participation in long-distance commerce with the north, and its engagement in the Atlantic slave trade, the latter being followed by Oyo’s imperial expansion. It is clear that trade was important in the Oyo economy. Oyo cloth was sold to Dahomey and Porto Novo, and the state imported kola nuts from the forest areas of Yorubaland for consumption and re-export. Salt and camwood were im-ported, and the latter was re-exported to Nupe. The horses on which the Oyo cavalry depended were also imported from the north, albeit in return for slaves. Critically, Law (1977) shows that the Alafin(king) relied heavily on trade taxes for his revenues; even direct taxes were collected in cowries and other currencies that were largely acquired through trade. Further, he and other chiefs engaged in trade personally. Trade upheld the authority of theAlafinby permitting him to maintain a superior standard of life, and by enabling him to distribute money and trade goods. The story that emerges from the accounts of Morton-Williams (1969) and Law (1977), then, is of a state that depended on trade across ecological zones for its existence, but was spurred to expand by the rise of the coastal slave trade. Neither author mentions conquest of neighboring regions as a pre-condition for trade.
depended for its wealth on the trans-Saharan trade. Neumark (1977) attributes the suc-cess, not only of Songhay but of the states that preceded it, to “their strategic commer-cial position on the fringes of the Sahara.” Songhay exported principally gold and slaves, as well as ivory, rhinoceros horns, ostrich feathers, skins, ebony, civet, malaguetta pep-per, and semi-precious stones. It re-exported cloth and leather goods from Hausaland and kola from the forest zone. It imported salt, linen, silk, cotton cloth, copper utensils and tools, ironwork, paper, books, weapons, cowries, beads, mirrors, dates, figs, sugar, cattle and horses. Leo Africanus noted the empire’s prosperity, as abundant food could be produced in the southern savanna and shipped to Timbuktu via the Niger (Levzion, 1975). Lovejoy (1978), similarly, notes that Timbuktu and Gao, Songhay’s most impor-tant cities “controlled trans-Saharan trade, desert-side exchange, and river traffic on the Niger. Located in the Sahil but with easy access to western and central savanna, they were at the hub of overland and river routes where staples of desert-side trade such as grain and salt could readily be transferred from river boat to camel, and vice versa.” Songhay was the first Sudanic empire whose power reached as far as the salt mines of Taghaza (Levzion, 1975). Shillington (1989) notes taxes on trade as a key source of gov-ernment revenue.
It is true that, after its establishment, Songhay did expand – Bovill (1995) writes that Songhay moved into the Hausa states to capture their quality land and into Air to drive out Tuareg raiders. Levzion (1975) adds that these conquests were largely along the Niger river, because of Songhay’s dependence on its Sorko fleet for its military power. This is not necessarily counter to the Ricardian view. In the case of Air, this was a move-ment to protect existing trade interests, not to secure new routes. The strength of Song-hay, like many of the states that came before it, had already been based on its favorable location for trade before it began its expansion.
Ingham (1975) describes the Toro region as one of relative prosperity. The Toro kings sold slaves, ivory and cows to Arab traders in return for guns and cloth (Taylor, 1962). Independent Toro was also an exporter of salt; Good (1972) notes that, until 1923, the
okukamaorMukama(king) of Toro held personal ownership over the trade in salt from Lake Katwe and other lake deposits near Kasenyi. This was sold for regional consump-tion in Bunyoro, ocassionally as far east as Lake Victoria, in Rwanda and Tanzania, and into the Congo perhaps fifty miles beyond the present border (Good, 1972). This was, however, an example of a state expanding to take advantage of a tradable resource. Lake Katwe was in Busongora, which had also seceded from Bunyoro, and which was an early conquest by independent Toro (Good, 1972). Bunyoro recaptured the territory during the 1880s.
Suku. The Suku are a petty state in the Congolese savanna, part of the Central African “matrilineal belt.” They appear to have become independent from the Lunda empire during the early nineteenth century by moving into vacant land east of the Kwango val-ley (Kopytoff, 1965). This was precipitated by the collapse of Lunda rule over the region as a whole (Kopytoff, 1964). Kopytoff (1965) writes that Suku participation in the rubber trades of the nineteenth century and Second World War was “marginal,” and that these periods were “the only ones when the Suku had any cash crops to sell. At present, the region is both too poor and too far from the centers to export a commercially feasible product of any kind.” Similarly, the Suku lacked a developed system of market places and itinerant trade was “not at all developed” (Kopytoff, 1967). The Suku did, however, participate as middlemen in the long-distance trade between the raffia and palm-oil producers north and east of them and southern groups who traded directly with the Por-tuguese (Kopytoff, 1967). They also purchased raw raffia for weaving into cloth, which was exported to the southeast along with palm oil in return for shell money and Eu-ropean goods, some of which were exported (Kopytoff, 1967). The Suku were known for their wealth in shell money. The Suku MeniKongo(king) actively ruled over some twenty or thirty villages around the capital, and administered the remainder of his king-dom through regional chiefs. Kopytoff (1964) tells us that shell money was legal tender in rendering tribute to chiefs, so the same logic as used by Law (1977) implies that direct taxes were, indirectly, taxes on trade.
Luba. The separate Luba states were not unified until the eighteenth century (Birm-ingham, 1976). Before this period, separate Luba states such as Kikonja or Songye had control of localized dired fish, salt, oil palm, raffia cloth, and copper-working industries (Birmingham, 1976). Trade was largely “vertical,” collected by chiefs as tribute, and no class of “horizontal” traders exchanging goods between producers emerged before the growth of the Luba empire. In the late eighteenth century, Luba Lomami responded most vigorously to the new long distance trade in ivory and slaves (Birmingham, 1976). Bisa traders exchanged cloth, beads and cattle for tusks that were sold subject to tax-ation and supervision by either the royal household or by chiefs (Birmingham, 1976). This trade was preceeded by “pioneering chiefs,” who advanced into new lands and ar-ranged for the purchase of ivory while at the same time creating “a more or less perma-nent Luba political superstructure” behind which the Bisa traders followed (Birming-ham, 1976).
After 1780, the Luba expanded, first into the space between the Lualaba and Lake Tanganyika, and later into the fishing and palm oil areas of the Lalaba lakes, the cop-per production portions of the Samba, and the ivory-producing province of Manyema (Birmingham, 1976). At its peak in the mid-nineteenth century, the empire presided over “a wide-ranging and international trade” in oil, salt, poisons, drums, slaves, copper, palm cloth, baskets, iron, skins and fish. Wilson (1972) argues that long-distance trade was the cause of this expansion. The slave trade pushed Lunda to establish Kazembe as a tributary kingdom. Sub-regional specializations, such as Sanga production of copper crosses, was stimulated by the influx of trade goods. Luba-Lomami itself began as a pro-ducer of salt and hoes, sold in neighboring regions. New trades developed in response to trade goods; for example, the traditional trade with the Holoholo was supplemented with beads and ivory. Birmingham (1976) argues that the decline of the Luba kingdom followed that of the ivory trade. Their Yeke-Nyamwezi trading partners began to focus on copper, conquering production centers belonging to Mpande and Katanga. Swahili-Arab traders began to trade directly into the forest, cutting out the Luba. With ivory be-coming scarce and the price of slaves declining, the Luba were unable to purchase the guns needed to secure their power without exporting large numbers of internally cap-tured slaves. The kingdom disintegrated into warring factions and became dominated by its neighbors.
mounds within the floodplain, as well as a need to protect cattle in outlying areas dur-ing the flood season. The result was that the Lozi traded with its neighbors as they did not trade among themselves. Further, the king and princess chief both collected tribute in the form of specialized production of the “tribes” under his command, including ca-noes, weapons, iron tools, meat, fish, fruit, salt, honey, maize and manioc (Birmingham, 1976).
The Lozi were ruled between 1840 and 1864 by the Sotho-speaking Kololo who in-vaded from the south. The Lozi spurned Lovale traders before the emergence of the trade in slaves and ivory in southern Kololo around 1850. Before this, they had sent traders to the Lunda areas of the upper Zambezi, trading only indirectly with the Por-tuguese (Flint, 1970). Flint (1970) suggests that the major change was the rise of the ivory trade relative to the slave trade by 1853. He argues that the Kololo used Livingstone as a ‘prestigious outsider,’ helping them negotiate with the peoples through whose terri-tory the Lozi traded. By 1860, long distance trade had become of major importance to the Barotse. The Kololo obtained ivory either as tribute from the Barotse or by selling iron hoes to the Tonga, and then sold this ivory either to middlemen or directly to the coast. The Lozi also exported cattle and forest products in return for trade goods during this period (Gluckman, 1941). Trade gave the Kololo king an independent power base, strengthening him against other chiefs who depended on cattle raiding for revenue. He worked to establish a new set of ‘caravan chiefs’ (Flint, 1970).
Flint (1970) suggests that the more trade-oriented Barotse of the floodplain came into conflict with the southern Kololo, whose raids on their neighbors disrupted trade, and who refused to move the capital into the floodplain where it would be better situated relative to trade routes. Further, the king received profits from ivory and distributed within his court, shutting out the Barotse. Though the details are not clear, Birmingham (1976) ties the restoration of Lozi independence to this trade. He argues that traders operated independently of the state, and the second Kololo king was followed by an interregnum before a Lozi king was restored in the 1870s. He suggests that the western ivory trade “may have facilitated” this restoration. Gluckman (1941) suggests that the restored Lozi king traded cattle, ivory and slaves on his own account for trade goods that he distributed, both among his own people and among subject tribes.
TABLE13. Alternative stories: Additional controls and ethnic competition
[Table 13 here]
it is the ability to trade the products of different macro-ecological regions that matters most. In every case, rulers relied heavily on taxing trade. The exception is Toro, which emerged in a region with an existing trade in salt and iron, but conquered Busongora in part to capture the most important source of salt in the region. Toro, however, inherited its political structure from Bunyoro, which had previously grown strong in part due to its sale of metal goods and control of the Kibiro salt industry.
My third strategy for dismissing this alternative explanation is to control directly for area. This is not done in the main analysis, because it is potentially endogenous. States that independently develop strong states might have larger areas, biasing the coefficient on both area and potentially on the other coefficients. With that caveat in mind, if it is only through expansion that states become correlated with ecological diversity, there should be no correlation conditional on area. I include it, then, as an additional regres-sor in Table 13. The impact of area is negligible, and the coefficient remains significant, positive, and of a similar magnitude.
5.3. Islands of quality. The third alternative story is that states emerge to protect “is-lands” of particular quality. This competition is fiercest when these islands are very dif-ferent from neighboring areas, and areas with diverse land qualities will similarly have diverse ecologies. Jones (2003, p. 105-106), similarly, argues that the European patch-work of nation states (as opposed to China’s unifying empire) was based on the preva-lence of fertile islands separated by natural boundaries. This is also similar to Allen’s (1997) view that the Egyptian state benefitted from the fact that its citizens were con-fined to a fertile valley surrounded by desert. Carneiro (1970), likewise, has noted that the Nile, Tigrus-Euphrates, and Indus valleys as well as the Valley of Mexico and the mountain and coastal valleys of Peru were all areas of circumscribed agricultural land. In columns 3 and 4 I control for the range of agricultural constraints – the difference in land quality between the best and worst points in a society’s territory. This does dimin-ish the effect of ecological diversity, though it remains significant when regional fixed effects are not included. That the range of agricultural constraints is not significant, however, suggests it should not be included in the best specification. Results are also robust to including the presence of bovines as a control (not reported).
5.4. Population density. Fourth, it is possible that ecological diversity is correlated with population density, which alone explains the centralization of pre-colonial African states. I add population density in 1960, published by the United Nations Environment Pro-gramme, as a proxy for historical population density.15 This is reported in columns 5 and 6 of Table 13, and the effect of ecological diversity remains intact.
TABLE14. Mechanisms: Other institutional outcomes
[Table 14 here]
5.5. Ethnic competition. Fifth, it is possible, combining the stories of Michalopoulos (2008) and Tilly and Ardant (1975), that ecology-specific human capital gives rise to a greater number of ethnic groups in regions of diverse ecology, and that competition be-tween these groups leads to greater state centralization. To show that this is not driving my results, I return to my sample of artificial countries. For each square, I count the number of ethnic groups that intersect it in Murdock’s map, and include this as an ad-ditional control in Table 13. In column 1, there is a positive but insignificant correlation between diversity and the number of ethnic groups in an “artificial country.” This is an artefact of the specification chosen – if I take the full sample of artificial countries (rather than only those for which information on states are available) the correlation is strong and positive, confirming the Michalopoulos (2008) result with a different measure of ge-ographic heterogeneity. If I include the number of ethnic groups as an additional con-trol, this does not diminish the direct effect of ecological diversity on states, suggesting that this and the gains-from-trade explanation of states are not mutually exclusive.
6. MECHANISMS
6.1. How does trade cause states? There are many reasons centralized states might arise due to gains from trade. In Table 14, I test whether theEthnographic Atlassupports any of these. The first possible mechanism is to take over the authority of other smaller states in its vicinity. The atlas contains a variable (V32) that records the number of “lev-els of local jurisdiction.” Following Bolt and Smits (2010), I take this as a crude measure of the strength of local states, and use it as an outcome in place of state centralization in (2). While there is a suggestive negative correlation between ecological diversity and local states when no other controls are added, this is not robust to the inclusion of other variables or to region fixed effects. Similarly, V72 records the rules for succession to the office of the local headman. I construct a “headman is appointed” dummy if this rule is “appointment by higher authority.” There appears to be no correlation in the data. I am not able to conclusively test for the spread of Islam as a mechanism. The data only state whether high gods are “supportive of human morality”, which is only positive for a handful of societies outside of the Moslem Sudan, Western Sudan and Ethiopia. This is only for a sample roughly half the size of the main sample, and does not appear to be related to ecological diversity, though its collinearity with the region fixed effects make it impossible to test whether it this is the case within regions.
TABLE15. Mechanisms: Other sources of trade
[Table 15 here]
test for this mechanism, I use V66, “class stratification among freemen,” which is di-vided into five levels. In order, these are “absence among freemen,” “wealth distinc-tions,” “elite,” “dual,” and “complex.” Here there is a strong relationship between gains from trade and inequality. Results (not reported) are similar if a binary class stratifi-cation measure is used. Similarly, I test whether there is a relationship between gains from trade and one particular form of inequality – slavery. V70 codes slavery into four levels. These are “absence or near absence,” “incipient or nonhereditary,” “reported but type not identified,” and “hereditary and socially significant.” While there is a positive correlation of ecological diversity and slavery conditional on other controls, this is not apparent in the unconditional correlation, nor when regional fixed effects are added. Many of these results are statistically weak, but they do suggest strong links between trade and class stratification.
It is also interesting to note that the ecological diversity variable does predict modern economic activity, though not robustly. I use the same ln(1 + Avg. light density) nor-malization of 2009 nighttime lights as Michalopoulos and Papaioannou (2010) to test this. The ecological diversity measure predicts conditional, though not unconditional, differences in modern light densities. This effect disappears, however, when standard errors are clustered by ethnographic regions.
6.2. What sort of trade matters? While the ecological diversity measure serves as a proxy for the capacity to trade products from different ecological zones, it will not cap-ture other forms of trade. In Table 15, I test whether three other sources of trade – fish-ing, iron, and gold – give similar rise to states. A society’s percentage dependance on fishing is V3 in the Ethnographic Atlas. I find no correlation between this and states. While it is possible that the impact of fishing is being hidden by the impacts of other controls (notably coastal distance and major rivers), regressing states on the fishing variable similarly does not yield a significant result (not reported). To test the impor-tance of minerals, I take data from the US Geological Service’s Mineral Resources Pro-gram.16These records contain data on both metallic and nonmetallic mineral resources at specific sites, with their latitudes and longitudes. “Iron” is the number of deposits of iron found within an ethnic group’s territory, and “gold” is analogously defined. If there is likely to be any endogeneity bias from using modern data, it will be positive, since states that have inherited the strength of their pre-colonial predecessors will likely be better able to exploit their countries’ resources. Despite this, I find no evidence that iron matters. Gold enters significantly having either mineral within an ethnic group’s
TABLE16. Mechanisms: Regressions of SCCS measures of trade on state centralization
[Table 16 here]
TABLE17. Mechanisms: Local or long distance trade?
[Table 17 here]
TABLE18. Mechanisms: Is Africa different?
[Table 18 here]
territory when no controls are added, though the effect of gold is marginally insignifi-cant with controls. “Salt” is the number of salt-producing cites listed by Sundstr
”om (1974) within an ethnic group’s territory.17
While the sample of African societies in the SCCS is too small to use for comparing that source’s data on trade with the main sample here, I can test whether state central-ization is correlated with any particular form of trade in the SCCS’s global sample of ethnic groups. In Table 16, I present the results of regressing several of these indicators on the state centralization measure and a constant. The presentation here is similar to Table 5. I find that societies with states are more likely to trade for food, through more levels of intermediation, and that this trade is more important to their subsistence. Po-litical power is more likely to depend on commerce in more centralized states, trade and markets are more likely to exist, and exchange is more important both within and beyond the community, though this latter correlation is not significant at conventional levels.
Interestingly, Tables 16 and 15 suggest that it is more mundane, intra-community trade in products such as food, rather than long distance trade in products such as gold and ivory, that matters for the formation of states. The main data sources here do not allow for these two types of trade to be conclusively tested against each other. However, the “ecological diversity” measure is more intuitively related to trade that is possible within an ethnic group’s borders, while the “distance from an ecological divide” variable is more suggestive of long distance trade. In Table 17, I test whether the estimated ef-fect of either one disappears when both are included as regressors. They are, however, strongly correlated (see column 1), which limits the power of this test. With controls, both coefficients fall relatively 40% relative to their values in Tables 4 and Table 6. The distance from a divide remains more statistically robust, especially once regional fixed effects are added. It is not, then, possible to rule out the importance of either long dis-tance or local trade.
17Of 271 sites he lists, I match 84 to ethnic groups in the data and 157 to specific geographic locations,
6.3. Is Africa different? In other work, I have assembled an analogous data-set for all 1,267 societies of the Ethnographic Atlas.18 While some of the controls used here are either not available or computed somewhat differently in that data, I am able to expand the present analysis to the whole world. Results in Table 18 suggest that Africa is not different: in a sample of more than 1,000 societies from around the world, ecological diversity continues to predict the existence of states.
7. CONCLUSION
I have used this paper to provide empirical support for Bates’s (1983) Ricardian view of pre-colonial African states. The gains from trade stemming from ecological diver-sity predict the presence of state centralization across sub-Saharan societies recorded in theEthnographic Atlas. Moving from a homogenous zone to one that is ecologically diverse predicts that the chance a society is centralized rises between 6 and 13 percent-age points. Distance from an ecological divide serves as well in predicting states. There is no evidence this is overstated due to endogeneity or the influence of outliers or spe-cific ethnographic regions. The histories of African societies are consistent with this interpretation of the data, rather than one in which states emerge and then migrate. Similarly, area, defense of fertile islands, correlation with dense population, and ethnic competition do not explain the results. Michalopoulos and Papaioannou (2010) show that the strength of pre-colonial African states does more to predict modern develop-ment, using night-time lights as a measure, than country-level institutions. These states are rooted in the intersection of ecology and trade.
REFERENCES
Adjuik, M., Bagayoko, M., Binka, F., Coetzee, M., Cox, J., Craig, M., Deichman, U., Don deSavigny, F., Fraser, C., Gouws, E., et al. (1998). Towards an atlas of malaria risk in Africa. First technical report of the Mapping Malaria Risk in Africa/Atlas du Risque de la Malaria en Afrique (MARA/ARMA) collaboration. Durban, MARA/ARMA. Allen, R. (1997). Agriculture and the Origins of the State in Ancient Egypt. Explorations
in Economic History, 34(2):135–154.
Altonji, J., Elder, T., and Taber, C. (2005). Selection on observable and unobservable vari-ables: Assessing the effectiveness of Catholic schools. Journal of Political Economy, 113(1):151–184.
Austin, G. (2008a). Resources, Techniques, and Strategies South of the Sahara: Revising the Factor Endowments Perspective on African Economic Development, 1500-2000.
Economic history review, 61(3):587–624.
Austin, G. (2008b). The reversal of fortunethesis and the compression of history: per-spectives from African and comparative economic history. Journal of international development, 20(8):996–1027.
Banerjee, A. and Iyer, L. (2005). History, institutions, and economic performance: the legacy of colonial land tenure systems in India. The American economic review, 95(4):1190–1213.
Bates, R. (1983). Essays on the political economy of rural Africa. University of California Press.
Berry, S. (1992). Hegemony on a shoestring: indirect rule and access to agricultural land.
Africa, pages 327–355.
Bhalotra, S. and Cochrane, T. (2010). Where have all the young girls gone? On the rising trend in sex selection in India. Working Paper.
Birmingham, D. (1976). The Forest and Savanna of Central Africa.
Bisson, M. (1982). Trade and Tribute. Archaeological Evidence for the Origin of States in South Central Africa (Commerce et tribut. Documents arch´eologiques sur l’origine des ´Etats du sud de l’Afrique centrale). Cahiers d’´etudes africaines, 22(87):343–361. Bockstette, V., Chanda, A., and Putterman, L. (2002). States and markets: The advantage
of an early start.Journal of Economic Growth, 7(4):347–369.
Bolt, J. and Smits, J. P. (2010). Can the nature of pre-colonial institutions explain gover-nance quality in Africa? Working Paper.
Bovill, E. (1995). The golden trade of the Moors: West African kingdoms in the fourteenth century. Markus Wiener Pub.
Carneiro, R. (1970). A theory of the origin of the state. Science, 169(3947):733.
Chanda, A. and Putterman, L. (2007). Early Starts, Reversals and Catch-up in the Process of Economic Development.Scandinavian Journal of Economics, 109(2):387–413. Diamond, J. (1997). Guns, germs, and steel. 1997.
Dixit, A. (2004). Lawlessness and economics: alternative modes of governance. Princeton Univ Pr.
Englebert, P. (2000). Solving the Mystery of the AFRICA Dummy. World development, 28(10):1821–1835.
Fenske, J. (2011). Does land abundance explain african institutions? Working paper: To be posted soon.
Fischer, G., Shah, M., van Velthuizen, H., and Nachtergaele, F. (2001). Global agro-ecological assessment for agriculture in the 21st century. IIASA.
Flint, E. (1970). Trade and politics in Barotseland during the Kololo period. Journal of African History, 11(1):71–86.
Frankel, J. and Romer, D. (1999). Does trade cause growth? American Economic Review, 89(3):379–399.
Gennaioli, N. and Rainer, I. (2007). The modern impact of precolonial centralization in Africa. Journal of Economic Growth, 12(3):185–234.
Good, C. (1972). Salt, trade, and disease: Aspects of development in Africa’s northern Great Lakes Region.International Journal of African Historical Studies, 5(4):543–586. Herbst, J. (2000). States and power in Africa: comparative lessons in authority and
con-trol. Princeton Univ Pr.
Huillery, E. (2008). The Impact of European Settlement within French West Africa. Did pre-colonial prosperous areas fall behind? Mimeogr., Paris Sch. Econ.
Ingham, K. (1975). The kingdom of Toro in Uganda. Methuen; New York: distributed by Harper & Row, Barnes & Noble Import Division.
Iyer, L. (2007). Direct versus indirect colonial rule in India: Long-term consequences.
Mimeogr., Harvard Bus. Sch.
Jones, E. (2003). The European miracle: Environments, economies, and geopolitics in the history of Europe and Asia. Cambridge Univ Pr.
Kopytoff, I. (1964). Family and Lineage among the Suku of the Congo. The family es-tate in Africa: studies in the role of property in family structure and lineage continuity, pages 83–116.
Kopytoff, I. (1965). The Suku of Southwestern Congo. Peoples of Africa, pages 441–80. Kopytoff, I. (1967). Labor allocation among the Suku. Paper presented at conference on
competing demands for the time of labor in traditional African societies.
Law, R. (1977). The Oyo empire: c. 1600-c. 1836: a west African imperialism in the era of the Atlantic slave trade. Clarendon press.
Levzion, N. (1975). The Western Maghrib and Sudan. In Gray, R., editor,The Cambridge history of Africa: from c. 1600 to c. 1790, pages 331–462. Cambridge University Press. Lovejoy, P. (1978). The role of the Wangara in the economic transformation of the
cen-tral sudan in the fifteenth and sixteenth centuries. The Journal of African History, 19(02):173–193.
Maddala, G. (1986).Limited-dependent and qualitative variables in econometrics. Cam-bridge Univ Pr.
Mamdani, M. (1996). Citizen and subject: Contemporary Africa and the legacy of late colonialism. Princeton Univ Pr.
McCann, J. (1999). Green land, brown land, black land: an environmental history of Africa, 1800-1990. James Currey.
Michalopoulos, S. (2008). The Origins of Ethnic Diversity. Working Paper.
Michalopoulos, S. and Papaioannou, E. (2010). ‘Divide and Rule’ or the Rule of the Di-vided? Evidence from Africa.Working Paper.
Moav, O. and Mayshar, J. (2011). Title not yet listed on programme. Paper presented at the 2011 Royal Economic Society meetings.
Morton-Williams, P. (1969). The influence of habitat and trade on the polities of Oyo and Ashanti. InMan in Africa, pages 79–98. Tavistock Publications.