http://dx.doi.org/10.4236/ajps.2016.76092
How to cite this paper:Touil, L., Bao, A.K., Wang, S.M. and Ferchichi, A. (2016) Genetic Diversity of Tunisian and Chinese Alfalfa (Medicago sativa L.) Revealed by RAPD and ISSR Markers. American Journal of Plant Sciences, 7, 967-979.
http://dx.doi.org/10.4236/ajps.2016.76092
Genetic Diversity of Tunisian and Chinese
Alfalfa (
Medicago sativa
L.) Revealed by
RAPD and ISSR Markers
Leila Touil1,2*, Aike Bao2, Suomin Wang2, Ali Ferchichi11Arid Land and Oasis Cropping Laboratory, Institute of Arid Land, Medenine, Tunisia
2State Key Laboratory of Grassland Agro-Ecosystems, College of Pastoral Agriculture Science and Technology,
Lanzhou University, Lanzhou, China
Received 3 March 2016; accepted 26 April 2016; published 29 April 2016
Copyright © 2016 by authors and Scientific Research Publishing Inc.
This work is licensed under the Creative Commons Attribution International License (CC BY).
http://creativecommons.org/licenses/by/4.0/
Abstract
Alfalfa (Medicago sativa L.) is one of the most important forage crops in the world. The genetic va-riability analysis of 19 alfalfa populations collected from three sites in South Tunisia (Gabes, Kebi-li, Tozeur) and 1 from North West China were carried out using Random Amplified Polymorphic DNA (RAPD) and Inter Simple Sequence Repeat (ISSR) markers. Five RAPD primers amplified 44 bands of which 22 were polymorphic; and five ISSR primers amplified 51 bands of which 33 were polymorphic. The percentage of polymorphic bands detected by RAPD and ISSR was 50% and 64.7%, respectively. The resolving power (Rp) varied between 0.6 and 4.1 with an average of 2.02 for RAPD marker and between 0.7 and 6.5 with an average of 2.28 for ISSR marker. However the Average Informativeness band (AvIb) was ranged from 0.2 to 0.9 with an average of 0.5 in RAPD marker and from 0.29 to 0.7 with an average of 0.624 in ISSR marker. The RAPD marker revealed less within population genetic diversity than ISSR marker. Although Cluster (UPGMA) and Corres-pondence Factorial Analyses (CFA) indicate that populations’ clustering made independently both from the geographical origin.
Keywords
Medicago sativa L., Genetic Variability, RAPD, ISSR, UPGMA Clustering
1. Introduction
Alfalfa (Medicago sativa L.) is important legume forage that contains a variety of vitamins and high protein
content and thus is a key component of the animal husbandry all over the world. Lucerne is a good plant model for studies of genetics. Many reports have been documented regarding genetic diversity of Medicago sativa us-ing different traits: morphological and yield [1]-[3], histological [4] and allozyme markers [5].
Neutral, DNA-based molecular markers allow a more precise and environment-independent way to evaluate the genetic diversity of a particular species. Several studies have been done on alfalfa using DNA-based markers like AFLP [6][7], RAPD [8]-[13], RFLP [14]-[17] and SSR [18]-[20]. These studies have shown that alfalfa was characterized by a high inter-population variability.
Among different markers (morphological, cytological biochemical and DNA), markers based on DNA are independent from environmental effects, unlimited in number and show high level of polymorphism.
Random Amplified Polymorphic DNA (RAPD) is generally favored because of its sensitivity, coupled with the fact that DNA sequence information is not required for primer design, no radioisotope labeling is needed for sample detection, and only a small amount of template DNA is required [21][22]. RAPD is a molecular marker widely used in genetic variability analyses due to its simplicity and speed, dispensing previous genetic informa-tion of the sample under study [23]; although no locus specific information is presented [24]. Basically, it’s a variation of the PCR amplification technique, using a simple primer of arbitrary sequence that will amplify a random region of the analyzed genome. Even though the reproducibility of this marker has been previously questioned [25], adjustment in the technique has made the obtainment of reproducible results possible [26] per-mitting the use of this markers in many types of genetic analysis.
ISSR markers are generated via PCR reactions with a single primer designed from repetitions of two or three nucleotides anchored in a sequence of one to three nucleotides that aim to eliminate slippage related artifacts [27]. The amplified regions represent the sequence between two microsatellite sites and the absence of bands is interpreted as a divergence of the primer or loss of a locus by the deletion of the SSR sites or chromosomal rearrangement. Some advantages related to this marker are the small quantity of DNA required for the reactions, the small number of PCR reactions, the hyper variability of the bands patterns and their easy detection, besides the high PCR reactions annealing temperatures that reduce the quantity of artifacts and errors [28].
The objective of this study was to investigate the differentiation level among a set of alfalfa populations with RAPD and ISSR markers, and to examine the relationship between these populations collected from tow semi arid regions (the South of Tunisia and the North West of China) and their genomic diversity in order to complete genetic resources conservation and the evaluation of native germplasm of lucerne and constitute a base for breeding program.
2. Materials and Methods
2.1. Plant Material
Twenty alfalfa (Medicago sativa L.) populations were involved in this study, including nineteen from South Tu-nisia and one from North Ouest of China. The description of the 20 alfalfa genotypes used in this study was re-sumed in Table 1.
2.2. Genetic Diversity Analysis
2.2.1. DNA Extraction
Young leaflets were harvested on each plant and total genomic DNA was purified from frozen young leaves ac-cording to the procedure described by [29] with minor modifications. The genomic DNA concentration was es-timated spectrophotometrically and its integrity was checked by analytical (2%) agarose minigel electrophoresis [30].
2.2.2. RAPD Assay
Table 1.Tunisian and Chinese alfalfa populations studied and their geographical origin.
Accession Name Label Geographical origin Oases type
Kattana P1 Gabès Coastal
Chenchou P2 Gabès Coastal
Cheninni 1 P3 Gabès Coastal
Cheninni 2 P4 Gabès Coastal
Cheninni 3 P5 Gabès Coastal
Teboulbou P6 Gabès Coastal
Metwia P7 Gabès Coastal
Ghannouch P8 Gabès Coastal
Zerkine P9 Gabès Coastal
Essdada P10 Tozeur Continental
Bouhlel P11 Tozeur Continental
Degach P12 Tozeur Continental
Hamma jerid P13 Tozeur Continental
Zaafarane P14 Kébili Continental
Nouael P15 Kébili Continental
Jerzinze P16 Kébili Continental
El golaa P17 Kébili Continental
Limaguess P18 Kébili Continental
Staftimia P20 Kébili Continental
[image:3.595.187.439.111.465.2]Xinjiang Daye P21 North Ouest China Continental
Table 2. List of the selected RAPD primers and the polymorphisms obtained on 20 alfalfa populations.
Primers Sequence (5’ - 3’) Tm (˚C) Total number of bands (a)
Number of polymorphic
bands (b)
Percentage of polymorphism
(a/b)
Resolving power (Rp)
Average Informativeness
band (AvIb)
AF14 GGTGCGCACT 34 13 8 61.53 4.1 0.51
C1 TTCGAGCCAG 32 7 3 42.85 0.6 0.2
AX16 GTCTGTGGGG 34 8 3 37.5 1.9 0.63
AT CAGTGGTTCC 32 9 7 77.77 2.6 0.37
W-07 CTGGACGTCA 32 7 1 14.28 0.9 0.9
with final extension at 72˚C for 7 min. Amplification products were loaded on 1.8% agarose gel, by electropho-resis in TBE buffer, stained with ethidium bromide, visualized by illumination with ultraviolet light and photo-graphed under UV light, by a Bioprint (Kaiser RS1, Germany).
2.2.3. ISSR Assay
[image:3.595.89.538.491.612.2]Table 3.List of the selected ISSR primers and the polymorphisms obtained on 20 alfalfa populations.
Primers Sequence
(5’ - 3’) Tm (˚C)
Total number of bands (a)
Number of polymorphic bands (b) Percentage of polymorphism (a/b) Resolving power (Rp) Average Informativeness band (AvIb)
A1 AGAGAGAGAGAGAGAGC 53 13 8 61.53 4.1 0.51
Am2 TCTCTCTCTCTCTCTCC 53 7 3 42.85 0.6 0.2
UBC 890 (AGC)(ACT)(AGC)(GT)7 51.9 8 3 37.5 1.9 0.63
A12 (GA) 6 CC 55 9 7 77.77 2.6 0.37
UBC-818 (CA)7G 52 7 1 14.28 0.9 0.9
sterilized distilled water. The mixture was amplified in a thermal cycler (GeneAmpR PCR System 9700) that was programmed for 1 cycle of initial denaturation at 94˚C for 5 min; 35 cycles of 94˚C for 1 min, followed by specific annealing temperature for 55 s, and ending with an extension at 72˚C for 1 min; and a final extension cycle at 72˚C for 7 min. The PCR machine was adjusted to hold the product at 4˚C. The PCR products and 1 kb DNA ladder were electrophoresed on 2% agarose gel (stained with EtBr). The separated fragments were visual-ized with an ultraviolet (UV) transilluminator.
2.3. Data Analysis
Each gel after electrophoresis and staining was analysed by scoring manually the present (1) and absent (0) po-lymorphic RAPD and ISSR bands in individual lines for each primer and the values were used to compile binary data matrix.
For all primers combination, the total number of bands was determined and only the polymorphic ones were taken into account in this study to estimate the percentage of polymorphic bands (%PB).
The similarity matrix was calculated with Jaccard’s coefficient [31]. The matrix was then analyzed with the Neighbor-joining program using PHYLIP software (Phylogeny Inference Package, version 3.5c) [32] to con-struct a dendrogram between 19 Tunisian and 1 Chinese alfalfa populations using the unweighted pair group method with arithmetic averaging (UPGMA) algorithm.
The ability of the most informative primers to discriminate among populations was assessed by calculating the resolving power (Rp) [33] which has been reported to correlate between accessions. Evaluation of the Rp was performed according to the formula of [34]: Rp = ΣIb, where: Ib= − ∗1 2 0.5− P, Ib is the informativ-ness band and P is the proportion of the accessions containing the I band. Average Informativeness band (AvIb) as a measure of closeness of a band to be present in 50% of the genotypes in this study, was also calculated.
On the other hand, a correspondence factorial analysis (CFA) was performed by computing the binary matrix with XLSTAT version 14.
3. Results
3.1. RAPD Markers in Determining Genetic Variation of Alfalfa Populations
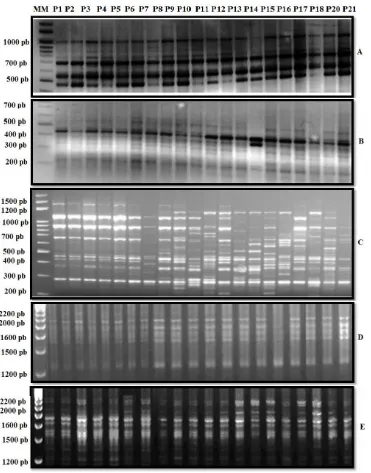
In order to detect genetic variation between 20 alfalfa populations, PCR amplifications were performed with RAPD primers. A total of five primers were screened in this study and produced discrete and reproducible am-plified DNA fragments (Figure 1). The five RAPD primers resulted in 44 different amplification products with 22 polymorphic RAPD bands for the 20 populations (Table 2).
Different levels of polymorphisms were detected since as the percentage of polymorphic bands (%PB) ranged from 14.28 for W07 to 77.77 for AT primers, with an average of 46.02%.
Figure 1.RAPD bands amplified with five arbitrary primers: (A) AF 14, (B) C1, (C) AX16, (D) AT and (E) W07, using DNA of 20 Tunisian and Chinese alfalfa samples. Numbers represent the popula-tions according to Table 1. MM: Molecular Marker.
Moreover, as reported in Table 2, the Average Informativeness band (AvIb) values varied from 0.2 showed by the primer C1 to 0.9 showed by the primer W07, with an average of 0.522.
The similarity matrix (Table 4) showed that the highest similarity (0.87) was for the populations P4, P5, P10, P13 and P18, P1, P14, P15 and P16, P2 and P11. The lowest similarity (0.55) was between the populations P21, p20, P4, P1, P11, P18, P10 and P13.
Table 4.Similarity matrix among 20 alfalfa populations based on data from 5 RAPD primers (44RAPD markers).
P1 P2 P3 P4 P5 P6 P7 P8 P9 P10 P11 P12 P13 P14 P15 P16 P17 P18 P20 P21
P1 1
P2 0.7 1
P3 0.74 0.83 1
P4 0.67 0.8 0.88 1
P5 0.68 0.87 0.85 0.82 1
P6 0.66 0.76 0.74 0.81 0.78 1
P7 0.68 0.82 0.9 0.92 0.8 0.83 1
P8 0.68 0.77 0.8 0.87 0.74 0.83 0.89 1
P9 0.71 0.81 0.84 0.82 0.78 0.77 0.84 0.89 1
P10 0.69 0.79 0.82 0.84 0.76 0.75 0.87 0.86 0.91 1
P11 0.77 0.87 0.85 0.82 0.84 0.78 0.84 0.84 0.83 0.81 1
P12 0.75 0.8 0.83 0.85 0.82 0.81 0.87 0.82 0.81 0.79 0.92 1
P13 0.79 0.78 0.82 0.84 0.86 0.85 0.81 0.81 0.85 0.83 0.86 0.89 1
P14 0.81 0.75 0.74 0.76 0.82 0.76 0.73 0.77 0.82 0.79 0.82 0.8 0.9 1
P15 0.79 0.84 0.82 0.8 0.81 0.8 0.82 0.81 0.86 0.78 0.86 0.89 0.88 0.85 1
P16 0.87 0.81 0.79 0.76 0.78 0.77 0.78 0.78 0.82 0.8 0.88 0.86 0.91 0.93 0.91 1
P17 0.65 0.75 0.69 0.71 0.77 0.87 0.73 0.77 0.77 0.79 0.77 0.7 0.79 0.81 0.74 0.76 1
P18 0.69 0.79 0.82 0.84 0.76 0.8 0.87 0.91 0.97 0.89 0.81 0.84 0.83 0.79 0.89 0.8 0.74 1
P20 0.69 0.79 0.87 0.84 0.81 0.8 0.87 0.86 0.97 0.89 0.81 0.84 0.88 0.79 0.83 0.8 0.74 0.94 1
P21 0.84 0.69 0.77 0.74 0.76 0.69 0.72 0.67 0.7 0.73 0.71 0.74 0.82 0.74 0.73 0.74 0.64 0.68 0.73 1
Chenenni2, P6: Chenenni3 (Provenance Gabès), P10: Essdada, P13: Hamma jerid (Provenance Tozeur) et P18: Limaguess (Provenance Kébili) populations. The sixth (VI) contained P3: Tboulbou, P7: Metwia, P8: Ghan-nouch et P9: Zerkine (Provenance Gabès) populations. Finally the last group (VII) consisted of tow populations: P12: Dgach (Provenance Tozeur) et P17: Elgolaa (Provenance Kébili).
To evaluate the information contained in experimental data, correspondence factorial analysis (CFA) was ap-plied considering all the monomorphics and polymorphics bands obtained simultaneously by the 5 RAPD pri-mers. The first 2 axis accounted for 29.06%. Axis 1 explained 15.35% of the inertia, however the axis 2 ex-plained 13.71% of the inertia. The dispersion of alfalfa populations on the plan defined by axes 1 and 2 showed seven clusters of populations (I, II, III, IV, V, VI and VII). Theses clusters were similar to these obtained by the dendrogram illustrated in Figure 3 and contained the same populations. Grouping of lucerne genotypes using CFA confirmed the result obtained using UPGMA method based on RAPD data. Tunisian and Chinese alfalfa populations were clustered independently of both geographic origins.
3.2. Genetic Diversity and Genotypes Relationships Obtained by ISSR Markers
In the second part of our experiment, the genetic variation between 20 alfalfa populations was detected with five ISSR primers. These five primers were screened in this study and produced discrete and reproducible amplified DNA fragments (Figure 4). The five ISSR primers resulted in 51 different amplification products with 33 po-lymorphic RAPD bands for the 20 populations (Table 3).
Figure 2. Dendrogram of the 20 Tunisian and Chinese alfalfa populations constructed by UPGMA methods using the similarity matrix generated by the Jaccard coefficient based on RAPD marker.
[image:7.595.186.442.489.694.2]Figure 4.RAPD bands amplified with five primers: (A) A1, (B) Am2, (C) UBC 890, (D) A12 and (E) UBC 818, using DNA of 20 Tunisian and Chinese alfalfa samples. Numbers represent the popula-tions according to Table 1. MM: Molecular Marker.
The percentage of polymorphic bands detected by RAPD marker was 64.7% and the average of polymorphic bands per RAPD primers was 12.94%. The largest number of polymorphic bands (22) was produced with UBC 890 primer, and the least number of polymorphic bands (1) was obtained by A12. The 5 polymorphic primers exhibited variation with regard to Average Informativeness band (AvIb) and resolving power (Rp). However, estimates of the resolving power (Rp) showed a high rate of collective Rp (11.4) with an average of 2.28.
Moreover, as reported in Table 3, the Average Informativness band (AvIb) values varied from 0.29 showed by the primer UBC890 to 0.7 showed by the primer A12, with an average of 0.624.
Table 5.Similarity matrix among 20 alfalfa populations based on data from 5 ISSR primers (51ISSR markers).
P1 P2 P3 P4 P5 P6 P7 P8 P9 P10 P11 P12 P13 P14 1P15 P16 P17 P18 P20 P21
P1 1
P2 0.97 1
P3 0.85 0.88 1
P4 0.8 0.83 0.94 1
P5 0.85 0.82 0.94 0.89 1
P6 0.85 0.83 0.94 0.94 0.94 1
P7 0.69 0.68 0.74 0.74 0.73 0.78 1
P8 0.78 0.76 0.77 0.82 0.76 0.82 0.68 1
P9 0.74 0.73 0.78 0.74 0.78 0.78 0.61 0.76 1
P10 0.71 0.69 0.8 0.75 0.79 0.8 0.7 0.73 0.79 1
P11 0.6 0.63 0.64 0.61 0.6 0.61 0.63 0.67 0.68 0.73 1
P12 0.76 0.78 0.84 0.8 0.79 0.8 0.66 0.78 0.74 0.76 0.69 1
P13 0.69 0.71 0.73 0.68 0.68 0.68 0.63 0.71 0.64 0.69 0.71 0.74 1
P14 0.66 0.69 0.66 0.62 0.65 0.62 0.56 0.68 0.62 0.67 0.68 0.71 0.79 1
P15 0.65 0.68 0.73 0.69 0.68 0.69 0.64 0.67 0.77 0.74 0.71 0.83 0.72 0.69 1
P16 0.61 0.63 0.69 0.65 0.64 0.65 0.68 0.6 0.58 0.74 0.68 0.74 0.77 0.69 0.73 1
P17 0.8 0.78 0.89 0.84 0.89 0.89 0.69 0.73 0.74 0.84 0.64 0.84 0.68 0.66 0.73 0.74 1
P18 0.73 0.76 0.77 0.73 0.72 0.73 0.6 0.67 0.76 0.82 0.75 0.78 0.71 0.68 0.76 0.68 0.77 1
P20 0.69 0.72 0.78 0.73 0.73 0.73 0.64 0.71 0.77 0.74 0.67 0.83 0.72 0.69 0.85 0.73 0.78 0.76 1
P21 0.69 0.72 0.78 0.74 0.73 0.74 0.68 0.63 0.65 0.74 0.72 0.7 0.77 0.69 0.73 0.78 0.78 0.81 0.77 1
The derived UPGMA dendrogram illustrated in Figure 5 has clustered the 20 populations into five main groups. The three first groups, labeled (I, II), successively, consisted of P21: Xinjiang Daye (Provence Chine) and P20: Stiftimia (Provence Kébili). The third group labeled (III) consisted of P2: Chenchou, P3: Tboulbou, P6: Chenenni 3, P8: Ghannouch and P9: Zerkine (Provence Gabès), P17: Elgolaa (Provence Kébili). The fourth group labeled (IV) consisted of P1: Kattana, P4: Chenenni 1, P5: Chenenni 2, P7: Metwia (Provence Gabès), P10: Essdada, P12: Dgach and P13: Hamma Jerid (Provenance Tozeur) and P18: Limaguess (Provenance Kébi-li). Finally the last group (V) consisted of tow populations: P15: Nouael and P16: Jersine (Provence KébiKébi-li).
To evaluate the information contained in this experimental data, correspondence factorial analysis (CFA) was applied considering all the monomorphics and polymorphics bands obtained simultaneously by the 5 ISSR pri-mers (Figure 6). The first 2 axis accounted for 45.07%. Axis 1 explained 24.60% of the inertia, however the axis 2 explained 20.47% of the inertia. The dispersion of alfalfa populations on the plan defined by axes 1 and 2 showed five clusters of populations (I, II, III, IV and V). Theses clusters were similar to these obtained by the dendrogram illustrated in Figure 4 and contained the same populations. Grouping of lucerne genotypes using CFA confirmed the result obtained using UPGMA method based on ISSR data. Tunisian and Chinese alfalfa populations were clustered independently of both geographic origins.
4. Discussion
Figure 5. Dendrogram of the 20 Tunisian and Chinese alfalfa populations constructed by UPGMA methods using the similarity matrix generated by the Jaccard coefficient based on ISSR marker.
[image:10.595.186.443.490.697.2]20 populations of Tunisian and Chinese alfalfa. However in both of RAPD and ISSR markers, a set of 20 popu-lations were analyzed in this study (Table 1). A total of 10 primers were screened for RAPD and ISSR PCR analysis. They were useful for characterizing the samples and produced strongly amplified polymorphic bands. The selected primers generated an appropriate amplification pattern with clear, consistent, and reproducible bands. In the present study the total number of amplified bands for RAPD markers was 44 of which 22 were polymorphic. Moreover, the average polymorphism displayed by this marker was 50%. Many reports have been documented regarding genetic diversity of Medicago sativa L. using RAPD markers [8]-[13].
However, the total number of amplified bands for ISSR markers was 51 of which 32 were polymorphic. Moreover, the average polymorphism displayed by this marker was 64.7% however, nothing is know about the genetic diversity available within or between alfalfa populations based on ISSR marker except the previous study concerning the genetic diversity of some Mediterranean alfalfa populations (Medicago sativa L.) using ISSR marker [35].
The total variability that may be due, mainly, to interaction of several factors; 1) The reproductive aspect of the alfalfa (outcrossing); 2) the uncontrolled introduction of the varieties improved in Tunisia [36]; and 3) the insufficiency of the seeds [2].
The average polymorphism displayed by ISSR (64.7%) was higher than that by RAPD (50%), which sug-gested that the ISSR markers were superior to RAPD markers in the capacity of revealing more informative bands in a single amplification. ISSR markers proved, however, to be more useful, due to the high polymorphic percentage between alfalfa populations. ISSR results are more realistic comparing to RAPD results. Researchers who have compared RAPD and ISSR methods have found that ISSR markers exhibit higher levels of polymor-phism or reproducibility compared with RAPD markers [37]-[40].
The dendrogram obtained by the Unweighted Pair Grouped of aggregation (Method Average (UPGMA) based on Jaccard distance and the Correspondance Factorial Analysis revealed a considerable variability be-tween populations. However these analyses based on RAPD or ISSR markers showed respectively seven and five clusters of alfalfa populations. In the majority of group, the populations were different provinces. Genetic diversity observed in our analysis is not structured according to the geographic origins of population because the groups obtained in a classification aren’t related to provinces. Benabderrahim et al. [2] show that the distribution of twenty cultivated populations of lucerne (Medicago sativa L) collected from different oasis of Tunisian south and evaluated for morphology and yield is not according to their geographic origins.
5. Conclusion
The results obtained here showed the possibility of genetic diversity analysis of alfalfa populations, based on dominant RAPD and ISSR markers treated with UPGMA method. RAPD and ISSR tools are very important for explaining genetic diversity and alfalfa population structures. The observed differences between studied popula-tions should be studied further using other molecular approaches such as: RFPL, AFLP and SSR, these markers could be used in breeding program for improving vegetative and reproductive traits and to detect QTL (quantita-tive traits locus) for physiological traits related to abiotic stress adaptation.
References
[1] Julier, B., Huyghe, C. and Ecalle, C. (2000) Within- and Among-Cultivar Genetic Variation in Alfalfa: Forage Quality, Morphology and Yield. Crop Science, 40, 365-369. http://dx.doi.org/10.2135/cropsci2000.402365x
[2] Riday, H., Brummer, E.C., Campbell, T.A., Luth, D. and Cazcarro, P.M. (2003) Comparison of Genetic and Morpho-logical Distance with Heterosis between Medicago sativa Subsp. sativa and Subsp. falcata. Euphytica, 131, 37-45. http://dx.doi.org/10.1023/A:1023050126901
[3] Benabderrahim, M.A., Haddad, M. and Ferchichi, A. (2009) Diversity of Lucerne (Medicago sativa L.) Populations in South Tunisia. Pakistan Journal of Botany, 41, 2851-2861.
[4] Guines, F., Julier, B., Ecalle, C. and Huyghe, C. (2003) Among- and Within-Cultivar Variability for Histological Traits of Lucerne (Medicago sativa L.) Stem. Euphytica, 130, 293-301. http://dx.doi.org/10.1023/A:1022885320517
[5] Jenczewski, E., Prosperi, J.M. and Ronfort, J. (1999) Evidence for Gene Flow between Wild and Cultivated Medicago
sativa (Leguminosae) Based on Allozyme Markers and Quantitative Traits. American Journal of Botany, 86, 677-687.
http://dx.doi.org/10.2307/2656577
Means of Bio-Agronomic Characters and Amplified Fragment Length Polymorphism Analyses. Plant Breed, 122, 1-65. http://dx.doi.org/10.1046/j.1439-0523.2003.00750.x
[7] Julier, B., Flajoulot, S., Barre, P., Cardinet, G., Santoni, S., Huguet, T. and Huyghe, C. (2003) Construction of Two Genetic Linkage Maps in Cultivated Tetraploid Alfalfa (Medicago sativa) Using Microsatellite and AFLP Markers.
BMC Plant Biology, 3-9.
[8] Brouwer, E.C., Bouton, J.H. and Kochert, G. (1995) Analysis of Annual Medicago Species Using RAPD Markers.
Genome, 38, 362-367. http://dx.doi.org/10.1139/g95-047
[9] Crochemore, M.L., Huyghe, C. Kerlan, M.C. Durand, F. and Julier, B. (1996) Partitioning and Distribution of RAPD Variation in a Set of Populations of the Medicago sativa Complex. Agronomy, 16, 421-432.
http://dx.doi.org/10.1051/agro:19960702
[10] Crochemore, M.L., Huygeh, C. and Julier, B. (1998) Structuration of Alfalfa Genetic Diversity Using Agronomic and Morphological Characteristics. Relationship with RAPD Markers. Agronomy, 18, 79-94.
http://dx.doi.org/10.1051/agro:19980106
[11] Mengoni, A. Gori, A. and Bazzicalupo, M. (2000) Use of RAPD and Microsatellite (SSR) Variation to Assess Genetic Relationships among Populations of Tetraploid Alfalfa, Medicago sativa. Plant Breeding, 119, 311-317.
http://dx.doi.org/10.1046/j.1439-0523.2000.00501.x
[12] Jenczewski, E., Prosperi, J.M. and Ronfort, J. (1999) Differentiation between Natural and Cultivated Populations of
Medicago sativa (Leguminosae) from Spain: Analysis with Random Amplified Polymorphic DNA (RAPD) Markers
and Comparison to Allozymes. Molecular Ecology, 8, 1317-1330. http://dx.doi.org/10.1046/j.1365-294X.1999.00697.x
[13] Dehghan-Shoar, M.J.G., Hampton, J.G. and Gardiner, S.E. (1997) Genetic Analysis among and within Populations Forming Ecotypes and Cultivars of Lucerne, Medicago sativa (Leguminosae), Using RAPD Fragments. Plant
Syste-matics and Evolution, 208, 107-119. http://dx.doi.org/10.1007/BF00986085
[14] Brouwer, E.C., Bouton, J.H. and Kochert, G. (1993) Development of an RLFP Map in Diploid Alfalfa. Theoretical and
Applied Genetics, 86, 329-332.
[15] Pupilli, F., Businelli, S., Paolocci, F., Scotti, C., Damiani, F. and Arcioni, S. (1996) Extent of RFLP Variability in Te-traploid Populations of Alfalfa, Medicago sativa. Plant Breeding, 115, 106-112.
http://dx.doi.org/10.1111/j.1439-0523.1996.tb00883.x
[16] Kidwell, K.K., Austin, D.F. and Osborn, T.C. (1994) RFLP Evaluation of Nine Medicago Accessions Representing the Original Germplasm Sources for North American Alfalfa Cultivars. Crop Science, 34, 230-236.
http://dx.doi.org/10.2135/cropsci1994.0011183X003400010042x
[17] Brummer, E.C., Kochert, G. and Bouton, J.H. (1991) RFLP Variation in Diploid and Tetraploid Alfalfa. Theoretical
and Applied Genetics, 83, 89-96. http://dx.doi.org/10.1007/bf00229230
[18] Diwan, N., Bhagwat, A.A., Bauchan, G.R. and Cregan, P.B. (1997) Simple Sequence Repeat (SSR) DNA Markers in Alfalfa and Perennial and Annual Medicago Species. Genome, 40, 887-895. http://dx.doi.org/10.1139/g97-115
[19] Flajoulot, S., Ronfort, J., Baudouin, P., Barre, P., Huguet, T., Huyghe, C. and Julier, B. (2005) Genetic Diversity among Alfalfa (Medicago sativa) Cultivars Coming from a Breeding Program, Using SSR Markers. Theoretical and
Applied Genetics, 111, 1420-1429. http://dx.doi.org/10.1007/s00122-005-0074-4
[20] Li, P., Wang, Y., Sun, X. and Han, J. (2009) Using Microsatellite (SSR) and Morphological Markers to Assess the Genetic Diversity of 12 Falcata (Medicago sativa spp. falcata) Populations from Eurasia. African Journal of
Biotech-nology, 8, 2102-2108.
[21] Williams, J.K., Kubelik, A.R., Livak, K.J., Rafalski, J.A. and Tingey, S.V. (1990) DNA Polymorphisms Amplified by Arbitrary Primers Are Useful as Genetic Markers. Nucleic Acids Research, 18, 6531-6535.
http://dx.doi.org/10.1093/nar/18.22.6531
[22] Welsh, J. and McCeleand, M. (1990) Fingerprinting Genomes Using PCR with Arbitrary Primers. Nuclear Acids
Re-search, 18, 7213-7218. http://dx.doi.org/10.1093/nar/18.24.7213
[23] Beebee, T. and Rowe, G. (2004) An Introduction to Molecular Ecology. Oxford University Press, Oxford, 346 p.
[24] Ferreira, M.E. and Grattapaglia, D. (1998) Introductao ao uso de marcadores moleculares em angalise genetica. EMBRAPA-CENARGEN,220 p.
[25] Penner G.A., Bush, A., Wise, R., Kim, W., Domier, L., Kasha, K., Laroche, A., Scoles, G., Molnar, S. and Fedak, G. (1993) Reproducibility of Random Amplified Polymorphic DNA (RAPD) Analysis among Laboratories. Genome
Re-search, 2, 341-345. http://dx.doi.org/10.1101/gr.2.4.341
[26] Adams, R.P., Flournoy, L.E. and Pandey, R.N. (1998) Obtaining Reproducible Patterns from Random Polymorphic DNA Amplification (RAPDs). Taxon, 42, 553-571. http://dx.doi.org/10.2307/1222534
Polymerase Chain Reaction Amplification. Genomics, 20, 176-183. http://dx.doi.org/10.1006/geno.1994.1151
[28] Wolfe, A.D., Xiang, Q.Y. and Kephart, S.R. (1998) Assessing Hybridization in Natural Populations of Penstemon
(Scrophulariaceae) Using Hypervariable Intersimple Sequence Repeat (ISSR) Bands. Molecular Ecology, 7, 1107- 1125. http://dx.doi.org/10.1046/j.1365-294x.1998.00425.x
[29] Ruas, P.M., Ruas, C.F., Rampim, L., Carvalho, V.P., Ruas, E.A. and Sera, T. (2003) Genetic Relationship in Coffea
Species and Parentage Determination If Interspecific Hybrids Using ISSR (Inter-Simple Sequence Repeat) Markers.
Genetics and Molecular Biology, 26, 319-327. http://dx.doi.org/10.1590/S1415-47572003000300017
[30] Sambrook, J., Frithsch, E.F. and Maniatis, T. (1989) Molecular Cloning: A Laboratory Manual. 2nd Edition, Cold spring Harbor Laboratory, Cold Spring Harbor, New York, San Francisco.
[31] Jaccard, P. (1908) Nouvelles recherches sur la distribution florale. Bulletin de la Société Vaudoise des Sciences
Naturelles, 44, 223-270.
[32] Felsenstein, J. (1995) PHYLIP (Phylogeny Inference Package) Version 3.5. Department of Genetics, University of Washington, Seattle. Sneath, P.M.A. and Sokal, R.R. (1973) Numerical Taxonomy. W.H. Freeman and Company, San Francisco.
[33] Prevost, A. and Wilkinson, M.J. (1999) A New System of Comparing PCR Primers Applied to ISSR Fingerprinting of Potato Cultivars. Theoretical and Applied Genetics, 98, 107-112. http://dx.doi.org/10.1007/s001220051046
[34] Gilbert, J.E., Lewis, R.V., Wilkinson, M.J. and Galigari, P.D.S. (1999) Developing and Appropriate Strategy to Assess Genetic Variability in Plant Germplasm Collections. Theoretical and Applied Genetics, 98, 1125-1131.
http://dx.doi.org/10.1007/s001220051176
[35] Touil, L., Guasmi, F., Farès, K. and Ferchichi, A. (2007) Genetic Diversity of Some Mediterranean Populations of the Cultivated Alfalfa (Medicago sativa L.) Using ISSR Markers. Biotechnology, 7, 808-812.
http://dx.doi.org/10.3923/biotech.2008.808.812
[36] El Ghazzah, M. and Chalbi, N. (1995) Ressources génétiques et amélioration des plantes. In: Le progrès génétique
passe-t-il par le repérage des gènes, Ed AUPELF-UREF, John Libbey Eurotxt, Paris, 123-129.
[37] Fang, D.Q. and Roose, M.L. (1997) Identification of Closely Related Citrus Cultivars with Inter-Simple Sequence Re-peats Markers. Theoretical and Applied Genetics, 95, 408-417. http://dx.doi.org/10.1007/s001220050577
[38] Esselman, E.J., Jianqiang, L., Crawford, D.J., Windus, J.L. and Wolfe A.D. (1999) Clonal Diversity in the Rare
Cala-magrostis porteri ssp. insperata (Poaceae): Comparative Results from Allozymes and Random Amplified Polymorphic
DNA (RAPD) and Inter Simple Sequence Repeat (ISSR) Markers. Molecular Ecology, 8, 443-451. http://dx.doi.org/10.1046/j.1365-294X.1999.00585.x
[39] Parsons, B.J., Newburg, H.J., Jackson, M.T. and Fordlioyd, B.V. (1997) Contrasting Genetic Diversity Relationships Are Revealed in Rice (Orysa sativa L.) Using Different Markers Types. Molecular Breeding, 3, 115-125.
http://dx.doi.org/10.1023/A:1009635721319
[40] Qian, W., Ge, S. and Hong, D.Y. (2001) Genetic Variation within and among Populations of a wild Rice Oryza granu-lata from China Detected by RAPD and ISSR Markers. Theoretical and Applied Genetics, 102, 440-449.