http://dx.doi.org/10.4236/am.2016.79081
The Limitations of Polygenic Hypothesis and
Theorizing about Dual Multiple Factors and
Three Normal Distributions
Tingzhen Zhang
1, Xiaoming Jia
1, Zhao Xu
21College of Forestry, Northwest A&F University, Yangling, China 2College of Science, Northwest A&F University, Yangling, China
Received 2 April 2016; accepted 24 May 2016; published 27 May 2016 Copyright © 2016 by authors and Scientific Research Publishing Inc.
This work is licensed under the Creative Commons Attribution International License (CC BY).
http://creativecommons.org/licenses/by/4.0/
Abstract
The original data of Nilsson-Ehle experiment in wheat were analyzed with existent genetic knowl- edge. It indicated that the core of polygenic hypothesis from this experiment was that a character similarity produced by additive effect of multiple genes was the basis of continuous variation. Its precondition was for effective genes to have equal effect, to show merodominance and binomial distribution and to inherit independently. In fact, quantitative characters were determined by many genes with different property, effect and behavior. So it was difficult to solve all problems of continuous variation by the aid of polygenic hypothesis. The researchers should seek new ways. With Mendelian group as research object and by means of Lyapunov central limit theorem it was proved that both genotypic value G and the environmental effect in a niche E were subordinated to the normal distribution N
(
µ σG, G2)
and N(
µ σE, E2)
respectively. According to additivity of the normal distribution the phenotype P = G + E also obeyed the normal distribution P = G + E ~(
)
N µ σG, G2 +σE2 and quantitative characters showed continuous variation, whether or not the linkage was presented, whether or not every gene effect was equal, whether or not there were dominance and what kind of dominance between alleles. Moreover it was discussed that the quantitative characters in self-fertilized organism and clone were submitted to the normal distri- bution and presented continuous variation too.
Keywords
1. Introduction
Since publishing the results of Nilsson-Ehle wheat hybridization experiment, multiple factor or polygenic hypo-thesis which was researched alone starting with the organism itself has been prevailing so far for about 100 years. This research pointed out that polygenic hypothesis had some limitations, while adoptive scope of the theory of dual multiple factors and three normal distributions was wide.
2. The Core of Polygenic Hypothesis Is That the Character Similarity Produced by
Additive Effect of Multiple Genes Is the Basis of Continuous Variation
Quantitative characters show continuous variation, inheritance of which involves differences in the same trait of different individuals in a group [1]. F2 population by artificially crossing is the most simple population of
mul-tiple genotypes in ordinary crops and the most classic material of genetic research in quantitative traits is Nils-son-Ehle wheat hybridization experiment. As the wheat seed coat is 2n tissue of mother body, hybrid grain color is determined by her genotype. When a very dark red variety was crossed with a white variety, the color of seed borne by F1 plants (F2 seed color) is constant red [2]. Many experts in the world have made mistakes in this field
to this day [1] [3]-[6]. In fact, the hereditary manner in wheat and other crops is the same, but the separation in wheat grain color is delayed a generation than crops such as garden peas. And parental genetic makeup can be deduced from separation of the offspring traits. Understanding these is important for the researchers to discuss Nilsson-Ehle wheat hybridization experiment and to study quantitative traits inheritance.
In 1900s, Nilsson-Ehle crossed a very old red variety with a white variety in wheat, he got 78 plants of F2
generation offspring of which segregated differently in grain color [2] [7]. It was pity that he did not obtain the expected pure white, but this did not affect the scientific value of this experiment and his greatness.
Among 78 plants of F2 generation, 0 plant the offspring of which were constant white should be consisted of
recessive genes. 8 plants the offspring of which were segregating reds and whites in the ration 3:1 had the dif-ferences of one pair of dominant-recessive genes and the reds were similar to that of 3 items of the rest, from the shallow to the deep, grouping them was difficult and they showed continuous variation.
The continuous variation is based on the similarity of characters [8]. According to existent genetic knowledge, in inheritance of 2 pairs of genes, only the hair color of pig [3] and fruit shape of pumpkin [4] and so on show the similar characters, when 2 kinds of dominant genes exist simultaneously or any one of both exists respec-tively. This is because they are determined by 2 pairs of independent genes so that in 16 combinations from 4 male and female gametes the result is produced by additive effect of dominant genes. In fact, the inheritance in wheat variety which has 2 pairs independent alleles for presence of red color in seed coat is in this way [9]. If the similar traits are merged, hair color of pig into the brown, fruit shape of pumpkin into the nearly spherical and grain color of the wheat into the red, their phenotype in separation generation is in the ration 15:1 [8]. It is easy to infer that in this experiment 15 plants of F2 generation the offspring of which were segregating reds and
whites in the ration 15:1 had the differences of 2 pairs of domination-recessive genes, 5 plants the offspring of which were segregating 63:1 consisted of 3 pairs of dominant-recessive genes. 50 plants the offspring of which were constant red started from individuals containing 1 pair of homozygous dominant genes, increasing domi-nant gene one by one, to homozygote containing 3 pairs of domidomi-nant genes, namely individuals contained 1 pair of homozygous dominant genes at least. Thus it can judge initially that red color in the seed coat of a very old red variety is determined by 3 pairs of genes and gene effect is equal [9] and additive.
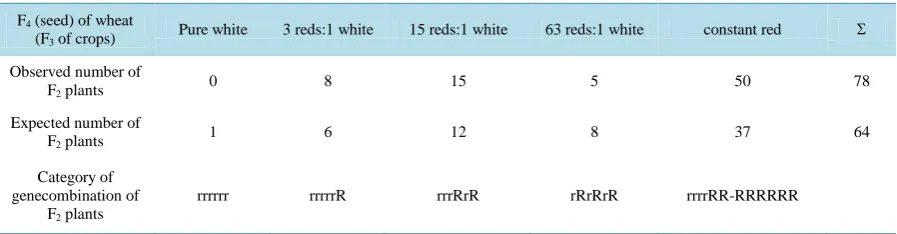
In accordance with the inheritance of 3 pairs of independent genes of crops such as garden peas and seeing the ration of segregation of genotypes and phenotypes and analyzing them with additive effect, the theoretical plant number of F2 generation is 1, 6, 12, 8 and 37 out of a total of 64 plants depending on category of gene
combina-tion, that is, on type of additive effect [4], but the segregation in grain color of the wheat offspring is delayed a generation. The expected ration of the segregation in grain color of F3 generation of crops [7] and the ration of
segregation of F4 generation of wheat [2] are the same. These results and their analysis are tabulated below (see Table 1).
2 8.110
χ = is consistent with expectation, P-value = 0.088. It is thus clear that red color in the seed coat of a very old red variety is determined really by 3 pairs of genes which are dominant, namely AABBCC and geno-types of F2 group show binomial distribution with the exponent being 2 × 3 depending on the number of
Table 1. Analysis of additive effect of dominant genes in the inheritance in wheat grain color.
F4 (seed) of wheat
(F3 of crops) Pure white 3 reds:1 white 15 reds:1 white 63 reds:1 white constant red Σ
Observed number of F2 plants
0 8 15 5 50 78
Expected number of F2 plants
1 6 12 8 37 64
Category of genecombination of
F2 plants
rrrrrr rrrrrR rrrRrR rRrRrR rrrrRR-RRRRRR
Notice that r stand for gene a or b or c, R-A or B or C correspondingly.
quantitative character inheritance and gave the immortal contribution to genetics. From setting out independent inheritance in controlled cross, polygenic hypothesis uses for effective genes to have equal effect, to show me-rodominance and binomial distribution as a prerequisite to engage in genetic analysis of quantitative characters
[7] [9] and also puts forward these limited condition for this reason. Melntosh (1973) further studies demon-strated that in the nature there were 15 wheat varieties with 3 pairs of red alleles and red alleles are 3 pairs at the very most [2]. So this experiment only expended from 2 pairs to 3 pairs in additive effect of dominant genes, it is sufficient to elaborate the inheritance in wheat grain color and so on, but to solve the continuity of all quan-titative characters need to practice more. In addition, Nilsson-Ehleh did not study environment effect. Later more experts pointed out that many quantitative characters such as height, weight, milk production in dairy cat-tle, body conformation in beef cattle were determined by many genes [6], even dozens of genes and affected easily by environmental impact. Their continuity can not be solved by additive effect alone and this need to make new idea and new method appear urgently [3]. The development of related disciplines, such as population genetics and mathematics also laid a foundation for the emergence of the new theory.
3. The Random Mating in Mendelian Population Makes the Property, Effect and
Behavior of Many Genes Determining Quantitative Characters Be Different
and Various
effec-tive genes Ra ≠ Rb≠ R1≠ R2≠ R. Many of these are contrary to polygenic hypothesis and the effective genes
show not all the binomial distribution. Even if the binomial distribution is as ideal as wheat, that also belongs to discrete distribution rather than a continuous distribution strictly in terms of mathematics [26] so that it is diffi-cult to solve the problem of continuity of all quantitative characters with polygenic hypothesis. Thus, it is only with the aid of central limit theorem involving many different genes the effects of which are not equal certainly and constituting normal distribution that this problem can be solved [27]. It was unfortunate that central limit theorem was developed and perfected further in the 1920s [28], it was later than Nilsson-Ehle research about 10 years.
4. Dual Multiple Factors Have Genotypic Value G, Environmental Effect E and
Phenotype P = G + E All Be Submitted to the Normal Distribution
Genotypes determine the dimension of phenotype of some quantitative character of a individual with genotypic value which refers to the sum of the effect of all genes which determine the characters of a individual on every locus [11] [14]. Because the epistasis is not very important, it can be ignored [11] [14] [29], the genotypic value is the sum of additive effect and dominant effect on many loci [11] [14]. Let G stand for the genotypic value, and Gi stand for the contribution of i-locus to the genotypic value, then,
1 2
G=G +G ++Gn
According to Ayala’s further study, the gene effect on a identical locus and different loci is not equal certainly
[25], even so and even including the effect of modern transgene which is in the ascendant, the aforementioned mathematical model is right. It is important that the study here is limited in a Mendelian population. In random mating the contribution of different loci is independent of each other, whether or not the linkage is presented [16] [29]. In terms of makeup of genotypic value, additive effect is the cumulative effect between alleles and nonal-leles and belongs to the simple addition, the contribution on every locus is independent; while dominance, me-rodominance and over dominance play a part in the identical locus respectively so that the contribution on loci occupied by the dominant gene is also independent [8]. In addition, additive effect and dominant effect are in-dependent of each other [29]. On the basis of Lyapunov central limit theorem [27], when the number of loci n is large sufficiently, genotypic value is submitted to the normal distribution
(
2)
G, G
N µ σ . Here, in addition to in-dependence of the contribution of different loci, no attaching it any condition, as long as the loci be more. And the genes on every locus operate according to three Law of inheritance.
Another component of phenotype of quantitative character is environmental effect in a niche E [11] [14], also called environmental deviation. The organism grows in a certain environment. The environmental effect is a re-sult of the combined action of many factors. Each factor makes a contribution to environmental effect in a niche Ei, so
1 2
E=E +E + + En
In terms of probability theory, the action of environment factors in a niche, at least the action of quiet a num-ber of factors can be considered as independent statistically. Even though water as a medium can compensate the shortage of fertilizer, fertilizer also can compensate the lack of it, when plants synthesize carbohydrate by its important role photosynthesis, only 6 water molecules and 6 carbon dioxide molecules synthesize a glucose [30]. Water and carbon dioxide here are not replaced by the other, their action is independent. The independence of nutrient elements is more outstanding, 16 kinds of which are necessary and are not replaced [30], their action is independent.
to research environmental effect in a niche with central limit theorem [15] [27]. According to Lyapunov central limit theorem, the environmental effect in a niche E is submitted to the normal distribution
(
2)
E, E
N µ σ .
Phenotype P = G + E. Genotypic value G depends on the number of gene loci n and their contribution Gi, in
essence, like three Law, it is completed by a series of genetic processes including gene separating and recom-bining to form gametes and zygotes. So it has nothing to do with the E. And Environmental effect E is decided by light, temperature, water and other factors and is not related to the G. G and E are independent of each other
[15]. In practice, in Mendelian population individual distributes at random, different genotype occurs with dif-ferent frequencies and genotypic value is a random variable which is changing along with genotype and its fre-quency in the population. And the environment occupied by individuals is randomized natural condition and is not “special environment” according to which occupied respectively by each individual they are not grouped, so environmental distribution are not determined by genotype. But also the regional characteristics of the Mende-lian population make environment in a niche is no more in the nature of so-called ‘treatments’ in mathematical statistics. Since a Mendelian population on environment would not generally encounter so wide a range of envi-ronments as that provided by the different treatments. Moreover the environmental variation in a niche arises from only a small-scale fluctuation in natural condition. So interrelation and interaction of G and E are very weak and can be ignored, G and E are independent of each other [8] [29] [36] [37]. According to additivity of the normal distribution,
(
2 2)
G E G E
P=G+E ~ N µ +µ σ, +σ . (1)
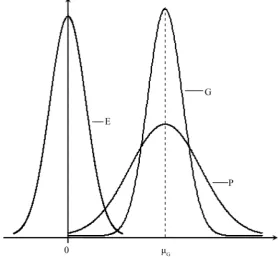
Because P = G + E, E = P − G. Like error compensation, the mean environmental deviation in the group as a whole is adopted as 0 [36], that is, the mathematical expectation of environmental effect in a Mendelian popula-tion µ =E 0, then
(
2 2)
G G E
P=G+E ~ N µ σ, +σ
The distribution of P, G, E and their relationship are diagrammed asFigure 1.
[image:5.595.173.452.443.702.2]This shows that in the nature, phenotype of quantitative characters of creature in random mating Mendelian population P is submitted to the normal distribution and quantitative characters show continuous variation, whether or not the linkage was presented, whether or not every gene effect was equal, whether or not there were
dominance and what kind of dominance between alleles. For example, as far as the body height of the Chinese people is concerned, the man’s is normal distribution taking 1.69 m for numerous number, while 1.62 m for the woman’s. The allogamous rate within tree species forming forest is as high as 95% [38] and between the species there is reproductive isolation so that the quantitative characters in pure forest and mixed forest show the normal distribution depending on the species. The example of the former is diameter distribution in young forest of Pi-nus khesiya var. langbinaensis [39] and the example of the latter is respective height and diameter distribution in mixed forest of Pinus massoniana and Gordonia kwangsiensis [40]. Thereby more and more geneticists who follow mathematicians think that the characteristics of quantitative characters are continuous variation with type of normal distribution [3] [25].
5. Normal Distribution of Environmental Effect Let Quantitative Characters of
Clone and Self-Fertilized Plant Also Be in This Way
From formula (1) it is deduced easily that the quantitative character of clone and organism genotype of which is identical shows the normal distribution. Set their genotypic value is constant c,
Because P= + = +G E c E
(
2)
E
E ~N 0,σ
So
(
2)
E
c+E ~N c+0,σ
So got
(
2)
E
P=G+ = +E c E ~N c,σ . (2)
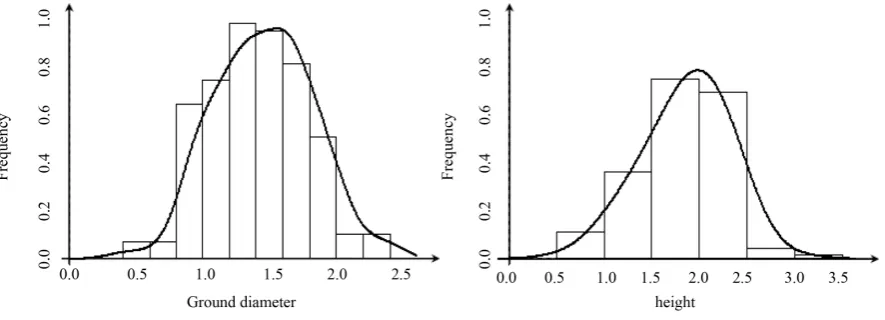
Authors investigated and studied nursery stock produced by cuttings of N.105 clone of Populus × tomentosa
in central nursery of Xian city. The sample frequency histogram and density estimation curve of their ground diameter and height are shown inFigure 2.
The normality of the diameter and height of nursery stock is tested with Shapiro-wilk’s method respectively. Statistic value W = 0.988, P-value = 0.251 for ground diameter, W = 0.985 and P-value = 0.098 for Height, the ground diameter and height of nursery stock of N.105 clone all show the normal distribution. Eucalyptus clone diameter reported by Chen Yongfu, the diameter grade of different clone of Eucalyptus forest crop with various density reported by Li Fushen and the wood fiber length of clones of Sect. Aigeiros reported by Wu Heng all show the normal distribution too [41]-[43].
[image:6.595.94.537.541.701.2]Selfing, that is, self-fertilization is of great significance for plant. Self-pollinated plants are generally very pure in heredity, so to speak, their genotypes are almost homozygous [22] [23] [44]. From formula (2) it can be known that the quantitative characters of self-pollinated plant show the normal distribution depending on the genotype (pure line). Some species of self-pollinated plant have several pure lines and every pure line is inde-pendent of each other, so the quantitative characters in the population with these pure lines show the normal dis-tribution according to additivity of normal disdis-tribution too. The constituent of P. × tomentosa is the same to self- pollinated plant with many lines. It is tree species which is cultured by mixing many clones [45] and its diameter in forest crop shows the normal distribution [46].
6. Conclusion
The theory of dual multiple factors and three normal distributions has a wider scope of application than poly-genic hypothesis. It demonstrates that the quantitative characters of creature in the nature including the cross- pollinated, the self-pollinated, organism with identical genotype and clone are submitted to the normal distribu-tion and show continuous variadistribu-tion, whether or not the linkage was presented, whether or not every gene effect was equal, whether or not there were dominance and what kind of dominance between alleles in their inherit-ance. The practical significance of the theory of dual multiple factors and three normal distributions also lies in emphasizing that like genotype of variety, the environmental effect is one of important constituents of pheno-type of quantitative character, and its contribution to phenopheno-type of some organisms can account for 51% [36]. To carry out special research on cultivation technology for every variety and to increase the contribution share of environmental effect have great potential to promote the development of production and will cause the revolu-tionary change.
References
[1] Shen, D.X. and Lin, B.N. (1985) Horticultural Plant Genetics. Agriculture Press, Beijing, 155-177. (In Chinese)
[2] Zhao, H.Z., Wang, J.L. and Wang, J.Z. (1987) Crop Breeding. Agriculture Press, Beijing, 261-272. (In Chinese)
[3] Xu, J.L., Xu, Q. and Chen, C. (2004) Modern Genetics Principle. Science Press, Beijing, 97-100. (In Chinese)
[4] Ji, D.F., Mi, J.J., Xu, Q.F., et al. (1987) Genetics. Agriculture Press, Beijing, 34-98. (In Chinese) [5] Liu, Z.D. and Jian, S.H. (1985) Genetics. Higher Education Press, Beijing, 215-222. (In Chinese) [6] Crow, J.F. (1976) Genetics Notes. 7th Edition, Burgess Publishing Company, Minneapolis, 161-202.
[7] Nilsson-Ehle, H. (1909) Kreuzungsuntersuchungen an hafer und Weizen. Lunds Universitets Arsskrift. East E M. Referate, 280-291.
[8] Zhang, T.Z. (2015) Three Normal Distributions—A New Solution for Theory on Quantitative Inheritance. Anhui Agriculture Science, 34, 4-6. (In Chinese)
[9] Jiao, T., Zhong, S.L., Gao, Q., et al. (1984) Plant Breeding. Hunan Science and Technology Press, Changsha, 8-59. (In Chinese)
[10] Hardy, G.H. (1908) Mendelian Proportion in Mixed Population. Science, 28, 49-50. http://dx.doi.org/10.1126/science.28.706.49
[11] Ma, Y.H. (1980) Foundations of Quantitative Genetics for Plant Breeding. Jiangsu Science and Technology Press, Nanjing, 21-118. (In Chinese)
[12] Li, B.S. and Hu, Q.B. (1991) Genetics. Nankai University Press, Tianjin, 469-513. (In Chinese)
[13] Yan, G.Q. and Gao, G. (2001) Genetics. Science Press, Beijing, 227-254. (In Chinese)
[14] Liu, L.F., Mao, S.X. and Huan, Y.Z. (1984) Quantitative Genetics in Crops. Agriculture Press, Beijing, 1-80. (In Chi-nese)
[15] Jia, X.M., Zhang, T.Z. and Zhang, H.L. (2014) Analysis on the Inheritance in a Mendelian Population by Means of Probability Theory. Journal of Northwest Forestry University, 29, 106-110. (In Chinese)
[16] Li, C.C. (1981) Population Genetics. Agriculture Press, Beijing, 1-394. (In Chinese)
[17] Zhang, J.M. (2005) Modern Genetics. Chemical Industry Press, Beijing, 324-335. (In Chinese)
[18] Zhang, G.F. and Zhou, Y.J. (2006) Genetics. Chemical Industry Press, Beijing, 181-201. (In Chinese)
[19] Guo, P.Z. (1993) Introduction to Population Genetics. Agriculture Press, Beijing, 158-191. (In Chinese)
[20] Dobzhansky, T. (1951) Genetics and the Origin of Species. 3rd Edition, Columbia University Press, New York, 1-18.
[21] Suzuki, D.T., Griffiths, A.J.F. and Lewontin, R.C. (1981) An Introduction to Genetic Analysis. 2nd Edition, San Fran-cisco, 123-151. (In Chinese)
[22] Fang, Z.X. (1984) General Genetics. Science Press, Beijing, 64-351. (In Chinese)
[23] Qian, D.Q., Bian, L.Q. and Chen, C.Y. (1982) Genetics Foundations and Breeding Principle. Agriculture Press, Beijing, 36-125. (In Chinese)
[24] Genetics and Breeding Team (1984) A Concise Course in Genetics and Breeding in Crop. Zhejiang Agriculture Uni-versity, Agriculture Press, Beijing, 60-75. (In Chinese)
Chinese)
[26] Lin, S.G. (1978) Foundation of Probability Theory and Mathematical Statistics. People’s Education Press, Beijing, 12-130. (In Chinese)
[27] Sheng, Z., Xie, S.Q. and Pan, C.Y. (2011) Probability Theory and Mathematical Statistics. 4th Edition, Higher Educa-tion Press, Beijing, 20-120. (In Chinese)
[28] Yang, J. and Den, M.L. (2013) Foundation and Development on Central Limit Theorem. Science (Shanghai), 65, 57- 59. (In Chinese)
[29] Bulmer, M.G. (1980) The Mathematical Theory of Quantitative Genetics. Clarendon Press, Oxford, 1-128.
[30] Wang, S.S., Gao, R.F. and Wu, G.M. (1991) Plant Physiology. 2nd Edition, Forestry Press of China, Beijing, 211-215. (In Chinese)
[31] Hu, X.B., Sun, H.X. and Wang, L.X. (2004) Probability Theory Mathematical Statistics Random Process. Posts and Telecommunications University of Beijing Press, Beijing, 188-203. (In Chinese)
[32] Ye, Y., Li, P. and Liu, X.M. (2000) Probability Theory and Mathematical Statistics. Huazhong Polytechnic University Press, Wuhan, 158-161. (In Chinese)
[33] Li, X.P. (2010) Foundation of Probability Theory. China Higher Education Press, Beijing, 345-346. (In Chinese)
[34] Ye, E.H. and Zhang, D.P. (2005) Probability Theory and Random Process. Science Press, Beijing, 105-136. (In Chi-nese)
[35] Meyer, B.S., Anderson, D.B., Bohning, R.H., et al. (1979) Foundation of Plant Physiology. Agriculture Press, Beijing, 462-464. (In Chinese)
[36] Falconer, D.S. (1960) Introduction to Quantitative Genetics. Oliver and Boyd Ltd., Edinburgh, 1-140.
[37] Falconer, D.S. (1981) Introduction to Quantitative Genetics. 2nd Edition, Longman Group Ltd., London, 1-133.
[38] Nanjing Forestry University (1982) Genetics and Breeding in Tree. Science Press, Beijing, 232-254. (In Chinese)
[39] Zhang, W.Y. (2011) Study on the Diameter Distribution Laws of Young and Middle Aged Pinus kesiya var. langbia-nensis Plantation. Anhui Agriculture Science, 13, 7736-7737, 7740. (In Chinese)
[40] Zhou, L.J., Cai, F.L. and Pan, F.M. (1993) A Study of Coniferous and Broad-Leaved Mixed Forest Structure of Pinus massoniana and Gordonia kwangsiensis. Sichuan Science and Technology of Forestry, 14, 16-25. (In Chinese) [41] Chen, Y.F. (2008) A Study on Diameter Distribution Model in Fast-Growing Eucalypt Plantation. China Forestry
Science Research (Extra Edition), 21, 50-54. (In Chinese)
[42] Li, F.S., Lu, M.F., Peng, X.D., et al. (2015) A Study on Clone Growth and Economic Effect in Eucalypt Plantation with Different Density in Guizhong Region. ChinaForestry Science and Technology of Guangdong Province, 1, 56-60. (In Chinese)
[43] Wu, H., Cha, C.S., Wang, Q.G., et al. (2011) Morphological Trait and Variation of Wood Fiber in Poplar Plantation with 12 Clones. Journal of North-East Forestry University, 39, 8-10. (In Chinese)
[44] Johannsen, W. Heredity in Populations and Pure Lines—A Contribution to the Solution of the Outstanding Questions in Selection. Translated from Ueber Erblicbkeit in Populationen und in Reinen Linien, Published by Gustav Fischer Jena, 1903. In Classic Papers in Genetics. Edited by Peters, J.A., Prentice-Hall, Inc., 1959, 20-26.
[45] Zhang, T. and Copes, D.L. (1995) Genetic Analysis on the Hybrid Origin of Populus Tomotosa Carr. Silvae Genetica, 44, 443-451.
[46] Bi, J. and Zhang, G.X. (1999) A Study on the Law of Diameter Structure in Forest Crop of Populus × tomoentosa.