Mining High Utility Patterns based on Improved Utility Pattern Tree
Ms. Vishakha V. Prabhu
Department of Computer Science & Engineering
Annasaheb Dange College of Engineering & Technology, Ashta, India
Abstract— Mining high utility item sets means finding theitem sets with high profits. The product of its external utility and its internal utility is called as utility of an item set. An item set is referred to a high utility item set if its utility is no less than a user-specified minimum utility threshold or else it is called a low-utility item set. High utility item sets mining identifies item sets whose utility satisfies a given threshold. In this paper, High Utility Patterns from input datasets is found by studying D2HUP algorithm and this algorithm is implemented by using datasets food mart and chain store. Also, D2HUP algorithm is compared with the CHUD algorithm by checking following parameters: HUI count, Memory usage and time required.
Key words: High Utility Mining, Data Mining, High Utility Itemset
I. INTRODUCTION
Mining high utility itemsets means to find the itemsets having high profits. In a transaction database the utility of items consists of two parts:
1) The importance of distinct items, which is called external.
2) The importance of items in transactions, which is called internal utility.
The product of its external utility and its internal utility is called as utility of an itemset. If utility of item is no less than a user-specified minimum utility threshold then an itemset is called as high utility itemset. Otherwise, it is called as low-utility itemset.
High utility itemsets mining finds out the itemsets whose utility satisfies a given threshold. High utility itemsets mining helps in decision- making process of many applications, such as retail marketing and Web service, as the items are different in many aspects in real applications.
Data mining task means finding interesting patterns and is important. It has a variety of applications like genome analysis, condition monitoring, cross marketing, and inventory prediction, where interestingness measures [8], [9], [10] play an important role.
With frequent pattern mining [11], [12], [13], [14] if its occurrence frequency exceeds a user specified threshold a pattern is regarded as interesting.
E.g. mining frequent patterns from a shopping transaction database means discovering the sets of products that are frequently purchased together by customers. However, a user’s interest may be dependent on many factors which may not necessarily be expressed in terms of the occurrence frequency.
For example, a manager in the supermarket may be interested to find combinations of products with high profits or revenues, which relate to the unit profits and purchased quantities of products which are not included in the frequent pattern mining. Utility mining [10] emerged recently in order to address the limitation of frequent pattern mining by
considering the user’s expectation or goal along with the raw data.
The speed of development of database techniques helps in the storage and usage of massive data from business corporations, governments, and scientific organizations. The high utility item set mining problem is one of the most important from the famous frequent item set mining problem. Traditional frequent item set mining algorithms cannot evaluate the utility information about item sets.
In a database of supermarket, each item has a distinct price/profit and a transaction is associated with a distinct quantity.
An item set with high support may have low utility: Transaction Support
Egg, Bread 10 Beef, Pork 5
Table 1.1: Itemset with high Support and low Utility & Vice Versa
II. LITERATURE SURVEY
This section based on survey of literature indicates some facts based on work of many authors, which is as follows.
A. Mining High Utility Patterns in One Phase without Generating Candidates.
Junqiang Liu, Ke Wang and Benjamin C.M. Fung, Senior Member, IEEE [1] suggested that utility mining is a new development of data mining technology. The limitation of two-phase approach is its scalability issue due to the large number of candidates. This paper proposes a novel algorithm which finds high utility patterns in a single phase without generating candidates. In this paper, pattern growth approach is to search a reverse set enumeration tree and to prune search space by utility upper bounding.
B. Utility Pattern Mining Algorithm Based on Improved Utility Pattern Tree
Shuning Xing1, Fangai Liu1, Jiwei Wang1, Lin Pang1, ZhenguoXu2[2] proposed UP-Growth which is one of the most discussed high utility pattern mining algorithms based on the data structure of UP-Tree. The process of construction of UP trees needs to scan the database many times and spends much of the time in calculating. Database.
C. High Utility Itemsets mining using Direct Discovery HUP in one phase
In this paper reverse set enumeration tree is searched and pruning is done on search space by utility upper-bounding tree and then look ahead strategy is used to identify HUP with enumeration by closure and singleton property.
D. Direct Discovery of High Utility Item sets without Candidate Generation.
Junqiang Liu, Ke Wang, Benjamin C. M. Fung [4] proposes in this paper that a high utility item set growth approach is proposed that works in a single phase without generating candidates. Also, internal utility, external utility, final utility, Transaction weighted Utility is calculated.
E. Efficient Algorithms for Mining High Utility Item sets from Transactional Databases
Vincent S. Tseng, Bai-EnShie, Cheng-Wei Wu,and Philip S.Yu,Fellow, IEEE[5]proposes in their article that there is a problem in producing a large number of candidate item sets. Such a large number of candidate item sets degrades the mining performance with respect to execution time and space requirement. This situation may deteriorate when the database contains lots of long transactions or long high utility item sets. To counter these problems, two algorithms are proposed for mining high utility item sets viz. Utility Pattern Growth (UP-Growth) and UP-Growth+. The information of high utility item sets is kept in a tree-based data structure which is referred to as utility pattern tree (UP-Tree) in which the candidate item sets is generated efficiently with only two scans of database.
F. Efficient Tree Structures for High Utility Pattern Mining in Incremental Databases
Chowdhury Farhan Ahmed, Syed Khairuzzaman Tanbeer, Byeong-Soo Jeong, and Young-Koo Lee, Member, IEEE [7] proposed that in this paper, three novel tree structures are proposed to efficiently perform incremental and interactive HUP mining:
Incremental HUP Lexicographic Tree (IHUPL-Tree): Arranged according to an item’s lexicographic order. It can interpret the incremental data in the absence of any restructuring operation.
IHUP Transaction Frequency Tree (IHUPTF-Tree): Obtains a compact size by arranging items according to their transaction frequency (descending order).
IHUP-Transaction-Weighted Utilization Tree (IHUPTWU-Tree): Designed based on the TWU value of items in descending order and reduces the mining time.
G. A Review of Mining High Utility Patterns
Dr. S. Meenakshi1, P. Sharmila [6] proposed that Discovering interesting patterns and useful knowledge from massive data has become an important data mining task. In past, utility mining has emerging an important research topic since the quantity and profit factors are both used to discover interesting patterns from massive data. Utility mining addresses the limitation of frequent pattern mining by considering user’s expectation as well as the raw data. Amongst utility mining problems, the high utility pattern mining with its itemset framework is more challenging than the other types of utility mining and frequent pattern mining.
This research paper presents a review of the various approaches and algorithms for high utility pattern mining.
By studying above literature survey, high utility itemset mining techniques have to work using D2HUP algorithm. In proposed system, D2HUP algorithm will be implemented by using datasets.
III. SYSTEM ARCHITECTURE
This section narrates about how high utility pattern is found and general technique to find high utility pattern.
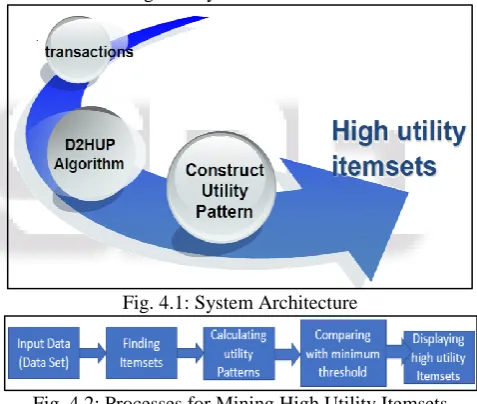
Fig. 4.1 below shows the general System diagram of our system. It uses Microsoft Foodmart dataset.
In this diagram, first we have transactions of items as an input. By using the D2HUP algorithm, we find utility pattern. In D2HUP 2 techniques are used as:
1) Closure Property 2) Singleton Property
If the outputted utility is less than the threshold value or minimum utility value then the transaction or itemset is discarded.
[image:2.595.308.547.335.537.2]If the outputted utility is greater than the threshold value or minimum utility value then the transaction or itemset is considered as high utility count.
Fig. 4.1: System Architecture
Fig. 4.2: Processes for Mining High Utility Itemsets In utility mining, the utility of an itemset u(i) is defined
as the sum of the utilities of itemset i in all the transactions containing i.
An itemset i is called a high utility itemset if and only if u(i)>= min_utility, where min_utility is a user defined minimum utility threshold.
Thus, the focus of high utility itemset mining is to find all those itemset having utility greater or equal to user defined minimum utility threshold.
IV. MATHEMATICAL TERMS USED Let = {𝑖1,2,𝑖3,…,𝑖𝑛} : a set of items.
Each transaction (𝑇) has a unique identifier (𝑡𝑖𝑑).
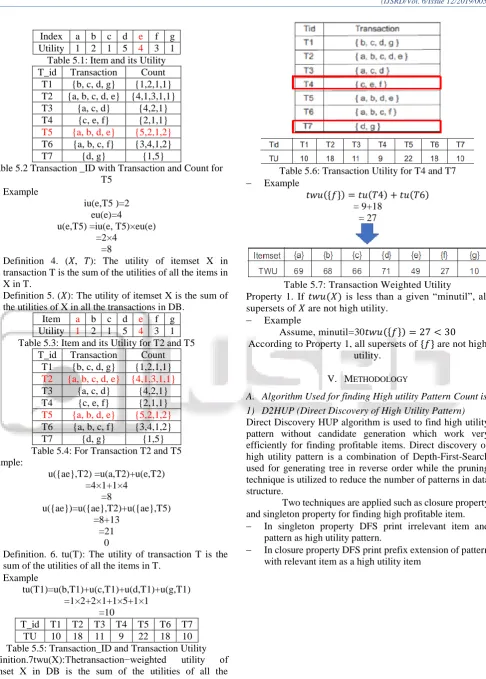
1) Definition 1. (𝑖, 𝑇) Internal Utility is the count (𝐐𝐮𝐚𝐧𝐭𝐢𝐭𝐲)associated with i in T in the transaction table. 2) Definition 2. (𝑖) External Utility is the utility
value(𝒑𝒓𝒐𝒇𝒊𝒕) of 𝑖 in the 𝑢𝑡𝑖𝑙𝑖𝑡𝑦 𝑡𝑎𝑏𝑙𝑒.
Index a b c d e f g Utility 1 2 1 5 4 3 1
Table 5.1: Item and its Utility T_id Transaction Count T1 {b, c, d, g} {1,2,1,1} T2 {a, b, c, d, e} {4,1,3,1,1} T3 {a, c, d} {4,2,1} T4 {c, e, f} {2,1,1}
T5 {a, b, d, e} {5,2,1,2}
T6 {a, b, c, f} {3,4,1,2}
T7 {d, g} {1,5}
Table 5.2 Transaction _ID with Transaction and Count for T5
Example
iu(e,T5 )=2 eu(e)=4 u(e,T5) =iu(e, T5)×eu(e)
=2×4 =8
4) Definition 4. (𝑋, 𝑇): The utility of itemset X in transaction T is the sum of the utilities of all the items in X in T.
5) Definition 5. (𝑋): The utility of itemset X is the sum of the utilities of X in all the transactions in DB.
Item a b c d e f g Utility 1 2 1 5 4 3 1 Table 5.3: Item and its Utility for T2 and T5
T_id Transaction Count T1 {b, c, d, g} {1,2,1,1}
T2 {a, b, c, d, e} {4,1,3,1,1}
T3 {a, c, d} {4,2,1} T4 {c, e, f} {2,1,1}
T5 {a, b, d, e} {5,2,1,2}
T6 {a, b, c, f} {3,4,1,2}
T7 {d, g} {1,5}
Table 5.4: For Transaction T2 and T5 Example:
u({ae},T2) =u(a,T2)+u(e,T2) =4×1+1×4
=8
u({ae})=u({ae},T2)+u({ae},T5) =8+13
=21 0
6) Definition. 6. tu(T): The utility of transaction T is the sum of the utilities of all the items in T.
Example
tu(T1)=u(b,T1)+u(c,T1)+u(d,T1)+u(g,T1) =1×2+2×1+1×5+1×1
=10
[image:3.595.308.548.67.351.2]T_id T1 T2 T3 T4 T5 T6 T7 TU 10 18 11 9 22 18 10 Table 5.5: Transaction_ID and Transaction Utility Definition.7twu(X):Thetransaction−weighted utility of itemset X in DB is the sum of the utilities of all the transactions containing X in DB.
Table 5.6: Transaction Utility for T4 and T7 Example
𝑡𝑤𝑢({𝑓}) = 𝑡𝑢(𝑇4) + 𝑡𝑢(𝑇6) = 9+18
= 27
Table 5.7: Transaction Weighted Utility
Property 1. If 𝑡𝑤𝑢(𝑋) is less than a given “minutil”, all supersets of 𝑋 are not high utility.
Example
Assume, minutil=30𝑡𝑤𝑢({𝑓}) = 27 < 30 According to Property 1, all supersets of {𝑓} are not high
utility.
V. METHODOLOGY
A. Algorithm Used for finding High utility Pattern Count is 1) D2HUP (Direct Discovery of High Utility Pattern) Direct Discovery HUP algorithm is used to find high utility pattern without candidate generation which work very efficiently for finding profitable items. Direct discovery of high utility pattern is a combination of Depth-First-Search used for generating tree in reverse order while the pruning technique is utilized to reduce the number of patterns in data structure.
Two techniques are applied such as closure property and singleton property for finding high profitable item. In singleton property DFS print irrelevant item and
pattern as high utility pattern.
Closure is defined as for pattern X and set W of items with X intersection (∩) W is a null set, the utility of (S U X) ≥ minimum utility, for all S (is a subset or equal to W) and S is not a null set.
If the minimum utility ≤ utility of W union X which is less than the sum of minimum utility and the sum of the utility of the item in w included in the transaction set of X’s then utility S union X < minimum utility for all S, subset of W. This property is known as Singleton.
a) Definition 1
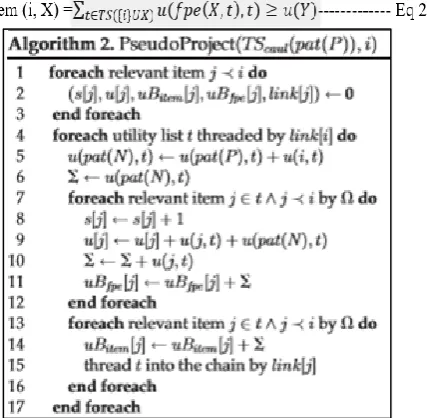
Given an ordering Ω, a pattern Y is a full prefix extension of the pattern X w.r.t. a transaction t containing X denoted as Y=fpe (X, t) if Y is a prefix extension of X derived by adding exactly all the items in t that is listed before X in Ω.
b) Basic Upper Bound
For Pattern X, the sum of utility of the full extension of X w.r.t. each transaction in TS(X) indicated by uBfpe (X) is no less than the utility of any prefix extension Y of X.
c) Relevance of Item
For pattern X and an item i belongs to X, sum of utility of full prefix extension of X w.r.t. every transaction in TS({i} U X) denoted by uBitem (i, X) is no less than the utility of prefix extension of X that contains i.
For calculating the utilities and upper bound of prefix extension of pattern CAUL is used. It contains two division utility list and summary table. All the items in transaction t which is relevant in growing prefix extension of pattern the utility is stored in the utility list. For each distinct relevant item j to grow the prefix extension of pattern an entry is maintained in the summary table.
It is denoted as quintuple, summary[j] = (support[j], utility[j], sum of full prefix extension of {j} union pattern of the current node basic upper bound, link[j]). Basic upper bound for a pattern X is the sum of the utility of the full prefix extension of X with respect to each transaction in the transaction set. In the utility list the occurrences of the same item are linked by a chain threading that is the link[j].
CAUL of a pattern in the transaction set is calculated efficiently by using pseudo projection. In the reverse enumeration tree node N and its parent node P, pattern of N = {i} union pattern of parent. CAUL keeps the original utility information for each transaction. CAUL can determine whether X is a high utility pattern before X is enumerated. Currently being enumerated pattern only keeps in main memory.
The optimization is done by considering γ as the maximum number of rounds for irrelevant item filtering and ø for materialization threshold for space-time tradeoff.
B. Closed HUI Discovery
An itemset is closed if there is no superset which has same support count. A high utility itemset is closed if there should not be any proper superset having the same utility. CHUD is an efficient depth-first search algorithm. It uses Itemset - TidsetpairTree(IT-Tree) to find CHUIs. Each node consists of an itemset X, Tidset g(X), two ordered sets of items PREV-SET(X) and POST-PREV-SET(X) and estimated utility. The TU-Table stores the transaction utility with transaction id.
CHUD first scans the database and convert into a vertical database. While creating vertical database, it creates a global TU-Table. Promising items are stored in an ordered list like an increasing order of support at the same time unpromising items are removed from the global TU-Table. From single promising item, CHUD generates candidates by recursively joining items to the existing for forming larger candidates. For each item ak in O, CHUD creates a node and items a1 to ak-1 into PREV-SET({ak}) and items ak+1 to an into POST-SET({ak}).
ALGORITHM: CHUD Input: D:
The database; absolute minimum utility Output:
Complete set of CHUIs
InitialDatabaseScan(D) RemoveUtilityUnpromisingItems (O, GTU) foreach item ak belongs O do
{Create node for ak
CHUD_Phase-I (node for ak, GTU, absolute minimum utility)
Removing the Exact utilities of items from the Global TU-Table
CHUD_Phase-II (D, absolute minimum utility
[image:4.595.71.265.66.256.2] [image:4.595.68.282.541.750.2]utility of pattern is no less than the absolute minimum utility then the pattern is outputted as CHUI then removes the isolated items of level k. CHUD discovered items are not maintained in the main memory, directly the item is outputted after that it will discard candidates with maximum item utility less than the minimum utility threshold. A candidate can be discarded from Phase II if its estimated utility or maximum item utility is less than the absolute utility.
Phase-I of CHUD find the complete set of potential CHUIs. If the set X is not subsumed by other itemsets then closure of X, discarding candidate with the maximum item utility of each calculated. Phase-I explore the superset of X by appending items from POST-SET(X) to X which forms the search space of closed candidates for the second phase. So CHUD gets a very less number of HUIs in Phase-I.
Phase-II gets inputs as promising item’s database, potential CHUIs and absolute minimum utility and produces all CHUIs by calculating absolute utility for X and is greater than that of absolute minimum utility then the set X is outputted. In CHUD, the exact utilities of items were removed from the Global TU-Table, the minimum item utility of an item of items were removed from the Local TU Table, the maximum item utility of an item candidates were discarded, these are the strategies used.
VI. EXPERIMENTAL RESULTS & ANALYSIS
A. Experimental Setup
Performance of the both algorithms is evaluated in this section. Microsoft Windows 10 operating system is used. These algorithms are implemented in Java language. 1) Datasets
The Dataset used to implement D2HUP algorithm is Foodmart and chain store
a) Foodmart
In this dataset, there are two parameters used: 1) Pricelist
2) Transaction
The parameters of Transaction have fields as: Starts from 0
How much records:34015 Variety of items :1560
Here the input for Foodmart dataset is: -Dfoodmart-trans98.nodup.asc.txt
Efoodmart-price98.noitem.txt-Osee98-foodmart010.txt N1560 -W29 -#34015 -U0.010 -F0.5 -R3
The notations above as follows: D: the database file name E: the price file name O: the result file name N: the number of item
W: the max length of transaction #: the number of transaction S: the absolute value of threshold U: the relative value of threshold
F: the factor to choose pseudo or materialization R: the number of recursive
2) Chainstore
In this dataset, there are two parameters used: 1) Amount
2) Price
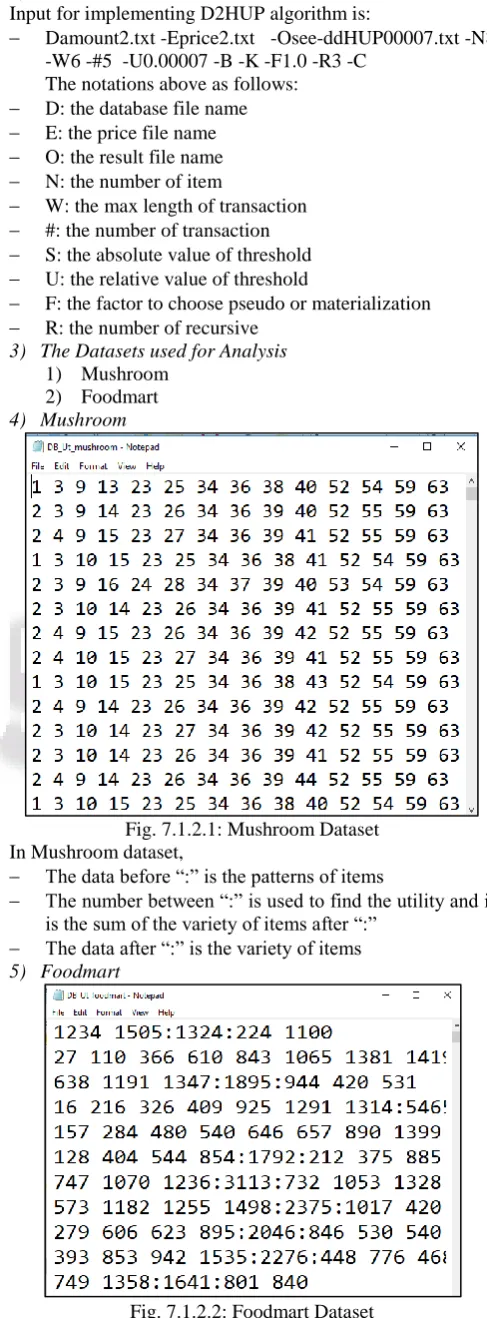
Input for implementing D2HUP algorithm is:
Damount2.txt -Eprice2.txt -Osee-ddHUP00007.txt -N8 -W6 -#5 -U0.00007 -B -K -F1.0 -R3 -C
The notations above as follows: D: the database file name E: the price file name O: the result file name N: the number of item
W: the max length of transaction #: the number of transaction S: the absolute value of threshold U: the relative value of threshold
F: the factor to choose pseudo or materialization R: the number of recursive
3) The Datasets used for Analysis 1) Mushroom
[image:5.595.302.546.78.738.2]2) Foodmart 4) Mushroom
Fig. 7.1.2.1: Mushroom Dataset In Mushroom dataset,
The data before “:” is the patterns of items
The number between “:” is used to find the utility and it is the sum of the variety of items after “:”
[image:5.595.64.539.81.774.2] The data after “:” is the variety of items 5) Foodmart
Fig. 7.1.2.2: Foodmart Dataset In Foodmart dataset,
The number between “:” is used to find the utility and it is the sum of the variety of items after “:”
6) Algorithm Used for the Result Analysis
1) D2HUP (Direct Discovery of High Utility Pattern) 2) CHUD (Closed High Utility Discovery)
Techniques D2HUP and CHUD were implemented in Java by using the datasets Foodmart and Mushroom. Example for the sparse dataset is Foodmart. Example for dense dataset is Mushroom. Both are real life data sets. Algorithms were executed in Windows 10 operating system and Intel i3 processor at 1.7GHz.
So many datasets like BMS, Connect, Chess, Accident, Kosarak, pumsb utilities have been used for testing but some of dataset shows heap size problem. Started running by giving utility values like 10000, 10025 then identified the maximum utility for each dataset.
If the minimum utility is low, then the CHUD gives a very less number of patterns. Of Mushroom which is a dense data set it gets almost 5000 times less number of itemsets than D2HUP.
It means that much of repeated utilities with itemsets are available with D2HUP. So if the user wants less number of itemset then CHUD is the best technique. It will be efficient for the requirement of business calculations.
When the utility is high, then both algorithms are performing almost equally, with the Mushroom dataset it gives again almost 190 times lesser numbers of itemsets.
Min
utility Dataset Algo
Parameters HUI Count Mem MB Time ms 10000 Mushro om D2H
UP 676 5.128 328
CHU
D 3537 6.3532 1204
Foodma rt
D2H
UP 428 4.93 125
CHU
D 425 5.54 3329
10025 Mushro om D2H UP 968965
1 13.76 48799 CHU
D 3532 6.34 906
Foodma rt
D2H
UP 426 4.94 172
CHU
D 423 7.49 3266
10035 Mushro om D2H UP 966481
5 10.48 29987 CHU
D 3523 6.33 998
Foodma rt
D2H
UP 423 4.93 109
CHU
[image:6.595.305.544.355.584.2]D 420 7.49 3197
Table 6.1.3.1: Comparison of D2HUP and CHUD Algorithm
7) Memory Requirement Performance
The three parameters analyzed with the three datasets include the number of HUI derived, the memory usage and the execution time of the techniques. The memory usage is high
for D2HUP with the Foodmart as well as the Mushroom dataset. For Foodmart when the utility is high that is about 10000 CHUD took more memory i.e. 5.54 MB. For Mushroom CHUD took two times less memory than the D2HUP.
Closed items are less in number and it doesn't contain the repeated itemsets so for finding the unique high utility itemsets CHUD is very useful. The direct discovery of high utility patterns finds more itemsets than Closed HUI discovery. In all datasets CHUD displays the less number or equal to D2HUP. Closed Itemsets will not be having a superset with the same utility that is why CHUD is always retrieving less number of high utility itemsets.
8) Execution Time Performance
The time taken for the execution is less with CHUD for dense dataset like Mushroom and it is very less for the less value of the minimum utility. For Mushroom CHUD is 30 times faster than D2HUP and for retail D2HUP is performing well than CHUD.
9) Comparison of HUI Count for High Utility Pattern In below graphs, two algorithms are used for analysis i.e. DDHUP algorithm and CHUD Algorithm. These two algorithms are compared used different datasets such as Foodmart and mushroom. Here HUI count means high utility pattern count is calculated.
10000 -Min Utility Value D2HUP CHUD Mushroom
(HUI Count) 676 3537 Foodmart
[image:6.595.44.289.378.721.2](HUI Count) 428 425 Table 6.1.6.1: For Min Utility value 10000
Fig. 6.1.6.1: For Minimum until value 10000 In table 6.1.6.1, value 10000 is the minimum utility value that is taken as min_utility in algorithm. For this minimum utility HUI count is calculated for D2HUP algorithm and CHUD algorithm using mushroom dataset and Foodmart dataset. Figure 6.1.6.1 shows the graph for HUI count for value 10000.
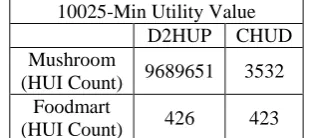
10025-Min Utility Value D2HUP CHUD Mushroom
(HUI Count) 9689651 3532 Foodmart
[image:6.595.350.506.663.732.2]Fig. 6.1.6.2: For Minimum util value 10025
In table 6.1.6.2, value 10025 is the minimum utility value that is taken as min_utility in algorithm. For this minimum utility HUI count is calculated for D2HUP algorithm and CHUD algorithm using mushroom dataset and Foodmart dataset. Figure 6.1.6.2 shows the graph for HUI count for value of 10025.
10035-Min Utility Value
D2HUP CHUD Mushroom (HUI Count) 9664815 523
[image:7.595.49.287.68.213.2]Foodmart (HUI Count) 423 420 Table 6.1.6.3: For Min utility value 10035
Fig. 6.1.6.3: For Min utility value 10035
In table 6.1.6.3, value 10035 is the minimum utility value that is taken as min_utility in algorithm. For this minimum utility HUI count is calculated for D2HUP algorithm and CHUD algorithm using mushroom dataset and Foodmart dataset. Figure 6.1.6.3 shows the graph for HUI count for value of 10000.
10) Comparison of Memory Usage for high utility pattern In below graphs, two algorithms are used for analysis i.e. D2HUP algorithm and CHUD Algorithm. These two algorithms are compared used different datasets such as Foodmart and mushroom. Here memory usage is calculated to find HUI count.
10000-Min utility value
D2HUP CHUD Mushroom (Memory Usage) 5.128 6.3532 Foodmart (Memory Usage) 4.93 5.54
[image:7.595.310.548.281.506.2]Table 6.1.7.1: For Min utility value 10000
Fig. 6.1.7.1: For Min utility value 10000
In table 6.1.7.1, value 10000 is the minimum utility value that is taken as min_utility in algorithm. For this minimum utility, Memory usage is calculated for D2HUP algorithm and CHUD algorithm using mushroom dataset and Foodmart dataset. Figure 6.1.7.1 shows the graph for memory used to find high utility pattern for value of 10000.
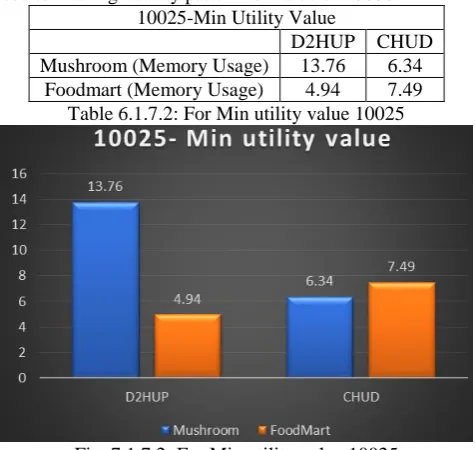
10025-Min Utility Value
D2HUP CHUD Mushroom (Memory Usage) 13.76 6.34
Foodmart (Memory Usage) 4.94 7.49 Table 6.1.7.2: For Min utility value 10025
Fig. 7.1.7.2: For Min utility value 10025
In table 6.1.7.2, value 10025 is the minimum utility value that is taken as min_utility in algorithm. For this minimum utility, Memory usage is calculated for D2HUP algorithm and CHUD algorithm using mushroom dataset and Foodmart dataset. Figure 6.1.7.2 shows the graph for memory used to find high utility pattern for value of 10025.
10035- Min utility value
D2HUP CHUD Mushroom (Memory Usage) 10.48 6.33
[image:7.595.50.289.292.516.2]Fig. 6.1.7.3: For Min utility value 10035
In table 6.1.7.3, value 10035 is the minimum utility value that is taken as min_utility in algorithm. For this minimum utility, Memory usage is calculated for D2HUP algorithm and CHUD algorithm using mushroom dataset and Foodmart dataset. Figure 6.1.7.3 shows the graph for memory used to find high utility pattern for value of 10035.
11) Comparison of Time in MS for High Utility Pattern In the above graph, two algorithms are used for analysis i.e. D2HUP algorithm and CHUD Algorithm. These two algorithms are compared used different datasets such as Foodmart and mushroom. Here Time needed is calculated to find HUI count.
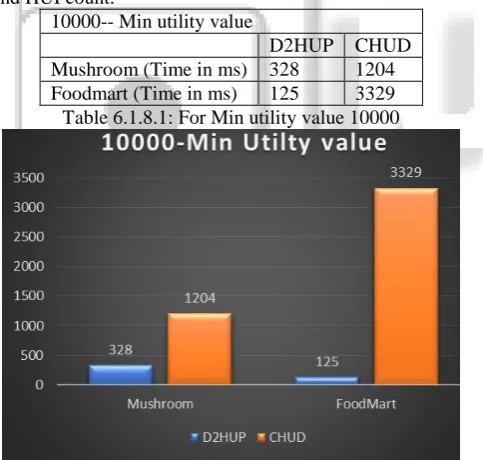
10000-- Min utility value
[image:8.595.312.546.68.210.2]D2HUP CHUD Mushroom (Time in ms) 328 1204 Foodmart (Time in ms) 125 3329 Table 6.1.8.1: For Min utility value 10000
Fig. 6.1.8.1: For Min utility value 10000
In table 6.1.8.1, value 10000 is the minimum utility value that is taken as min_utility in algorithm. For this minimum utility, time needed is calculated for D2HUP algorithm and CHUD algorithm using mushroom dataset and Foodmart dataset. Figure 6.1.8.1 shows the graph for time needed to find high utility pattern for value of 10000.
10025-- Min utility value
D2HUP CHUD Mushroom (Time in ms) 48799 906
[image:8.595.307.546.291.495.2]Foodmart (Time in ms) 172 3266 Table 6.1.8.2: For Min utility value 10025
Fig. 6.1.8.2: For Min utility value 10025
In table 6.1.8.2, value 10025 is the minimum utility value that is taken as min_utility in algorithm. For this minimum utility, time needed is calculated for D2HUP algorithm and CHUD algorithm using mushroom dataset and Foodmart dataset. Figure 6.1.8.2 shows the graph for time needed to find high utility pattern for value of 10025.
10035-Min Utility Value
D2HUP CHUD Mushroom (Time in ms) 29987 998
Foodmart (Time in ms) 109 3197 Table 6.1.8.3: For Min utility value 10035
Fig. 6.1.8.3: For Min utility value 10035
In table 6.1.8.3, value 10035 is the minimum utility value that is taken as min_utility in algorithm. For this minimum utility, time needed is calculated for D2HUP algorithm and CHUD algorithm using mushroom dataset and Foodmart dataset. Figure 6.1.8.3 shows the graph for time needed to find high utility pattern for value of 10035.
VII. CONCLUSION & FUTURE SCOPE
Thus, we conclude that we have implemented the D2HUP algorithm on Foodmart and Chainstore dataset and we have got the high utility count. Also, we have compared the D2HUP algorithm with CHUD algorithm using Foodmart, Mushroom and retail datasets and we got closed high utility discovery items. We can say that for many datasets CHUD is better algorithm.
[image:8.595.51.293.378.608.2]In future, mining top-k high utility itemsets will be more useful so the top-k CHUD will be implemented. Also, we can further work these algorithms using concept of Parallelization.
REFERENCES
[1] Junqiang Liu, Ke Wang, Benjamin C.M. Fung, “Mining High Utility Patterns in One Phase without Generating Candidates”, Senior Member, IEEE TRANSACTIONS ON KNOWLEDGE AND DATA ENGINEERING, VOL. 28, NO. 5, MAY 2016.
[2] Shuning Xing1, Fangai Liu, Jiwei Wang, Lin Pang, Zhenguo Xu,” Utility Pattern Mining Algorithm Based on Improved Utility Pattern Tree”, School of Information Science & Engineering, Shandong Normal University, Jinan, China,2015 8th International Symposium on Computational Intelligence and Design.
[3] Snehal Bhutkar, Vaishali Garde, Pranali Bodake, Premali Kadam,” High Utility Itemsets mining using Direct Discovery HUP in one phase”, Department of Computer Engineering JSPM RESSOR, Pune ISSN 2395-1621
[4] Junqiang Liu, Ke Wang, Benjamin C. M. Fung,” Direct Discovery of High Utility Item sets without Candidate Generation”, IEEE 12th International Conference on Data Mining, 2012
[5] Vincent S. Tseng, Bai-EnShie, Cheng-Wei Wu, and Philip S. Yu, “Efficient Algorithms for Mining High Utility Item sets from Transactional Databases”, Fellow, IEEE. International Journal of Computer Science and Information Technology Vol 5(6) 2014 ISSN:0975-9646.
[6] Dr. S. Meenakshi1, P. Sharmila,” A Review of Mining High Utility Patterns”, Dept. of Computer Science, Gobi Arts & Science College, Gobichettipalayam, Tamilnadu, India. International Journal of Innovative Research in Computer and Communication Engineering (An ISO 3297: 2007 Certified Organization)
[7] Chowdhury Farhan Ahmed, Syed Khairuzzaman Tanbeer, Byeong-Soo Jeong, and Young-Koo Lee, Member, “Efficient Tree Structures for High Utility Pattern Mining in Incremental Databases”, IEEE.Transactions of Knowledge and data Engineering Vol 21.
[8] L. Geng, H. J. Hamilton, ‘Interestingness measures for datamining: A survey”, ACM Comput. Surveys, vol. 38, no. 3, p. 9, 2006.
[9] Silberschatz, A. Tuzhilin, “On subjective measures of interestingness in knowledge discovery”, in Proc. ACM 1st Int. Conf. Knowl. Discovery Data Mining, 1995. [10]H. Yao, H. J. Hamilton, L. Geng, “A unified framework
for utility-based measures for mining itemsets”, in Proc. ACM SIGKDD 2nd Workshop Utility-Based Data Mining, 2006.
[11]R. Agrawal, T. Imielinski, A. Swami, “Mining association rules between sets of items in large databases”, in Proc. ACM SIGMOD Int. Conf. Manage. Data, 1993.
[12]R. Agrawal. Srikant, “Fast algorithms for mining association rules ”, in Proc. 20th Int.Conf. Very Large Databases, 1994.
[13]J. Han, J. Pei, Y. Yin, [8] Mengchi Li Junfeng Qu,” Mining High Utility Itemsets without Candidate Generation”, State Key Lab of Software Engineering, School of Computer, Wuhan University, Wuhan 430072, China, in Proc. ACM SIGMOD Int. Conf. Manage. Data, 2000.