Achieving geographic equity in the
Portuguese hospital financing system
Monica Duarte Correia de Oliveira
Department o f Operational Research,
London School o f Economics and Political Science
Thesis submitted to the University of London for the Degree o f Doctor of
Philosophy
UMI Number: U61583B
All rights reserved
INFORMATION TO ALL U SE R S
The quality of this reproduction is d ep en d en t upon the quality of the copy subm itted.
In the unlikely even t that the author did not sen d a com plete m anuscript and there are m issing p a g e s, th e se will be noted. Also, if material had to be rem oved,
a note will indicate the deletion.
Dissertation Publishing
UMI U 615833
Published by ProQ uest LLC 2014. Copyright in the Dissertation held by the Author. Microform Edition © ProQ uest LLC.
All rights reserved. This work is protected against unauthorized copying under Title 17, United S ta tes C ode.
ProQ uest LLC
789 East E isenhow er Parkway P.O. Box 1346
^
Of A POLITICALA N D ru j
4
M c S
ogU
ABSTRACT
The Portuguese health care system is based on a national health service structure. The
Portuguese government has with various statements over time shown that it is seeking
some kind o f geographical equity but this has never been clearly defined. There are
wide inequalities in the distribution o f hospital resources in Portugal with marked
concentration in urban coastal areas and little information. The objective o f the research
described in this thesis is to develop methods to inform the allocation o f resources to
Portuguese hospitals so that this can be made more equitable in both current and capital
spending. The methods used are a combination o f methods already used in other
countries and new methods to address two questions. First, to measure inequities in
hospital care in terms o f capital, finance and utilisation using capitation formulas. These
formulas are constructed using: a multiplicative model to measure need for hospital
care; a multilevel model to estimate unavoidable costs and to disentangle allocative
inefficiencies o f hospital care; and a flow demand model to predict hospital
geographical utilisation and to compute cross-boundary flows. Second, to indicate how
redistribution o f hospital supply will best improve equity o f utilisation and access, using
location-allocation models that were designed to consider alternative policy objectives
ACKNOWLEDGMENTS
I am deeply indebted to Professor Gwyn Bevan for being an extremely attentive and
committed supervisor. Without all his effort and patience, all the progress and learning
process throughout the last three and a half years would not have been both as
challenging and pleasant as it has been. His intellectual contribution and guidance on
how to carry out research have greatly marked m y academic attitude.
This research has been funded by the scholarship o f Fundaqao p a ra a Ciencia e Tecnologia, M inisterio da Ciencia e Ensino Superior, Portugal (schoolarship co-funded by the European Social Fund, Structural Fund III; grant BD 19972/99).
I would also like to express my gratitude to Professor Pedro Pita Barros, Mr. Jose
Fernandez, Dr. Elias M ossialos, Professor Joao Antonio Pereira and Professor Carlos
Gouveia Pinto for their availability, help and insightful comments.
I am thankful to others who have always been helpful at different stages o f the research:
Professor Walter Holland, Ms. Ceu Mateus, Mr. David McDaid, Professor Alistair
McGuire, Ms. Brenda Mowlam, Dr. Adam Oliver, Ms. Filomena Parra, Dr. Susan
Powell and Ms. Ceu Valente.
I am grateful to the LSE Health and Social Care and to the Operational Research
Department at the LSE for providing me with excellent working conditions and a very
intellectual and stimulating environment in which I could develop my research. I
acknowledge the financial support o f the UK Health Economics Study Group, which
allowed me to attend its meetings. I thank the Portuguese National Institute o f Statistics
and the Financial Institute for Informatics and Management o f the Portuguese Ministry
I am grateful to the participants o f the seminars and conferences where various studies
iji t
o f this thesis were presented . I specially thank Dr. Zaid Chalabi and Dr. Andrew Street
for their detailed comments as discussants o f the papers presented in the meetings o f the
UK Health Economic Study Group.
Parts o f this thesis have been published elsewhere: working paper Oliveira, M. and G.
Bevan (2001). M easuring geographic inequalities in the Portuguese health care system: An estimation o f hospital care need. Lisboa, A ssocia9ao Portuguesa de Economia da
Saude: 35; Oliveira, M. (2002); and discussion p a p e r s flo w dem and m odel to pred ict hospital utilisation. London, LSE Health and Social Care: 57. An adapted version o f Chapter 5 o f this thesis was accepted for publication in the Health Policy Journal
(March 2003).
I thank Dina Davaki for accompanying and supporting me throughout most o f this
journey. I especially thank Leandro Rothmuller for giving me strength during the last
stage o f the thesis. I especially thank Sofia Silva for all her support in the difficult times.
I thank my friends Dimitris Boucas, Ana Carvalho, Carmen Constan9a, Martin Cumpa,
Filipe Garcia, Carsten Holbraad, Balazc Kotnyek, Heather Lannin, Peter Lutz, Yannis
Mourtos, Lidia Oliveira, Pedro Oliveira, John Tan, Andrea V olfova and the
Berloquenhos for their positive energy and encouragement.
* P arts o f this thesis w ere presented in the follow ing conferences and sem inars: 7th N ational M eeting o f H ealth E conom ics, organised by the P ortuguese A ssociation o f H ealth E conom ics, L isboa, N ovem ber 2000; LSE H ealth and Social C are sem inar series, M ay 2001; LSE H ealth and Social C are inform al sem inar series, D ecem ber 2001; 60th M eeting o f th e U K H ealth E conom ics Study G roup, N orw ich, January 2002; L ondon and South E ast O perational R esearch Society, L ondon, M arch 2002; 2 2 nd M eeting o f the Spanish H ealth E conom ics A ssociation, organised by the S panish A ssociation o f H ealth E conom ics, P am plona, M ay 2002; 4th E uropean C onference on H ealth E conom ics, organised by the
Cada qual com seu igual. Each one with his equal. A Portuguese expression
La prem iere egalite, c ’est I ’equite. The first equality is equity.
Victor Hugo, Les M iserables
Las majestueuse egalite des lois, qui interdit au riche comme au pauvre de coucher sous les ponts, de mendier dans les rues et de voler du pain. The majestic equality o f the law forbids the rich as well as the poor to sleep under bridges, to beg in the streets and to
steal bread.
ABBREVIATIONS
AIC: Aikeke Information Criteria
ASMR: Age Specific Mortality Rates
CBF: Cross-Boundary Flows
DBM: Distance Based Model
DEA: Data Envelopment Analysis
DHA: District Health Service Authority
DRG: Diagnostic Related Groups
EM: Entropy Model
EU: European Union
FCE: Finished Consultant Episode
FDM: Flow Demand Model
GDP: Gross Domestic Product
GLM: Generalised Linear Model
GLS: Generalised Least Squares
GP: General Practitioner
HFEM: Hierarchical Fixed Effects Model
IGIF: Institute for Financial and Informational Management
LOS: Length o f Stay
MLM: Multilevel Model with random intercepts and slopes
MoH: Ministry o f Health, Portugal
MP: Mathematical Programming (model)
n/a: not available
NF: N et Flow method
NHS: National Health Service
NUTS: Statistical Nomenclature o f Territorial Units
OECD: Organisation for Economic Cooperation and Development
OLS: Ordinary Least Squares
PIDDAC: Program o f Investments and Expenditure for Development o f the Central
Administration, Portugal
PF: Proportional Flow method
PPI: Purchasing Power Index
PPP: Purchasing Power Parities
PYLL: Potential Years o f Life Lost
RAWP: Resource Allocation Working Party
RHA: Regional Health Authority
RMI: Relative Mortality Index
SFM: Stochastic Frontier Model
SIM: Spatial Interaction Model
SMR: Standardised Mortality Ratio
SSMs: Sample Selection Models
TI: Treatment Intensity method
TPM: Two-Part Model
UBM: Utilisation Based Model
UC: Unavoidable Costs
UFBM: Utilisation Flows Based Model
UK: United Kingdom
USD: United States Dollar
US: United States
NOTATION
Notation Interpretation
r r is a geographic d istric t unit (district; for Portugal, r =1,2,..18).
cap _ in d ex r R elative capitation index for district r, accounting for all the selected
adjustm ents o f the capitation form ula.
Pr , P R esident population in d istrict r and total resident population.
h r A ge and additional need index for d istrict r .
h r C B Fs index for d istrict r .
h r U C index for district r.
D istrict _ sh are _ \ r Share o f n eed for ho sp ital care for d istrict r .
D istrict _ sh are _ 2 r Share o f n eed for h ospital care, adjusted by C B Fs for district r .
D istrict _ sh are _ 3r Share o f n eed for hospital care, adjusted by C B Fs and U C s fo r district r .
a A ge group a .
* \a A ge (and sex) cost for age (and sex) group a .
d^ar N u m b er o f deaths in area r from the age group a .
Par R esident population o f the age group a in area r .
far D eath rate in area r from the age group a , w hich corresponds to the
definition o f age specific m ortality rates for area r and for age group a.
ra N ational death rate for age group a.
cutoff A ge reference used in th e com putation o f the potential years o f life lost index. It is related to life expectancy.
h M id-age point o f age group a (required to com pute th e potential years o f life
lost index).
SMRr S tandardised m ortality ratio index for district r .
ASMRar A ge specific m ortality ratio index for age group a and for d istrict r .
PYLLr Potential years o f life lost index for district r .
RMIr R elative m ortality index for district r .
h, h' H ospital identifier ( h * h ')
-c T ypes o f hospital in th e adm inistrative (and hierarchical) classification (for P ortugal: c = general central, specialised central, district, level I).
k G eographical place o f location.
district, level I).
C Outputh T otal cost standardised by an index o f hospital production. T his indicator is
referred to as standardised cost.
TotCosth T otal cost.
OutputIndexh E quivalent patients index.
DischM N um ber o f hospital inpatient discharges o f hospital h that belongs to hospital
group / .
O utpatM N um ber o f o utpatient attendances o f hospital h that belongs to hospital group
/ .
Em erghl N um ber o f em ergency and accident adm issions o f hospital h that belongs to
hospital group / .
a i> bi, Ci Total unit costs from h ospitals o f type / , for inpatient discharges, outpatient attendances and em ergency and accident adm issions, respectively.
doh N um bers o f doctors.
nuh N um ber o f nurses.
beh N um ber o f beds.
C , C' Function linking the standardised cost w ith the covariates; and linear function linking the natural logarithm o f standardised cost w ith the covariates.
a , f i , 9 P aram eters from the general hierarchical m odel.
X h , xh , xh E xplanatory variables vector for standardised costs (xh). xh is the sub-set o f
variables th a t have a log-linear function relationship w ith the d ep e n d en t variable ( x h e x A); and x'h is th e sub-set o f variables w ith a sem i-log function
relationship w ith the d ependent variable ( x h <zxh).
R andom error for the general hierarchical m odel.
a Q, a , C oefficients o f the fixed p art o f the H F E M (excluding the geographical and hospital group related coefficients).
Shk D um m y variables for the geographical location o f hospital h in place k
(H FE M and M LM ).
a 2k Fixed coefficients for dum m ies o f the geographical area k (geographical
related coefficients) (H FEM ).
lhc D um m y variables for the hospital h in th e adm inistrative h ierarchy c
(H FEM ).
&3 c Fixed coefficients for dum m ies o f the adm inistrative group c (H FEM ).
H FEM
ehck R andom error for the H FEM .
P<)> P \i P i > P i C oefficients o f the fixed p art o f the co st m odel (excluding geographical-
related and hospital group related coefficients) (M LM ).
(geographical-related coefficients) (M LM ).
Poc R andom coefficient o f the random intercept o f the M L M , defined at the
hospital adm inistrative group c.
P\c > P ic R andom coefficients o f th e random slopes o f the M L M , defined at the
hospital adm inistrative group c; /?]c and p lc are the random coefficients o f
the nurses to doctors and beds to doctors ratios, respectively.
Moc R andom co m ponent o f the random co efficien t o f the M L M , defined at the
hospital adm inistrative group c.
M\c ’ f^lc R andom com ponent o f the random slopes o f th e M L M , defined at the hospital
adm inistrative group c.
MLM
e hck R andom error at the hospital level (M LM ).
2 2 2
//O » //2 V ariances o f th e random com ponents o f th e m odel at the group level. cr^ 0 is
the variance o f the random com ponent o f the intercept, w hile c r ^ and cr^, is
the variance o f the random com ponent o f the slopes (M L M ).
2
^eO V ariances o f th e error term a t the hospital level (M L M ).
> &/xOfil > &n \pl Set o f covariance betw een the random com p o n en ts, defined at the group level
(M LM ).
i, , v and <7 P opulation points representing sm all area p o p u latio n units. Each i, / ', v and
q belongs to one district r ( / , / ', r , q e r ) ( / * / '* r * q ) .
n n is the num ber o f population points.
j , w and 2 H ospital points representing hospital site geo g rap h ic units. Each j , w and z
belongs to one district r ( j , w , z & r ) ( j * w * z ) .
m m is the n um ber o f hospital points, w hich is a sub-set o f the total n um ber o f population points n { m e i n ) .
u u U tilisation flow betw een population point i and h ospital site j .
d j Size o f hospital site j .
A Index for alternative supply to hospital site j available for population / .
othertJ A set o f other variables related w ith popu latio n and h ospital characteristics
that explains flows.
other;■ A set o f population-related variables th at explains flow s.
oth er j A set o f hospital-related variables that explains flow s.
P. R esident population in i .
Deifij D em ographic characteristics o f the population (age and sex) that im ply higher
need for hospital care for population i .
X ; Socio-econom ic level o f population i
G,j A ccessibility costs for population i to access hospital services in j
dy , djj< D istance betw een population point / and hospital site j , and betw een
population points i and /' (Euclidean distances as defined in C hapter 3).
4 P erceived availability o f hospital care to population /
h Set o f institutional characteristics o f the hospital system (such as hospitals
hierarchy, sites w ith hospital teaching functions, spatial hospital subsystem s, etc), to be specified below . Som e o f these characteristics relate to population points.
° v Set o f variables th at characterise access to other sectors o f health care and
non-health care system s (such as w elfare system and private supply) and other variables that are expected to influence dem and for hospital care -s u c h as spatial variables along th e territory.
PC, A ccessibility to prim ary care for population located in i
° j R ole o f hospital j in the hospital hierarchy (for exam ple, dum m y variables
for central and d istrict hospitals).
n u Indicator o f w hether hospital j is the first hospital o f use by population i
(dum m y variable).
12 u Indicator o f w hether hospital j is the second hospital used by population i
(dum m y variable).
Indicator o f w hether hospital j is the central hospital used by population i
(dum m y variable).
* J V ector o f hospital variables th at ch aracterise h ospital j outputs other than
inpatient care (such as external consultations and em ergencies).
* J V ector o f variables representing the hospital input m ix o f hospital j (labour
vs. equipm ent vs. beds).
y U tilisation variable as a d ependent variable.
X Set o f the covariates th at are hypothesised as affecting utilisation.
x' and x" Tw o sub-sets o f covariates o f the set x ( x ' c z x and x" c x ).
dy5dij< D um m y on w hether hospital j is w ithin 25 km from population po in t / , and
dum m y on w hether population po in t /' is w ithin 25 km from population p oint
i .
P" Set o f coefficients o f the econom etric m odel.
e£ R esiduals in the natural scale o f the second p art o f th e tw o-part m odel.
Pqw Predicted probability o f population po in t q m aking use o f hospital site w .
given that th e p robability o f that flow being positive is positive.
U CO utput h U C index for hospital h .
h r A ge adjustm ent index for district r .
Catchment,. C atchm ent population o f district r.
D r , D D ischarges from h ospitals o f district r ; total discharges in the system.
or
D ischarges from th e resident population o f d istrict r.wr, w P opulation need for hospital care in district r (resident population w eighted by age); total population need.
w; Population need for hospital care in d istrict r, scaled so th a t total need sum s up total discharges in the system .
F low _ \ tj D um m y variable for expressing w hether population i is served by hospital
j , as a first hospital (D B M ) (0 or 1 values).
F low _ 2 ij D um m y variable for show ing w hether population i is served by hospital j
as a second hospital (D B M ) (0 or 1 values).
F low _ Cjj D um m y variable for denoting w hether population i is served by hospital j
as the closest central hospital (D B M ) (0 or 1 values).
d _1, D istance travelled b etw een population point i and the first hospital o f use (non-negative variable depending on F lo w _ \tj) (D B M ).
d _2;- D istance travelled betw een population point i and the second hospital o f use (non-negative variable depending on F low _ 2 ) (D B M ).
d _ c t D istance travelled betw een population point i and the closest central hospital
o f use (non-negative variable depending on F low _ c tj ) (D B M ).
Wt N eeds-w eighted population at population point i (D B M ). T his is derived from w eighting resident population p er age group by the age w eighting index estim ated in C hapter 5.
share _ 1 ( Share (% ) o f p o pulation i that is assum ed to go to the first hospital (D B M ).
share _2, Share (% ) o f population i that is assum ed to go to th e second hospital
(DB M ).
share _ 3, Share (% ) o f p o pulation i th a t is assum ed to go to the closest central hospital (DB M ).
U - h U tilisation flow by p o pulation i to th e closest hospital (D B M ).
U _ 2 t U tilisation flow by p o pulation i to th e second closest hospital (D B M ).
V - h U tilisation flow by p o pulation to the closest central hospital (D B M ).
U N N ational utilisation rate ( U N = U ° / W)(D B M /U B M ).
m odel, w ith ' ^ P y = 1 ,V / (UB M ).
j
V N N orm ative utilisation for population area i depending on total national
utilisation rate (non-negative variable) (U B M ).
D j, D ° , D C urrent level o f supply o f hospital j ; total current level o f supply; total level
o f supply, com puted w ithin th e m odel (U B M )
u ° , u ° (Past) flow s and (past) total level o f utilisation (D B M /U B M )
ai A uxiliary variable used to obtain an absolute value o f d ifference b etw een
utilisation and expected utilisation, per population are a i (U B M ).
K P 'jAj) D ecay function th at relates th e effect o f distance (ac cessibility costs) from
population i to hospital j (definition in A p pendix E). T he decay function m ight differ for hospital type and the decay param eter /?y w ill depend on the
level o f attraction betw een hospital j and patients located at different distances from th a t hospital (U B M ).
fij P aram eter th at defines the elasticity o f utilisation in relation to distance, for
hospital j (U B M ).
f _ min P roportion o f current level o f supply o f hospital j to be kept, as a m inim um (U B M /U FB M )
/ m ax P roportion o f current level o f supply o f hospital j to be increased, as a m axim um (U B M /U FB M )
m in _ D j M inim um level o f supply o f h ospital j to be m aintained (U B M /U FB M ). m a x _ D j M axim um level o f supply to be allow ed for hospital j (U B M /U F B M ).
log U ry D istribution o f the natural logarithm o f utilisation flow s th a t operates as th e
target. T his target is a distribution form ulated in accordance to som e ty p e o f equity principle (in this case, patients m aking use o f th e closest hospital) (U FB M ).
bu A uxiliary variable for defining the difference betw een variations in the
logarithm o f utilisation flow s (U F B M ).
lOg Pij L ogarithm o f the probability o f use, g enerated in the first p art o f th e estim ated
tw o-part FD M , developed in C hapter 7 (U F B M ).
log Uy N atural logarithm o f the utilisation variable betw een hospital z and hospital
j , as defined in the second part o f the tw o -p art F D M , developed in C hapter 7 (U FB M ).
D u m F irstjj,
D um Secondy and
D um C entraly
D um m y for w hether hospital j is the clo sest hospital to a population i; dum m y for w hether hospital j is the second clo sest hospital to a population
i; and dum m y for w hether j is th e clo sest central hospital to a population i
D um Lisboatj ,
DumPortOjj and
D um Coim bra
D um m y for the central hospital site in L isboa and for p opulations from the South; dum m y for th e central hospital site in C oim bra and for populations from the C entre; and D um m y for the central hospital site in P orto and for populations from the N orth (U FB M ).
others y P aram eter capturing th e influence on flow s o f all th e factors from the FD M , w ith the exception o f th e variables th a t relate to hospital supply (U F B M ).
a0 j a| , a 2> a3 > a4 > a5,
a 6 >
TABLE OF CONTENTS
ABSTRACT...iii
ACKNOWLEDGMENTS... iv
ABBREVIATIONS...vii
NOTATION...ix
TABLE OF CONTENTS... xvi
[image:18.595.47.471.362.743.2]TABLE OF TABLES...xxii
TABLE OF FIGURES...xxv
1 CHAPTER 1 - INTRODUCING GEOGRAPHIC EQUITY...1
1.1 IN T R O D U C T IO N ... 1
1.2 G E O G R A P H IC A L E Q U IT Y IN H E A L T H P O L IC Y ... 2
1.2.1 D efining the equity co n cep t(s)...2
1.2.2 G eograph ical eq u ity...4
1.2.3 P roblem s in form u latin g a n d using a definition o f eq u ity...5
1.3 W H Y G E O G R A P H IC A L E Q U IT Y IN T H E P O R T U G U E S E H O S P IT A L S E C T O R ?... 7
1.3.1 Focus on the pu b lic h ospital sy stem... 7
1.3.2 D ocum enting health inequalities in P o rtu g a l...8
1.3.2.1 Inequality of health outcom es, finance and econom ic accessibility...8
1.3.2.2 W hat is known and not known a b o u t geographical equity in P o rtu g al?...10
1.4 O B JE C T IV E S OF TH IS T H E S IS ... 11
1.4.1 R esearch qu estion s...12
1.4.2 M ethods u sed...12
1.4.3 Structure o f the th esis...13
SECTION 1... 16
2 CHAPTER 2 - THE PORTUGUESE HEALTH CARE SYSTEM: SETTING THE CONTEXT... 17
2.1 IN T R O D U C T IO N ... 17
2.2 T H E P O R T U G U E S E C O N T E X T ...18
2.2.1 P o litica l sy stem...18
2.2.2 P ublic an d health care fu n din g sy ste m...20
2.3 H E A L T H S Y S T E M ...22
2.3.1 P o litica l g o a ls...22
2.3.2 NHS creation an d h isto ry...25
2.3.2.1 Before the 1974 revolution... 26
2.3.2.2 1974-1979: revolution an d NHS cre atio n ... 27
2.3.2.3 1979-1985: transition to the NHS m odel...28
2.3.2.4 1985-1995: shifting tow ards th e private... 29
2.3.2.5 1995-2002: re-structuring th e NHS m o d el...31
2.4 T H E C U R R E N T H O SP IT A L S Y STEM IN P O R T U G A L ... 33
2.4.1 N H S organ isational stru ctu re...33
2.4.2 The adm inistrative hierarchy o f h o sp ita ls...36
2.4.3 Resource a llo ca tio n...37
2.4.3.1 R eso u rce allocation criteria... 38
2.4.3.2 Statistics in the hospital se c to r...40
2.4.4 H ospital p o lic ie s...46
2.4.4.1 C apital... 46
2.4.4.2 H um an re s o u r c e s ... 47
2.4.4.3 Waiting lists program ...49
2.4.4.4 Hospital v ersu s oth er health ca re s e c to rs ... 49
2.5 W H Y G E O G R A P H IC A L IN E Q U IT IE S IN T H E H O S P IT A L S E C T O R ?... 50
2.6 C O N C L U D IN G O B S E R V A T IO N S ... 51
3 CHAPTER 3 - GEOGRAPHICAL ANALYSIS OF INEQUALITIES IN THE HOSPITAL ACUTE CARE SECTOR... 53
3.1 IN T R O D U C T IO N ...53
3.2 C O N C E P T S A N D M E T H O D O L O G IC A L IS S U E S ... 53
3.2.1 D efining the equity concept(s) a n d outputs fro m a n a lysis...54
3.2.2 A rea level f o r g eograph ical a n a lysis...54
3.2.3 M ethods u sed...55
3.2.3.1 Building a d a ta b a s e ... 56
3.2.3.2 Design form at and indicators in u s e ... 57
3.2.3.3 Tools for analysis of inequality...58
3.3 G E O G R A P H IC A L A N A L Y S IS ...59
3.3.1 D em ographic ch aracterisation...59
3.3.2 Socio-econom ic inform ation...60
3.3.3 H ealth care co v e ra g e...61
3.3.4 H ospital su p p ly...62
3.3.4.1 Capital infrastructure... 62
3.3.4.2 E quipm ent... 63
3.3.4.3 Human r e s o u r c e s ... 64
3.3.5 Population a cc essib ility...66
3 .3 .7 H ospitals ’ investment a n d a g e...69
3.3.8 Expenditure on acute care h o sp ita ls...73
3.3.9 O ther v a ria b le s...75
3.4 C O N S E Q U E N C E S F O R P O L IC Y ... 79
3.5 C O N C L U D IN G R E M A R K S ... 80
SECTION II...82
4 CHAPTER 4 - SETTING A CAPITATION FORMULA TO MEASURE GEOGRAPHIC INEQUITIES... 83
4.1 IN T R O D U C T IO N ... 83
4.2 U S IN G A C A P IT A T IO N F O R M U LA T O M E A SU R E G E O G R A P H IC IN E Q U IT IE S ... 83
4.2.1 Literature re v ie w...83
4.2.2 M ethodological con cern s...87
4.3 C A P IT A T IO N FO R M U LA : C O U N T R Y A P P L IC A T IO N ... 89
4.4 T Y P O L O G Y OF G E O G R A P H IC IN E Q U IT Y IN D IC E S ...93
4.5 C O N C L U D IN G O B S E R V A T IO N S ... 96
5 CHAPTER 5 - A CAPITATION FORMULA TO MEASURE NEED FOR HOSPITAL CARE... 97
5.1 IN T R O D U C T IO N ... 97
5.2 M E T H O D O L O G IC A L IS S U E S ...97
5.3 A D JU S T M E N T F O R P O P U L A T IO N ...100
5.3.1 M eth od...100
5.3.2 Results a n d discussion...102
5.4 A D JU S T M E N T FO R D E M O G R A P H Y ... 105
5.4.1 M eth od...105
5.4.2 Results a n d discussion...J07 5.5 A D JU S T M E N T F O R A D D IT IO N A L N E E D ...115
5.5.1 M eth o d...115
5.5.2 Results an d discussion...121
5.6 IM PL IC A T IO N S FO R P O L IC Y A N D C O N C L U D IN G R E M A R K S ... 125
6 CHAPTER 6 - A MULTILEVEL MODEL TO ESTIMATE UNAVOIDABLE COSTS AND TO DISENTANGLE CAUSES OF INEFFICIENCIES IN HOSPITAL CARE...127
6.1 O B JE C T IV E S ... 127
6.2 P R O B L E M S T R U C T U R IN G ...128
6.2.1 U navoidable co st adju stm ents...128
6.2.2 R elevan t literatu re...130
6.2.3 The Portuguese con text...134
6.2.3.1 Review of relevant literature... 134
6.2.3.2 Country inform ation-setting... 135
6.3 S T O C H A S T IC H IE R A R C H IC A L M O D E L S ...138
6.3.1 H ierarchical co st m o d e l...140
6.3.1.1 C ost m odel... 140
6.3.1.2 Hierarchical m odel... 142
6.3.2 H ierarchical f ix e d effects m odel (HFEM )...144
6.3.3 M u ltilevel random intercepts a n d slopes m odel (M LM )...144
6.4 E M P IR IC A L M O D E LS A N D R E S U L T S ...148
6.4.1 Data, variables, sam ple characteristics a n d estim ation tech niqu es...149
6.4.2 Results a n d a n a lysis...152
6.4.3 E stim ates o f unavoidable costs a n d g eograph ical redistribu tion...158
6.4.3.1 Definition...159
6.4.3.2 Empirical results on unavoidable co sts at th e hospital level...160
6.5 D IS C U S S IO N A N D F U R T H E R R E S E A R C H ... 161
6 . 6 C O N C L U D IN G R E M A R K S ... 162
7 CHAPTER 7 - A FLOW DEMAND MODEL TO ESTIMATE AND PREDICT HOSPITAL UTILISATION...163
7.1 IN T R O D U C T IO N ...163
7.2 M O D E L L IN G H O SP IT A L U T IL IS A T IO N ... 166
7.2.1 Literature re v ie w...166
7.2.1.1 Theoretical m o d e ls... 167
7.2.1.2 Empirical evidence and te ch n iq u e s in u s e ...169
7.2.1.3 W e a k n e sse s of previous stu d ie s... 172
7.2.2 M eth odological approach: O verview...174
7.2.2.1 Flows and alternative hospital index... 175
7.2.2.2 Econom etric m odelling...176
7.3 A F L O W D E M A N D M O D E L F O R H O S P IT A L C A R E ... 178
7.3.1 C onceptual m o d e l...179
7.3.2 The flo w -d em a n d econom etric m o d e l...184
7.3.2.1 Two-part m odel...185
7.3.2.2 Estim ation te c h n iq u e s...188
7.3.2.3 M ethodological is s u e s ...190
7.4 A P P L IC A T IO N T O T H E P O R T U G U E S E H O S P IT A L S Y S T E M ... 193
7.4.1 D a ta set building a n d m easurem ent issu es...193
7.4.2 Econom etric resu lts...199
7.4.2.1 First part m odel...199
7.4.2.2 S econd part m odel...201
7.4.3 D iscussion o f re su lts...203
7.4.3.1 Implications of resu lts...203
7.4.3.2 How th e flow d em an d model could be further d e v e lo p e d ...204
8 CHAPTER 8 - GEOGRAPHIC INEQUITY ESTIMATES IN THE PORTUGUESE HOSPITAL FINANCING SYSTEM... 207
8.1 IN T R O D U C T IO N ... 207 8.2 R E S U L T S FR O M A D JU S T M E N T S A T T H E D IS T R IC T L E V E L ...208
8.2.1 N eeds adjustm ent index...208 8.2.2 U navoidable costs in dex...210 8.2.3 C ross-boundary flo w s index...213 8.2.4 Synthesis o f a ll adjustm ents a t the district le v e l...217
8.3 R E S U L T S OF E ST IM A T ES O F IN E Q U IT Y IN D IC E S ... 218 8.4 D IS C U S S IO N AND C O N C L U D IN G R E M A R K S ...222
8.4.1 Consequences f o r P ortuguese h ospital p o lic ie s...222 8.4.2 D iscussion o f m eth ods...224 8.4.3 Concluding observation s...225
SECTION III...227
9 CHAPTER 9 - LOCATION-ALLOCATION MODELS TO REDISTRIBUTE
HOSPITAL SUPPLY...228
9.1 O B JE C T IV E S ...228 9.2 L IT E R A T U R E R E V IE W ... 230
9.2.1 M ethodological issues f o r location litera tu re...230 9.2.2 M u lti-spatial o b je ctive s...231 9.2.3 S patial m odels...233
9.2.3.1 Spatial interaction m o d e ls...233 9.2.3.2 Entropy m o d e ls... 234 9.2.3.3 M athem atical program m ing m o d e ls...235
9.2.4 Specific issues in health resea rc h...237
9.3 E X P E R IM E N T A L D E S IG N ...238
9.3.1 G eneric stru ctu re...240 9.3.2 The three alternative m o d e ls...242 9.3.3 F ram ew ork f o r analysis o f ou tpu ts...249
9.4 M O D E LS F O R IM PR O V IN G G E O G R A P H IC E Q U IT Y ... 252
9.4.1 D istan ce-based m odel - D B M...254
9.4.1.1 Structure of th e p rogram ... 255 9.4.1.2 Form ulation...255
9.4.2 U tilisation -based m o d e l-U B M...258
9.4.2.1 Structure of th e problem ... 259 9.4.2.2 Form ulation...260
9.4.3 U tilisation flo w s-b a se d m o d e l-U F B M...263
9.5.1 C om parison o f the three m o d els...269 9.5.2 Im plications f o r p o lic y a n a lysis...275 9.5.3 Im proving the m o d els...27 6
9.6 C O N C L U D IN G R E M A R K S ...277
10 CHAPTER 10 - CONCLUDING REMARKS...279
10.1 O V E R V IE W ...279 10.2 IM PL IC A T IO N S F O R P O L IC Y A N A L Y S IS ... 284 10.3 F U R T H E R R E S E A R C H ... 285
BIBLIOGRAPHY... 287
APPENDICES...313
TABLE OF TABLES
T A B L E 1.1: STU D IES O N E Q U IT Y IN H E A L T H C A R E F IN A N C E ...9
TA B L E 1.2: S T R U C T U R E OF T H E C H A PT E R S O F T H E T H ES IS (S E C T IO N I)... 13
TA B L E 1.3: S T R U C T U R E OF T H E C H A PT E R S O F T H E T H E S IS (S E C T IO N II)...14
T A B L E 1.4: S T R U C T U R E OF T H E C H A PT E R S OF T H E T H E S IS (S E C T IO N III)... 14
T A B L E 2.1: IN D IC A T O R S F O R S EL E C T E D C O U N T R IE S ... 21
T A B L E 2.2: P O P U L A T IO N H E A L T H STA TU S A N D H E A L T H C A R E U T IL IS A T IO N FO R SEL E C T E D C O U N T R IE S ... 22
T A B L E 2.3: SO M E P O L IT IC A L A N D P O L IC Y S T A T E M E N T S C O N C E R N E D W IT H E Q U IT Y ...23
T A B L E 2.4: O T H E R P O L IT IC A L A N D P O L IC Y S T A T E M E N T S ... 24
T A B L E 2.5: P R O V ID E R S C H A R A C T E R IS E D A L O N G T H E P U B L IC /P R IV A T E S P E C T R U M ...40
T A B L E 2.6: P U B L IC /P R IV A T E SH A R ES IN SO M E P H Y S IC A L R E S O U R C E S A N D U T IL ISA T IO N IN D IC A T O R S F O R H O SP IT A L C A R E ...41
T A B L E 2.7: F IN A N C IN G BY S O U R C E IN P E R C E N T A G E OF T O T A L E X P E N D IT U R E ...42
T A B L E 2.8: B U D G E T IT E M S ... 45
T A B L E 2.9: B R E A K D O W N OF H O S P IT A L C O S T S ... 45
T A B L E 2.10: H U M A N R E S O U R C E S IN D IC A T O R S ... 48
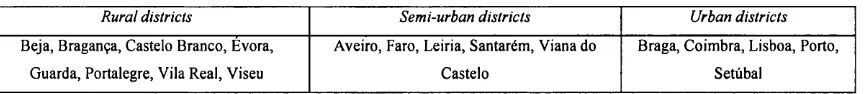
T A B L E 3.1: D IS T R IC T S C LA SSIFIE D IN T H E R U R A L /U R B A N S P E C T R U M ... 57
T A B L E 3.2: SO M E IN D IC A T O R S OF H O S P IT A L SU P PL Y OF C L A S S IF IE D H O SP IT A L S (S A M P L E )...57
TA B L E 3.3: H O S P IT A L SEC T O R R E L A T E D V A R IA B L E S ... 57
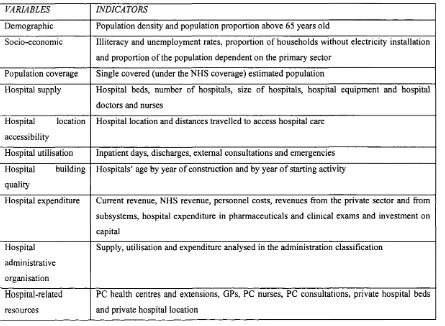
TA B L E 3.4: H O S P IT A L V A R IA B L ES A N D C O R R E S P O N D IN G IN D IC A T O R S F O R A N A L Y S IS ... 58
T A B L E 3.5: R E S ID E N T VS. N H S P O P U L A T IO N ... 62
T A B L E 3.6: H O S P IT A L BED S VS. P O P U L A T IO N ...63
T A B L E 3.7: SO M E C O M P A R A T IV E S T A T IS T IC S ...65
T A B L E 3.8: A V E R A G E D IS T A N C E S (IN K IL O M E T R E S ) T R A V E L L E D IN O R D E R T O FIN D IN P A T IE N T C A R E ...67
T A B L E 3.9: C O R R E L A T IO N S A T T H E D IS T R IC T L E V E L ...6 8
T A B L E 3.11: M ISS IN G D A T A ON H O SP IT A L Y E A R OF C O N S T R U C T IO N O R O N H O SP IT A L Y E A R OF B E G IN N IN G A C T IV IT Y ... 69
T A B L E 3.12: E X P E N D IT U R E (% D IS T R IB U T IO N A C R O S S D IS T R IC T S )...73
T A B L E 3.13: H O SP IT A L S C L A S SIFIE D P E R A D M IN IS T R A T IV E G R O U P A N D SO M E D E S C R IP T IV E IN D IC A T O R S 1...76
T A B L E 3.14: H O SP IT A L S C L A S SIFIE D P E R A D M IN IS T R A T IV E G R O U P A N D SO M E D E S C R IP T IV E IN D IC A T O R S I I ...76
T A B L E 3.15: P R IM A R Y C A R E -D IS T R IB U T IO N IN T E R M S OF SO M E P A R A M E T E R S ... 77
T A B L E 3.16: H O S P IT A L P R IV A T E S EC T O R IN D IC A T O R S ...78
T A B L E 4.1: N O T A T IO N IN U S E ... 93
T A B L E 4.2: G E O G R A P H IC IN E Q U IT Y IN D IC ES A T T H E D IS T R IC T L E V E L ...94
T A B L E 5.1: E X PE N D IT U R E A N D U T IL IS A T IO N V A LU E S A T T H E N A T IO N A L L E V E L ...109
T A B L E 5.2: N O T A T IO N IN U S E ... 118
T A B L E 5.3: R A N K -P E A R M A N C O R R E L A T IO N S B E T W E E N SM RS F O R P O R T U G A L , A N D F O R E N G L A N D A N D W A L E S ...121
T A B L E 5.4: C O R R E L A T IO N S B E T W EE N SM RS A N D A L T E R N A T IV E H E A L T H O U T C O M E IN D IC A T O R S (E X C L U D IN G E X TE R N A L C A U S E S )... 124
T A B L E 6.1: N O T A T IO N IN U S E ...139
T A B L E 6.2: V A R IA B L E S A T TH E H O SPIT A L L E V E L ... 150
T A B L E 6.3: C O E F F IC IE N T E ST IM A T ES OF T H E H FE M A N D M L M ...153
T A B L E 6.4: A V E R A G E OF A L L O C A T IV E IN E F F IC IE N C Y E S T IM A T E S A N D H O S P IT A L LE V E L R E S ID U A L S V A R IA T IO N S A T T H E G R O U P L E V E L ...158
T A B L E 6.5: U C P E R O U TP U T , AS A P E R C E N T A G E O F N A T IO N A L U C P E R O U T P U T ... 161
T A B L E 7.1: N O T A T IO N IN U S E ...177
T A B L E 7.2: D A T A B A S E S O U R C E S ... 196
T A B L E 7.3: C O V A R IA T E S (O R C O N C E P T U A L E X P L A N A T O R Y V A R IA B L E S ) IN C L U D E D IN T H E D A T A B A S E (E X C L U D IN G IN T E R A C T IO N T E R M S ) A N D H Y P O T H E S IS E D B E H A V IO U R ...197
T A B L E 7.4: F IR S T P A R T L O G IT M O D E L ... 200
T A B L E 7.5: S EC O N D P A R T G LM M O D E L (P O IS S O N D IS T R IB U T IO N OF E R R O R S A N D LOG L IN K )... 202
T A B L E 8.1: N O T A T IO N IN U S E ... 207
T A B L E 8.2: N E E D A D JU S T M E N T IN D IC E S ... 210
TA B L E 8.4: A D JU S T M E N T S (N E E D , C B FS A N D U C S ) IN T H E M U L T IP L IC A T IV E M O D E L ...217
T A B L E 8.5: G E O G R A P H IC IN E Q U IT Y E S T IM A T E S ...219
T A B L E 9.1: L O C A T IO N A N D L O C A T IO N -A L L O C A T IO N M O D E L S VS. V A R IA B L E S TO BE C A L C U L A T E D W IT H IN TH E M O D E L S ... 231
T A B L E 9.2: V A R IET Y OF M P M O D E LS F O R P U B L IC A N D H E A L T H C A R E FA C IL IT IE S L O C A T IO N ... 236
T A B L E 9.3: T H R E E M P M O D E L S ... 239
T A B L E 9.4: Q U A L IT A T IV E D E S C R IP T IO N OF M P M O D E L S ... 244
T A B L E 9.5: N O T A T IO N IN U SE (A N D M O D E L W H E R E V A R IA B L E IS U S E D )...248
T A B L E 9.6: M E A SU R E S OF E Q U IT Y A N D P O L IC Y R E L A T E D C R IT E R IA ... 251
T A B L E 9.7: Q U A N T IT A T IV E D IF FE R E N C E S B E T W E E N M O D E LS (B U T KEY
F E A T U R E S )... 253
T A B L E 9.8: U T IL ISA T IO N IM PA C T S W IT H A R E D IS T R IB U T IO N OF 20% OF SU P PL Y B O T H ON L O W E R A N D U PP E R B O U N D ...269
T A B L E 9.9: D IS T A N C E IM PA C T S W IT H A R E D IS T R IB U T IO N O F 20% OF S U P PL Y B O T H ON L O W E R A N D U P P E R B O U N D ...269
T A B L E 9.10: N U M B E R OF W IN N ER S A N D L O SE R S W IT H A R E D IS T R IB U T IO N O F 20% OF S U PPLY B O T H ON L O W E R A N D U P P E R B O U N D ... 269
T A B L E 9.11: N E W L E V ELS OF S U P P L Y ... 270
T A B L E 9.12: V A R IA T IO N IN U T IL IS A T IO N B Y D IS T R IC T (U F B M )... 270
TABLE OF FIGURES
F IG U R E 2.1: N H S S T R U C T U R E B A S E D O N T H E N H S O R G A N IC L A W ...34
F IG U R E 3.1: G E O G R A P H IC A L B O U N D A R IE S OF 5 H E A L T H R E G IO N S A N D 18 H E A L T H SUB - R E G IO N S (D IS T R IC T S )... 55
F IG U R E 3.2: P O P U L A T IO N D E N S ITY (IN H A B IT A N T S IN SQ U A R E K IL O M E T R E S ) A N D P O P U L A T IO N P O R T IO N A B O V E 6 5 ...59
FIG U R E 3.3: IL L IT E R A C Y A N D U N E M P L O Y M E N T R A T E S ... 60
FIG U R E 3.4: P R O P O R T IO N OF H O U S E S W IT H O U T E L E C T R IC IT Y IN S T A L L A T IO N A N D P R O P O R T IO N OF P O P U L A T IO N D E P E N D E N T O N P R IM A R Y S EC T O R A C T IV IT IE S ...6 1
FIG U R E 3.5: H O S P IT A L B E D S P ER 100,000 IN H A B IT A N T S ... 63
F IG U R E 3.6: L O R E N Z C U R V E S F O R P U B L IC H O S P IT A L B E D S A N D F O R T H R E E T Y PE S OF E Q U IP M E N T ... 64
F IG U R E 3.7: L O R E N Z C U R V E S F O R P U B L IC H O SP IT A L R E S O U R C E S ... 65
F IG U R E 3.8: H U M A N R E S O U R C E S PER 100,000 IN H A B IT A N T S , N O R M A L IS E D BY TH E N A T IO N A L A V E R A G E ...6 6
F IG U R E 3.9: H O S P IT A L D O C T O R S P E R 100,000 IN H A B IT A N T S ...6 6
F IG U R E 3.10: D IS T R IB U T IO N OF P U B L IC H O S P IT A L B E D S IN P O R T U G A L (BY C O N C E L H O )... 67
F IG U R E 3.11: L O R E N Z C U R V ES OF P U B L IC H O S P IT A L B E D S A N D IN P A T IE N T D A Y S ...6 8
F IG U R E 3.12: C U M U L A T IV E N U M B E R OF H O SP IT A L U N IT S A T SO M E PO IN T S IN T IM E (B Y Y E A R OF C O N S T R U C T IO N A N D BY Y E A R OF B E G IN N IN G A C T IV IT Y )...70
F IG U R E 3.13: N U M B E R OF BED S (1996) A L L O C A T E D T O T H E Y E A R OF B E G IN N IN G A C T IV IT Y (C O R R E C T )... 71
F IG U R E 3.14: D IS T R IB U T IO N OF H O S P IT A L BED S IN N E W H O S P IT A L S C O N S T R U C T E D B E F O R E 1900 (N U M B E R OF BED S: 5,6 5 7 )... 72
F IG U R E 3.15: D IS T R IB U T IO N OF H O SP IT A L BED S IN N E W H O S P IT A L S C O N S T R U C T E D IN T H E P E R IO D 1900-1979 (N U M B E R O F BED S: 11,278)...72
F IG U R E 3.16: D IS T R IB U T IO N OF H O SP IT A L BED S IN N E W H O S P IT A L S C O N S T R U C T E D IN T H E P E R IO D 1980-1996 (N U M B E R OF B ED S: 7 ,0 2 3 )...73
F IG U R E 3.18: D IS T R IC T T O T A L R E V E N U E P E R C A P IT A , N O R M A L IS E D B Y T H E N A T IO N A L P E R C A P IT A A V E R A G E ... 74
F IG U R E 3.19: L O R E N Z C U R V E S -G P S V S. H O S P IT A L D O C T O R S ... 77
F IG U R E 3.20: H O SP IT A L D O C T O R S VS. G PS S U PPLY P E R D IS T R IC T ...77
F IG U R E 3.21: L O C A T IO N O F P R IV A T E H O SP IT A L S (TR Y T O C H A N G E )...78
F IG U R E 4.1: SET OF A D JU S T M E N T S T O B E IN T E G R A T E D IN A C A P IT A T IO N F O R M U L A TO M E A SU R E IN E Q U IT IE S IN T H E P O R T U G U E S E H O SP IT A L S Y S T E M ... 90
F IG U R E 5.1: PR O C ESS OF T E C H N O L O G Y T R A N S F E R A N D O U T P U T S FR O M A N A L Y S IS ... 99
F IG U R E 5.2: R E S ID E N T P O P U L A T IO N E S T IM A T E S E V O L U T IO N 1 9 9 0-98... 103
F IG U R E 5.3: 1995 B A SED P O P U L A T IO N P R O JE C T IO N S F O R T H E Y E A R 2000 A T T H E N U T S II R E G IO N L E V E L IN C O M P A R IS O N W IT H 31.12.1995 R E S ID E N T P O P U L A T IO N E S T IM A T E S ... 104
F IG U R E 5.4: A G E /S E X C O S T C U R V E (E X P E N D IT U R E P E R C A P IT A ) (P O R T U G A L ) (€ ’S )...108
F IG U R E 5.5: A G E C O S T C U R V ES N O R M A L IS E D BY T H E N A T IO N A L C O S T A V E R A G E (PO R T U G A L A N D E N G L A N D )... 108
F IG U R E 5.6: P ER C A P IT A E X P E N D IT U R E D E C O M P O S IT IO N BY A G E G R O U P (P O R T U G A L ) (€ ’S )... 109
F IG U R E 5.7: P E R C A P IT A E X P E N D IT U R E D E C O M P O S IT IO N B Y A G E G R O U P (EN G L A N D ) (£ ’S )... 110
F IG U R E 5.8: A V E R A G E C O S T BY CA SE P E R A G E /SE X G R O U P (P O R T U G A L ) ( € ’S ) ... 111
FIG U R E 5.9: A V E R A G E C O S T P E R C A SE B Y A G E /S E X G R O U P (E N G L A N D ) (£ ’S )...I l l
F IG U R E 5.10: C A SES P E R 1,000 IN H A B IT A N T S B Y A G E /S E X G R O U P (P O R T U G A L )...112
F IG U R E 5.11: E PIS O D E S P E R 1,000 IN H A B IT A N T S B Y A G E /S E X G R O U P (E N G L A N D )... 112
F IG U R E 5.12: A V E R A G E LO S (IN D A Y S ) BY A G E /S E X G R O U P (P O R T U G A L )... 113
FIG U R E 5.13: A V E R A G E LO S (IN D A Y S ) BY A G E /S E X G R O U P (E N G L A N D )...113
FIG U R E 5.14: 3 -Y E A R U N D E R -65 SM RS (1995/6/7) E X C L U D IN G E X T E R N A L C A U S E S ... 122
FIG U R E 5.15: SM RS VS. IL L IT E R A C Y R A T E S ... 122
FIG U R E 5.16: P Y L L VS. A SM R S VS. S M R S ... 124
F IG U R E 6.1: D E C O M P O S IT IO N B E T W E E N A V O ID A B L E A N D U N A V O ID A B L E C O S T S F O R EA CH G R O U P OF H O S P IT A L S ... 148
FIG U R E 6.2: A L L O C A T IV E IN E F F IC IE N C Y -R A N D O M SLO PE C O M P O N E N T O F T H E R A N D O M C O E F FIC IE N T S F O R T H E RA TIO BED S T O D O C T O R ... 158
F IG U R E 7.1: P A T IE N T S ’ B E H A V IO U R IN F O R M A T IO N , AS A N IN P U T T O A L O C A T IO N - A L L O C A T IO N M O D E L ... 164
F IG U R E 7.2: A FLO W D E M A N D M O D E L F O R P U B L IC H O S P IT A L C A R E A T T H E S M A L L A R E A L E V E L ...179
F IG U R E 8.1: U C IN D IC E S F O R M LM M O D E L ... 212
F IG U R E 8.2: C B FS IN D IC ES C O M P U T E D U N D E R PF A N D N F ...216
F IG U R E 8.3: C B FS IN D E X VS. SU PPLY A T T H E D IS T R IC T L E V E L ... 217
FIG U R E 8.4: H O S P IT A L D O C T O R S P E R C A P IT A (N O R M A L IS E D B Y N A T IO N A L A V E R A G E ) VS. IN E Q U IT IE S IN C A P IT A L (IN D E X 1)... 220
F IG U R E 8.5: IN E Q U IT IE S IN U T IL IS A T IO N (IN D E X 3 ) ...221
FIG U R E 8.6: IN E Q U IT IE S IN FIN A N C E (IN D E X 4 ) ... 222
F IG U R E 9.1: S IM U L T A N E O U S S PA T IA L R E D IS T R IB U T IO N OF H O S P IT A L S U P PL Y A N D V A R IA T IO N S OF U T IL IS A T IO N FLO W S IN A L O C A T IO N -A L L O C A T IO N M O D E L ...241
F IG U R E 9.2: V A LU E T R E E R E P R E S E N T IN G E Q U IT Y A N D P O L IC Y -R E L A T E D C R IT E R IA ... 251
C H A P T E R 1 - Introducing geographic equity
1 CHAPTER 1 - Introducing geographic equity
1.1 Introduction
Under Constitutional law, Portugal has a democratic state that is committed to building
a society based on freedom, fairness and solidarity, and promoting welfare, quality o f
life o f citizens and equality (Assembleia da Republica 1992). After the ending o f almost
50 years o f dictatorship, the democratic government created a National Health Service
(NHS) with universal coverage in 1979, but the NHS is still far from achieving its
intended objectives.
The NHS has universal coverage and is financed by general taxation, in which the State
assumes a critical role in provision, financing and regulation. The State is responsible
for ensuring a minimal level o f access to health care for all citizens and seeks to achieve
some kind o f equity (discussed in Chapter 2). Citizens are entitled to health protection,
under a universal NHS, nearly free at the point o f use, where contributions should
depend upon ability to pay. Whilst it is likely that there were equity gains after the
introduction o f the NHS (with universal coverage and increases in health care provision
and utilisation), the current system suffers from multiple inequities, for example: in
health, associated with socio-economic characteristics; in finance o f health care, which
is regressive; in the distribution o f human and material resources, with concentration o f
material and human resources in urban areas; and in access, with segments o f the
population enjoying multiple coverage.
This thesis aims to generate information for the development o f policies pursuing
geographical equity in the hospital financing system, in light o f the absence o f
significant relevant information. This chapter reviews the current understanding o f
inequity in the theoretical literature and empirical studies o f inequity in the Portuguese
context, defining the research areas to which this thesis seeks to contribute and the
C H A P T E R 1 - Introducing geographic equity
1.2 Geographical equity in health policy
This section explains the interconnections between equity, geographical equity and
other policy objectives, analyses the conceptual significance o f geographical equity, and
problematises the issues involved in measuring geographical inequities. This discussion
is focused on resource allocation.
1.2.1 Defining the equity concept(s)
There is a vast body o f literature on equity, equity in health, and equity in health care in
particular1. The following analysis draws on this literature to examine the concept o f
equity in health policy, the importance o f analysing geographical equity, as well as a
'y
range o f different measures o f geographical equity .
Equity might be defined in several ways, “depending upon the values o f the person
using it at the time” (Le Grand 1987), but all definitions share “some view o f fairness o f
the distribution o f something or other” (Mooney 1983). In many health care systems, it
is precisely because o f equity o f access that health care finance does not depend on
willingness to pay. But making services free at the point o f delivery is necessary, but
not sufficient condition for attaining equity o f access and other equity objectives, as
patients incur other costs too. The pioneering work o f the Resource Allocation Working
Party (RAWP) defined equity as “equal access for those in equal risk” (Department o f
Health and Social Security (United Kingdom) 1976), which was the accepted aim for
resource allocation in the United Kingdom (UK) until recently3; in Italy, the policy o f
promoting equity is “ ... to overcome territorial inequalities in social and health
1 T he equity discussion in the health context has debated the problem o f p lacing alternative conceptions o f equity in a w ider philosophical fram ew ork (Le G rand 1987), som ething that has n ot been achieved up to the m om ent. O nly fragm ented and m ultidisciplinary perspectives exist and these have created a sense o f failure (P ereira 1993).
2 It is im portant to note that equity is exam ined here as a m acro level objective, at the top o f the political system . T his im plies that ju d g e m en ts are broad and not d irectly related to m edical practice (C ulyer and W a g sta ff 1992), or to other m icro health care unit issues.
C H A P T E R 1 - Introducing geographic equity
conditions” (Rice and Smith 1999). The concept o f equity o f access has been
systematically referred to in policy statements o f most Western European countries
(including Portugal) (Pereira 1993)4. Chapter 2 shows that equity appears to be one o f
the fundamental objectives o f Portuguese health policy, and in its various formulations
is compatible with the concept o f “equal access for those in equal need”.
Any definition o f equity implicitly involves a comparison o f different individuals across
the same or different circumstances -th e former case is involved in the pursuit o f
horizontal, while the latter in the pursuit o f vertical equity (McGuire, Henderson, and
Mooney 1988)5. For publicly financed health care systems, the two main areas o f equity
research have been equity in access to health care across socio-econom ic groups/classes
and geographically (McGuire, Henderson, and M ooney 1988). This thesis focuses on
the second o f these research areas. Geographical equity is a useful concept for both
needs assessment and planning purposes (Department o f Health and Social Security
(United Kingdom) 1976) and provides the basis for the allocation o f resources across
areas.
Various definitions o f geographical equity can be used, in terms o f public expenditure,
final income, use, cost and income (Le Grand 1982); expenditure per capita, inputs per
capita, inputs for equal need, access for equal need, utilisation for equal need, marginal
met need and health (M ooney 1983). This thesis makes use o f some o f these definitions
that are related to equity o f access. As none o f these equity definitions has been proved
to be superior to others, the choice o f which definition to use is a matter o f judgment
and dependent on the specific context, while the objective chosen may be in conflict
with other seemingly similar objectives (Culyer and W agstaff 1992). For example,
seeking equality o f utilisation may be influenced by supplier induced demand, but, in
comparison with the equality o f inputs, equality o f utilisation has the advantage o f
allowing for differences in tastes and preferences (Pereira 1990).
care services (B lack et al. 1982) (W hitehead 1995). R ecently, a new and additional definition has been used in E ngland and is analysed in the sub-section below .
C H A P T E R 1 - Introducing geographic equity
1.2.2 G eographical equity
A number o f issues ought to be considered when addressing geographical equity in
health policy. First, geographical equity in health care competes with other concepts o f
equity, such as socio-econom ic equity and equity in health outcomes. This brings up the
old question o f whether inequity is influenced more by individual or by contextual
factors (such as place) -although these are often correlated (Duncan, Jones, and Moon
1998). Geographical equity in access to health care might also be seen either as an
ultimate or as an intermediate objective to achieving equity in health6. For example,
although England has equalised health expenditure across areas (while accounting for
area characteristics), inequalities in health have persisted. It has been argued that focus
on spatial inequity can obscure other kinds o f inequalities, such as those o f race and
class, and risks losing sight o f the structural basis o f inequality (Johnston, Gregory, and
Smith 1994).
Second, one should define which geographical inequalities are inequities. A s M ooney et
al. observed (M ooney and McGuire 1987): “it is possible to have equitable inequalities
and inequitable equalities”. Inequities can be seen as ‘unfair’ inequalities and the
relationship between inequalities and inequities is complex. In general, geographical
location is expected to impact on costs to access health care in three ways (Rice and
Smith 1999): variations in need, variations in health care supply and policy, and
variations in the extent to which need is expressed in utilisation. For example, this thesis
shows that Lisboa and Porto have a higher share o f resources than their fair shares based
on need for hospital care; but their shares o f resources in utilisation and finance (when
accounting for the impact o f variations in supply) are below their fair shares.
Consequently, any formulation o f policies to correct inequities o f access w ill demand a
definition o f which inequalities matter most. The methods used in this thesis partly test
the impact o f pursuing alternative definitions o f equity, and show the difficulties
associated with the design o f policies for equity.
5 In practice, the pursuit o f vertical and horizontal equity o bjectives is often co n flicting (exam ple: m easurem ent issues).
C H A P T E R 1 - Introducing geographic equity
Third, geographical equity relates to the concept o f territorial justice. If there was local
choice over expenditure on the NHS, then this could result in inequities in health
n
resources across areas as an outcome o f local democratic choices . Hence, analysis o f
the geographical distribution o f resources should account not only for need, but also for
need and right (Powell and Boyne 2001), which would take into account the distribution
o f health care resources to regions as a result o f devolution. In Portugal, NHS
expenditure is determined centrally and equalisation o f resources between geographical
areas is consistent with the principle o f horizontal equity o f access o f individuals in
o
different jurisdictions o f residence . This thesis focuses on analysis at the central level
to improve equity o f access across geographical areas. It disregards considerations o f
the implications o f local choice for justifying variations in the use o f hospital resources.
This is understandable in the context o f central planning and means focusing on the
creation o f similar opportunity sets for health outcomes across areas (in terms o f
provision o f hospital services).
1.2.3 Problem s in formulating and using a definition of equity
Even i f the objective o f equity is defined as “equal opportunity o f access to health care
for those at equal need” (in the geographical context), difficulties still remain. Due to
problems o f measuring personal access costs9 (Le Grand 1987), this objective has been
redefined as equal inputs for equal need (M ooney and McGuire 1987). But there are
problems in measuring need in the light o f continuing debate over which proxies are
best and over supply issues (in terms o f capital stock, staff and variations in labour
costs)10,11.
7 Local decisions allow for choice and local preferences, w hile central decisions look at central funding, regulation and the relationship betw een scale efficiency and equity.
8 T he exception for this are A zores and M adeira for w hich there is political and financial devolution: governm ents o f the islands receive blocks o f expenditure from central g o vernm ent and decide h ow m uch to spend in d ifferent social areas. As explained in C hapter 2, the islands are excluded from the analysis in this thesis.
9 P ersonal costs are here defined as indirect costs related w ith specific circum stances o f a population, excluding g eographic accessibility issues - e .g . the im pact th a t living alone or having children (m ain ly for w om en) m ight have on health care access.
10 T here are m any difficulties in com paring betw een people (population characteristics) and am ong services, on a w ide range o f health care variables (physical and hum an resources, expenditure, capital, etc). T he choice o f these variables is subjected to judg m en t.
C H A P T E R 1 - Introducing geographic equity
Additionally, and also related to the point made above on the instrumental role o f
equity, a focus on improving health care does not necessarily lead to better health for
the population in question. While health is related to the physical and emotional well
being o f an individual or a defined population, health care is related to the goods,
services, time, knowledge and other variables that can be seen as inputs to produce
health (Folland, Goodman, and Stano 1997). Even if the ultimate objective is to
improve health on the whole, it is not clear that equity o f access to health care should be
the main health policy objective (Pereira 1993). During the 1980s and 1990s, England
accepted that tackling health care inequalities would contribute to equity improvements
and the focus on health care instead o f health has been based on the main argument that
health care can be redistributed by health policy, while health itself cannot (Le Grand
1987). However, empirical studies have showed that despite health care policy
interventions with equity objectives, the gap on