Journal of Criminal Law and Criminology
Volume 74
Issue 2
Summer
Article 6
Summer 1983
The Importance of Interim Decisions to Felony
Trial Court Dispositions
Stevens H. Clarke
Susan T. Kurtz
Follow this and additional works at:
https://scholarlycommons.law.northwestern.edu/jclc
Part of the
Criminal Law Commons
,
Criminology Commons
, and the
Criminology and Criminal
Justice Commons
This Criminology is brought to you for free and open access by Northwestern University School of Law Scholarly Commons. It has been accepted for inclusion in Journal of Criminal Law and Criminology by an authorized editor of Northwestern University School of Law Scholarly Commons.
Recommended Citation
0091-4169/83/7402-476
TilE JOURNAL OF CRIMINAL LAW & CRIMINOLOGY Vol. 74, No. 2
Copyright 0 1983 by Northwestern University School of Law Printed in US.A.
CRIMINOLOGY
THE IMPORTANCE OF INTERIM
DECISIONS TO FELONY TRIAL
COURT DISPOSITIONS*
STEVENS H. CLARKE**
SUSAN T. KURTZ***
I. INTRODUCTION
"Interim decisions may be of greater consequence to discretionary justice than final decisions."' This observation by Kenneth Culp Davis constitutes the chief theme of this Article: the extent to which interme-diate processes and decisions affect the criminal trial court's final dispo-sition. The study presented here treats criminal court disposition not as a single decision but rather as the result of a number of separate admin-istrative processes. The adminadmin-istrative processes on which the study fo-cuses-jailing defendants before trial, providing defense service to indigent defendants, and plea bargaining---exhibit much variation, probably because they are largely exempt from any sort of review. The study compares the effect of these interim processes on the final disposi-tion to the contribudisposi-tion of such "basic factors" as the defendant's char-acteristics and the strength of the legal case against him or her.
Section II of the Article outlines the data and methods used in the study. Section III provides a brief description of the defendants and the dispositions they received, as well as some material on plea bargaining
* The research on which this article is based was partially supported by a grant from the National Institute of Justice to the North Carolina Governor's Crime Commission. Neither agency is responsible for the contents of the article.
** Associate Professor of Public Law and Government, Institute of Government, Univer-sity of North Carolina at Chapel Hill. LL.B., Columbia UniverUniver-sity, 1966; A.B., Harvard
University, 1958.
*** Rand Corporation, Santa Monica, CA; formerly Research Coordinator, Institute of Government, University of North Carolina at Chapel Hill. Ph.D., University of North Caro-lina at Chapel Hill, 1983; M.A., University of North Carolina at Chapel Hill, 1978; B.A., University of California at San Diego, 1976.
INTERIM DECISIONS
laws and practices in the jurisdiction studied. Section IV presents re-gression models developed to measure the association of basic factors and administrative processes with court dispositions. Our findings are summarized in Section V. Section VI suggests some reforms that are consistent with the study results.
II. DATA AND METHODS
The data on which most of this Article is based were drawn from court and police records concerning the prosecution and court disposi-tion of 1,378 defendants charged with felonies in twelve North Carolina counties during three months in 1979.2 These twelve were chosen as a reasonable cross-section of the state's 100 counties.3 The three urban
counties-Mecklenburg, Buncombe, and New Hanover--dominate the data because they have many more felony defendants than the rural counties, but urban counties have a higher incidence of felony defend-ants throughout the state.4
Our aim was to identify factors that influenced, or at least were correlated with, the decisions made in the criminal process. Therefore, in collecting the data, we sought to reconstruct the information known to the various decision-makers--especially the police and the district at-torney-at the time of prosecution. We searched local police and court records that were then accessible to the police and prosecutor. These records included: (1) the complaint file (the police or sheriff's record of the crime report); (2) the police or sheriff's record of the crime investiga-tion, which was sometimes part of the -complaint file, sometimes a sepa-rate record, and sometimes part of the arrest record; (3) the police or sheriffs record of the arrest; (4) the trial court record folder or envelope plus all of the papers it contained; (5) the trial court name index files,
2 Most defendants' cases reached disposition in 1979, although a few remained pending until 1980. For Mecklenburg County, defendants whose charges were filed in January through March 1979 were studied; in the other eleven counties, we studied defendants whose charges were filed in April through June 1979.
3 One urban county was selected from each region of the state-western, central, and
eastern. The non-urban counties were grouped into twelve categories corresponding to the twelve cross-classifieations of region, size of the court workload, and an assessment of overall court efficiency. One non-urban county was selected at random from each of these twelve categories. Later, to reduce travel costs, a non-urban county was eliminated at random from each region, leaving nine non-urban counties. The twelve counties varied greatly in geo-graphical size and population. The 1980 populations ranged from 14,934 (Yancey) to 404,270 (Mecklenburg). BUREAU OF THE CENSUS, U.S. DEP'T OF COMMERCE, 1980 CENSUS
OF POPULATION, Vol. 1, Part 35, Table 45, at 162 (1982).
4 The breakdown of the 1,378 defendants in the sample by county was: Mecklenburg (including Charlotte)-35.8%; New Hanover (including Wilmington)-14.7%; Buncombe (including Asheville)-13.6%; Rockingham (including Reidsville)-10. 1%; Craven (including New Bern)-6.1%; Hamett-5.9%; Rutherford-5.0%; Anson-3.0%; Cherokee, Granville, Pasquotank, and Yancey-5.8%.
CLARKE AND KURTZ
searched to ensure that all of the defendant's companion cases were cap-tured; and (6) the district attorney's files.
Our data do not completely describe what the police and the prose-cutor actually knew at the time of prosecution for at least two reasons: they sometimes had important information not kept in any available record, and they may not have looked at all of the records that we ex-amined. We believe, however, that information written in the records had an important influence on the outcome of prosecution, and our sta-tistical analysis supports this' belief.5
The unit of data in our analysis was the individual defendant. When a defendant had more than one felony charge-and 30% of the 1,378 defendants did (see Table 1)-all concurrently processed felony charges were traced through the records of both the district and superior
court.6 In collecting the data, the "principal" charge was emphasized,
but some information was also collected on companion charges. The principal charge was the charge on which the defendant received the longest active (unsuspended) prison sentence; if acquitted, the principal charge was that with the longest statutory maximum sentence.
The data included:
* Characteristics of the defendant-age, race, sex, employment, resi-dence, and criminal record.
* Important aspects of the case against the defendant-the number of felony charges, the principal charge, the number of codefendants, and information on evidence and extent of injury or damage caused by the crime.
* Information about the victim, including his or her relationship to the defendant.
* Details of the processing of the defendant's charges, with emphasis on the principal charge.
5 We regard these data as reasonably representative of felony prosecution and sentencing in North Carolina in 1979, even though they were not drawn from a random sample. The multivariate statistical methods we used, in which the simultaneous effects of a number of variables were taken into account, made it less likely that a finding regarding any single variable could be due to sampling bias.
6 Data on accompanying misdemeanor charges were usually not collected, but such charges rarely had worse consequences than felony charges.
INTERIM DECISIONS
TABLE 1
TWELVE-COUNTY SAMPLE: DISTRIBUTION OF DEMOGRAPHIC AND CHARGE VARIABLES
Percentage (N)
Defendant's Age:
Total 100.0 (1,378)
14-18 years 23.0 (317)
19-21 20.9 (288)
22-26 20.4 (281)
27-30 11.2 (155)
31-40 12.9 (178)
41 and over 9.1 (125)
Missing 2.5 (34)
Defendant's Race:
Total 100.0 (1,378)
Black 47.5 (655)
Indian 0.2 (3)
Other minority 0.6 (8)
White 50.9 (702)
Unknown 0.7 (10)
Defendant's Sex:
Total 100.0 (1,378)
Male 87.7 (1209)
Female 12.2 (168)
Unknown 0.1 (1)
Total Felony Charges:
Total 100.0 (1,378)
One 69.6 (959)
Two 17.1 (236)
Three 4.6 (64)
Four or more 8.6 (119)
Total Number of Codefendants:
Total 100.0 (1,378)
None 59.4 (819)
One 24.2 (333)
Two 9.6 (132)
Three or more 6.8 (94)
County Where Charge(s) Filed:
Total 100.0 (1,378)
Anson 3.0 (42)
Buncombe 13.6 (187)
Cherokee 1.2 (17)
Craven 6.1 (84)
Granville 1.5 (21)
Harnett 5.9 (81)
[image:5.454.65.383.67.617.2]CLARKE AND KURTZ
TABLE 1 CONTINUED
Percentage (N)
Mecklenburg 35.8 (494)
New Hanover 14.7 (203)
Pasquotank 2.4 (33)
Rockingham 10.1 (139)
Rutherford 5.0 (69)
Yancey 0.6 (8)
Percentage Percentage
Type of Principal Felony Charge of Total of this Class (N)
Class 1 - Violent Felonies 23.6 (325)
Murder and manslaughter 8.6 (28)
Assault without intent to kill 31.7 (103)
Assault with intent to kill 19.7 (64)
Rape 9.5 (31)
Burning (includes arson) 5.2 (17)
Common law robbery 7.4 (24)
Armed robbery 14.2 (46)
Kidnapping 3.7 (12)
Class 2 - Felonious Larceny, 45.9 (633)
Breaking or Entering, etc.
Burglary 3.8 (24)
Breaking or entering 13.3 (84)
Breaking or entering and 45.8 (290)
larceny combined
Larceny 27.5 (174)
Possession or receipt of stolen 9.6 (61)
goods
Class 3 - Fraud, Forgery, 11.9 (164)
Embezzlement, etc.
Fraud (includes larceny by 59.8 (98)
employee, embezzlement, false pretense, theft of credit card, etc.)
Forgery and uttering (passing) 40.2 (66)
forged instrument
Class 4 -Drug Felonies 13.4 (185)
Manufacture, sale, or possession 61.6 (114)
for purpose of sale of controlled substance
Possession of controlled 38.4 (71)
substance
[image:6.454.77.390.60.596.2]INTERIM DECISIONS
TABLE 1 CONTINUED
Percentage Percentage Type of Principal Felony Charge of Total of this Class (N)
Class 5 - Morals Felonies
(primarily crime against nature 1.9 (26) and indecent liberties with
child)
Class 6 - Other Felonies 3.3 (45)
Felonious escape 57.8 (26)
Other (including felonious 42.2 (19) leaving scene of accident)
TOTAL -All Classes 100.0 (1,378)
The study used such techniques of statistical analysis as tabulations of means and proportions. Regression modelling was used to test the effect of each variable while controlling for others. This technique has the same limitation in the present study as it has in any study that is-and must be-an analysis of a "slice of history" rather than a controlled experiment; it is impossible to be certain that all extraneous factors of importance have been identified and properly measured. As a result, an apparently significant relationship between an independent variable and the dependent variable may in reality be attributable to some other unknown or improperly measured factor.7
III. DEFENDANTS AND DISPOSITIONS
A. DEFENDANTS AND THEIR CHARGES
The felony defendants in the twelve-county sample were mostly young males (see Table 1); only 12.2% were female. The median age was twenty-three, and half of the defendants were between nineteen and thirty years of age. Forty-seven and five-tenths percent of the defend-ants were black-more than twice the proportion of blacks in the gen-eral population.8 Most defendants resided in the county where they were prosecuted; only 3.8% were out-of-state residents.
Defendants were divided into six classes based on the type of felony with which they were initially charged (see Table 1). The classes were
7 In the regression analysis, we did not test for interaction effects. In fitting the models, we sought to obtain an estimated average effect of our variables, one that would lend itself to straightforward interpretation. We expected that if there were interaction effects, they would not be dramatic, and that at least the direction of each variable's effects would be the same over levels of other variables.
8 In the twelve-county sample, the proportion of blacks was 47.5%; among male defend-ants aged 15 to 29, 48.2% were black. This last proportion was much greater than the propor-tion of blacks among males age 15 to 29 in the twelve counties in 1980-25.4%. BUREAU OF THE CENSUS, supra note 3, at 162-86.
[image:7.454.62.384.71.219.2]CLARKE AND KURTZ
Class 1-violent felonies (23.6% of the defendants); Class 2-felonious breaking or entering, larceny, possession and receiving of stolen goods, and related offenses (45.9%); Class 3-fraud felonies like forgery, ob-taining property by false pretense, and credit card fraud (11.9%); Class 4-drug felonies (13.4%); Class 5-"morals" felonies (1.9%); and Class 6--other felonies (3.3%).
B. COUNSEL, PRETRIAL RELEASE, AND PRETRIAL DETENTION
Most defendants (86.2%) were known to have been represented by counsel; only 6.7% were known to have been unrepresented, and 7.1% had an unknown counsel status (see Table 2). Thirty-four percent paid for their own attorney; the courts found 27.9% indigent and appointed individual attorneys to represent them. Another 24.3% were found
indi-TABLE 2
TWELVE-COUNTY SAMPLE: ATTORNEY, PRETRIAL RELEASE, AND
PRETRIAL DETENTION
Percentage (N)
1. Type of attorney:
Total 100.0 (1,378)
No attorney 6.7 (93)
Public defender 24.3 (335)
Individually appointed 27.9 (384)
Private counsel 34.0 (468)
Unknown 7.1 (98)
2. Type of pretrial release:
Total 100.0 (1,378)
Written promise to appear 4.5 (62)
Unsecured appearance bond 11.7 (161)
Third-party custody 12.0 (166)
Secured bond: cash deposit 2.5 (35)
Secured bond: real or personal property 1.7 (24)
Secured bond: accommodation bondsman 14.4 (199)
Secured bond: professional bondsman 27.0 (372)
Released but type unknown 1.6 (22)
Not released 22.5 (310)
Not arrested 0.9 (12)
Unknown 1.1 (15)
25th 75th
N Mean Median Percentile Percentile
3. Days of pretrial detention 1,344 15.81 1.00
[Vol. 74
INTERIM DECISIONS
gent and were represented by a public defender. Public defender offices existed in only two of the twelve counties studied-Buncombe and Mecklenburg-but these two counties contributed half of the defend-ants in the sample.
All but twelve of the 1,378 defendants' prosecutions began with an arrest. About one-fifth (22.5%) of the arrested defendants were not leased before trial (see Table 2). The remaining arrested defendants re-ceived some form of pretrial release.9 Considering all of the arrested defendants together, the median time they spent in detention before their first release was one day, and the mean was 15.8 days. Twenty-five percent of the defendants spent thirteen or more days in pretrial detention. 10
C. COURT DISPOSITIONS
Figure 1 depicts the various court dispositions for the 1,350 felony defendants whose cases began by arrest or summons, together with the median time from arrest or summons that elapsed in reaching each type of disposition. It excludes the twenty-eight defendants who were in-dicted directly and never passed through district court. The district court disposed of nearly half of these defendants without indictments.'I This rate of pre-indictment felony disposition may seem high. Recent research'2 indicates, however, that disposition of felonies before indict-ment is common in other jurisdictions.
Twenty-six and two-tenths percent of all the defendants had all their charges dismissed in district court. The prosecutor entered most of the district court dismissals, accounting for 20.2% of the defendants' dis-positions; the district court dismissed only 5.9% of the defendants for lack of probable cause. Pleas of guilty to lesser-included misdemeanor charges were also common in district court; 20.6% of the felony
9 Of the arrested defendants, 27.0% were released on an appearance bond secured by a professional bondsman, 14.4% on a bond secured by a nonprofessional surety such as a friend or relative, 2.5% on a bond secured by a cash deposit, and 1.7% on a bond secured by a mortgage of real or personal property. Another 11.7% of the arrested defendants obtained release on unsecured bond, 12.0% were released in the custody of a third party who agreed to supervise them, and 4.5% were released on a written promise to appear.
10 The main North Carolina statutes on pretrial release are N.C. GEN. STAT. §§ 15A-521 to -544 (1978).
11 If the defendant "appealed" his district court conviction and thereby received a trial de
novo in superior court, or if he were indicted later after a district court dismissal for lack of probable cause, we collected data on the superior court disposition. Thus, these 47.9% went no further than district court-otherwise they would have been counted among the superior court
dispositions.
12 See K. BROSI, A CROss-Crry COMPARISON OF FELONY CASE PROCESSING (1979), and sources cited therein.
CLARKE AND KURTZ
FIGURE 1.
COURT PROCESSING DIAGRAM: TWELVE COUNTIES
Felony defendants whose cases began by arrest or summons
100%
(Total 1350)
DISTRICT COURT 26.2% 22 days
I
Voluntary Dismissal By Prosecutor 19.0%21 days
I
Dismissal With Leave
Prosecutor
1.2-7,
114days
I I
Dismissal PJC
By By Judge 0.1% 5.9% 43days
2 Idays
GRAN
"No True Bill" 0.6% 60days SUPERIC Dism 8017 1.32d
Voluntary Dismissal D
Dismissal By With Leave By By Prosecutor Prosecutor 0.
6.2% 1.0% I1
128days 156days
Ac
II
Pled Guilty To Misdemeanor
20.6%
22 days
Plea Bargain On Other Record Guilty Plea
5.5% 15.1%
21days 22days
(Carge Redured to Misdemeanor)
DISTRICT COURT TRIAL
1.0%
25days
Acquittal Misdemeanor Conviction
0.5% 0.5%
l6days 28days Went To Grand Jury
52.2%
JURY
Went To Superior Court
51.6%
RCOURT
issed Or PJC Pled Guilty
37.8%
lays 94days
l Plea Bargain n Reor Other Guilty
26.77, 11.1%
smissal PJC 100days 72days
y Judge 0.1% 6% 134days
9days Pled Guilty To Pled Guilty Pled Guilty To Pled Guilty Misdemeanor To Felony Misdemeanor To Felony
8.2% 18.4% 2.1% 9.0%
108days 96days 79days 72days SUPERIOR COURT TRIAL 5.8%* 115 days
Conviction 4.6%
I I4days
quittal
2%
6days Misdemeanor Felony Conviction Conviction 0.3% 4.3%
73days 116days
[image:10.454.60.403.33.577.2]INTERIM DECISIONS
prosecutions were disposed of in this way. Most of these district court misdemeanor pleas did not involve a recorded plea bargain, although they required the prosecutor's approval. A few felony defendants (1%) had their charges reduced to misdemeanors and were tried by a district court judge; half of these were acquitted.
A grand jury considered the cases of 52.2% of the defendants shown in Figure 1. Very few defendants, 0.6% of the total, were discharged by the grand jury's refusal to issue an indictment. The rest, 51.6%, were indicted and proceeded to superior court. At this point, a defendant's chance of having all charges dismissed was much lower than it had been in district court; only 8.0% of all defendants, 15.5% of those indicted, were so fortunate.1 3 The most common outcome in superior court-accounting for 37.8% of all defendants and 73.3% of the indicted defend-ants-was a guilty plea. Usually this plea was part of a plea bargain whose terms were recorded on a form designed for that purpose. Most guilty pleas in superior court were to felony charges.
Only 5.8% of all the felony defendants described in Figure 1 re-ceived complete jury trials. Jury trials were rare and risky; conviction was four times as likely as acquittal, and the offense of conviction was almost always a felony rather than a misdemeanor.
Nearly two-thirds (63.7%) of all the felony defendants were eventu-ally convicted; 32.5% of the total were convicted of felonies, and 31.2% were convicted only of misdemeanors (see Table 3). The district attor-ney dismissed all the felony charges of 27.4% of the defendants without further prosecution, and another 6.5% had all felony charges dismissed by a judge, producing an overall dismissal rate of 33.9%. The remaining 2.4% received trial acquittals, "no true bills" (discharges by the grand
jury), or "prayer for judgment continued" (PJC).1 4
What about sentences? About one-third (36.3%) of the 1,378 felony defendants in the twelve counties were not convicted of any charge and thus received no sentence. Twenty-seven and four-tenths percent re-ceived active sentences-22.3% in the form of regular prison
13 Most of the superior court dismissals were by the prosecutor.
14 A tiny proportion of the felony defendants (0.2%) received the dispostion of "PJC"
("prayer for judgment continued") in district court, and these dispositions were counted as dismissals. A "PJC" is a suspended imposition of sentence. State v. Miller, 225 N.C. 213, 215, 34 S.E. 2d 143, 144 (1945). It usually involves a plea of guilty by the defendant to a charge (in district court this would be a misdemeanor charge), after which the judge postpones imposition of sentence, sometimes on certain specific conditions. If the conditions are no more than payment of court costs, the PJC is not a judgment, N.C. GEN. STAT. § 15A-101(4a) (1978); if other conditions are imposed, it operates as a kind of probation without conviction. Although the judge may impose a sentence later if the defendant violates the conditions he has set, this rarely occurs.
CLARKE AND KURTZ
TABLE 3
TWELVE-COUNTY SAMPLE: COURT DISPOSITION AND
SENTENCE
Percentage (N)
1. Disposition
Total 100.0 (1,378)
Voluntary dismissal by prosecutor 25.2 (347) Dismissal with leave by prosecutor 2.2 (30)
Dismissal by judge 6.5 (89)
Prayer for judgment continued ("PJC") 0.2 (3) Grand jury refused to indict ("No True Bill") 0.6 (8) Plea bargain on record 32.7 (451)
Other guilty plea 25.9 (357)
Trial acquittal 1.7 (23)
Trial conviction 5.1 (70)
ALL DISMISSALS (includes 3 "P JCs") 34.0 (469)
ALL CONVICTIONS INCLUDING GUILTY
PLEAS AND TRIALS 63.7 (878)
Conviction of felony 32.5 (448) Conviction of misdemeanor only 31.2 (430)
ALL TRIALS 6.8 (93)
2. Type of Sentence
Total 100.0 (1,378)
No conviction 36.3 (500)
Fine and/or costs 3.7 (51)
Restitution or restitution plus fine 0.4 (6)
Unsupervised probation 7.1 (98)
Supervised probation 25.1 (346)
Special probation (active time plus probation) 5.1 (70)
Active imprisonment 22.3 (307)*
25th 75th
N Mean Median Percentile Percentile
3. Total active minimum prison term for defendants who received active time (in
years) 377* 3.62 0.67 0.00 4.00 4. Total active maximum
prison term for defendants who received active time
(in years) 377* 7.14 3.00 0.50 7.00
*Active imprisonment in this table is not reduced by credit for pretrial detention. When
such credit was subtracted, 365 (not 377) defendants actually had to serve time in prison or jail.
[image:12.454.67.398.58.476.2]INTERIM DECISIONS
terms and 5.1% in the form of special probation (see Table 3).15 An-other 25.1% received supervised probation without imprisonment, and 7.1% received unsupervised probation. Four and one-tenth percent re-ceived neither probation nor prison but were ordered to pay a fine, court costs, or restitution.
For the 377 defendants who received active prison sentences,16 the median length of the maximum prison term was 3.0 years and the me-dian length of the minimum prison term was 0.7 years. The mean maxi-mum sentence was 7.1 years and the mean minimaxi-mum sentence was 3.6 years. Only 25% of the maximum sentences exceeded seven years.17
D. PLEA BARGAINING AND ITS RELATIONSHIP TO SENTENCING
Plea bargaining is firmly established in North Carolina. Legisla-tion enacted in 1974 recognized the legitimacy of plea bargaining and set some rules governing the practice.18 The prosecution and defense may discuss the possiblity that the prosecutor "will not charge, will dis-miss, or will move for the dismissal of other charges, or will recommend or not oppose a particular sentence" in exchange for the defendant's plea of guilty to one or more charges. 19 The trial judge is authorized to participate in these discussions.20 Before accepting a guilty plea pursu-ant to a plea bargain in which the prosecutor has agreed to recommend a particular sentence, the judge must advise the parties whether he ap-proves of the bargain and will sentence the defendant accordingly. If the judge does not approve, neither the prosecution nor the defendant is
15 Special probation is a suspended sentence with up to six months to serve in jaii or
prison as a condition of the suspension, usually followed by a period of probation supervision. See N.C. GEN. STAT. §§ 15A-1351(a), -1343(b)(16) (1978).
16 Lest these prison sentences seem lenient, it should be remembered that not all were
imposed for felony convictions-26% were imposed for misdemeanor convictions.
17 It should be remembered that the full maximum sentence would rarely have been
served, because of parole and credit for good behavior. Unpublished data recently obtained by the authors from the North Carolina Department of Correction concerning adult felons who were released from prison in 1981 indicate that the average felon served from one-fourth to one-third of his maximum sentence.
18 The intent of the 1974 legislation, according to the Criminal Code Commssion's official
commentary, was "to bring plea negotiations out of the back room and put them on the record." N.C. GEN. STAT. ch. 15A, art. 58. Much variation in North Carolina plea bargain-ing practice has been noted in two previous studies. See Bond, Plea Bargainbargain-ing in North Caro-lina, 54 N.C.L. REV. 823 (1976); Lefstein, Plea Bargaining and the Trial Judge, the New ABA Standards, and the Need to Contro/Judicial Discretion, 59 N.C.L. REV. 477, 489-94 (1981). New determinate sentencing legislation, not effective until after the study described here, could increase plea bargaining regarding the sentence, because it makes a plea-bargained sentence exempt from the requirement that the judge give written reasons for a non-presumptive fel-ony sentence. See Comment, Cr'minal Procedure-The North Carolina Fair Sentencing Act, 60 N.C.L. REV. 631, 643 (1982).
19 N.C. GEN. STAT. § 15A-1021(a) (1978).
20 Id.
CLARKE AND KURTZ
bound by the bargain; the defendant is then entitled to a postponement until the next session of court, when a new judge is presiding, and the parties may resume negotiations and try again.2 1
Of the 1,378 felony defendants in our twelve-county sample, 808 (58.6%) pled guilty to at least one charge; 28.2% pled guilty to at least one felony, and 30.4% pled guilty only to misdemeanors (see Table 4). Thus, more than half of the guilty pleas involved felony-to-misdemeanor charge reductions.
TABLE 4
TWELVE-COUNTY SAMPLE: PLEA BARGAINING AND SENTENCE RECOMMENDATIONS
1. Percentage of Defendants Who Pled Guilty to Misdemeanors or Felonies
Percentage Number
No plea 41.4 (570)
Plea to misdemeanor 30.4 (419)
Plea to felony 28.2 (389)
Total 100.0 (1378)
2. Type of Plea for Defendants Who Pled Guilty
Written Plea Bargain
No Written
Plea Bargain
Percentage (Number) Percentage (Number)
Plea to misdemeanor 44.6 (187) 55.4 (232) (419)
Plea to felony 67.9 (264) 32.1 (125) (389)
Total 55.8 (451) 44.2 (357) (808)
3. Sentence Recommendations for Guilty Pleas to Either Misdemeanors or
Felonies
Percentage Number
Specific sentence recommended 27.0 (218)
in written plea bargain
No specific sentence 28.8 (233)
recommended in written plea bargain
Plea without written bargain 44.2 (357)
Total 100.0 (808)
21 Id.; N.C. GEN. STAT. §§ 15A-1023(b), -1021(c), commentary at 277-78, 280.
[image:14.454.59.409.219.592.2]INTERIM DECISIONS
TABLE 4 CONTINUED
4. Consolidation for Judgment Recommendations for Guilty Pleas to Either Misdemeanors or Felonies
Percentage Number
Consolidation for judgment 6.2 (50) recommended in written
bargain
No consolidation for judgment 22.2 (179) recommended in written
bargain
No companion cases 27.5 (222)
Plea without written bargain 44.2 (357)
Total 100.0 (808)
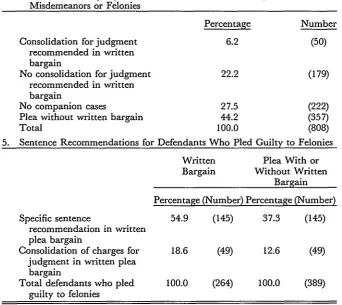
5. Sentence Recommendations for Defendants Who Pled Guilty to Felonies
Written Plea With or Bargain Without Written
Bargain
Percentage (Number) Percentage (Number)
Specific sentence 54.9 (145) 37.3 (145) recommendation in written
plea bargain
Consolidation of charges for 18.6 (49) 12.6 (49) judgment in written plea
bargain
Total defendants who pled 100.0 (264) 100.0 (389) guilty to felonies
Of the 808 defendants who pled guilty, 451 (55.8%) did so pursuant to a written plea bargain-a recorded statement of a guilty plea and its terms and conditions. These written terms and conditions included the concessions granted by the state for the guilty plea; for example, the state would agree to accept a plea to a reduced charge, to dismiss a companion charge, or to recommend a particular sentence. The rest of the guilty pleas, 44.2%, did not involve a quid pro quo expressed in a written statement. But our count of written plea bargains conserva-tively estimates the number of quidpro quo situations. Many of the other guilty pleas probably involved unwritten understandings between the defendant and the prosecutor or the judge.
Of the defendants who pled guilty pursuant to a written plea bar-gain, 44.6% pled only to misdemeanors (see Table 4). Of those who pled guilty without a written bargain, a greater proportion, 55.4%, received a felony-to-misdemeanor reduction.
The data show a strong association between the dismissal of
[image:15.454.57.400.83.388.2]CLARKE AND KURTZ
panion22 charges and pleading guilty pursuant to a written bargain, which suggests that multiple charges were a major advantage to the prosecution. Of the 419 defendants who pled guilty to misdemeanors, most were charged with only one felony. Consequently, only a small proportion of these defendants had companion charges dismissed. Ta-ble 5 shows the relationship between guilty pleas and dismissal of com-panion charges. The 389 defendants who pled guilty to one or more felonies were more likely to have companion charges, especially the 264 who pled guilty to a felony in a written plea bargain (of whom 63.6% had companion charges). Of these 264 defendants, 9.1% had one or more companion charges dismissed in district court, and 40.5% had companion charges dismissed in superior court. Of the 168 defendants who (1) had companion felony charges and (2) pled guilty in a written bargain to one or more felonies, many had companion charges dis-missed-14.3% in district court and 63.7% in superior court. Most of these dismissals were part of the bargain.2 3
What about plea bargains regarding the sentence? Of the 808 fel-ony defendants who pled guilty to some charge, 27.0% did so pursuant to a written plea bargain in which the prosecutor agreed to recommend a specific length or type of sentence (see Table 4), and 6.2% did so in a written bargain in which the prosecutor agreed to recommend consoli-dation for judgment of one or more companion felony charges with the principal felony charge.2 4
Considering just the 389 defendants who pled guilty to felonies (see Table 4), 12.6% agreed to plead guilty in exchange for the prosecutor's written agreement to consolidate two or more of their charges for judg-ment, and 37.3% had the prosecutor's written agreement to recommend a specific sentence. Of the 264 defendants who pled guilty to a felony pursuant to a written plea bargain, 54.9% did so in exchange for a prose-cutor's recommendation of a specific sentence, with approval by the
22 If a defendant had other felony charges besides his principal charge, we called these "companion felony charges."
23 A total of 157 defendants pled guilty to some charge pursuant to a written plea bargain and also had companion charges dismissed. In 116 (74%) of these written plea bargains, the dismissal of companion charges was specifically mentioned as a condition of the bargain.
24 Consolidating the charges for judgment limits the sentence severity: if a prison sen-tence is imposed for the consolidated charges, it must be a single term no longer than the longest maximum authorized for any of the charges. State v. McCrowe, 272 N.C. 523, 524, 158 S.E.2d 337, 339 (1968).
INTERIM DECISIONS
(= CD
-C14 cNJ
co
-FFF' C
co 4
CO n l
c'zFOC-Co
t-,tL ' 0
-l -
q-o -0
CO
"It-CO
R
-co r-<a6 oi c'i CM
-o Ln
CO
0'
0
ou 0
0 -. 1. -oO £= o
w 0 0
0
c
.d
0
o
-o o -a 0 0
E R o E
0.42
oa)
- Os
19831
0
0l 0
S.
0..
0
CL Q 0
ca
0t:
0 v rz
o0
CLARKE AND KURTZ
judge.25 Another 18.6% of these 264 defendants received the prosecu-tor's written agreement to consolidate two or more charges for judgment.
IV. MODELS OF COURT DISPOSITIONS A. MODELLING STRATEGY
We used multiple regression to develop statistical models of the pro-cess that led to various trial court dispositions. Having hypothesized that a number of relationships could exist between various factors pres-ent in felony cases and the outcomes of prosecution, we then tested and measured all of these possible relationships simultaneously. The tests confirmed or supported some relationships; others were found not to be statistically significant and were rejected.
Separate analyses were done of defendants charged with the two most common types of felonies: Class 1-violent felonies-accounted for 24% of the defendants in the twelve-county sample; and Class 2-burglary, breaking or entering, larceny, and possession and receiving of stolen goods-accounted for 46% of the defendants. We expected that separate analyses would generate better estimates of various factors' ef-fects on court disposition, because the type of offense charged could in-fluence the impact of other factors.
When a defendant had more than one felony charge, his charges may have received different dispositions by the court. As the defend-ant's disposition, we chose the worst disposition received (from the de-fendant's point of view); the charge receiving the worst disposition was called the "principal" charge. We divided court dispositions into two primary categories--dismissal and sentencing. Dismissal simply meant that all of the defendant's felony charges were dismissed, usually by the prosecutor, and that no conviction of any charge resulted, not even a misdemeanor reduced from a felony. In the model, we used the logit (the logarithm of the odds) of dismissal as the dependent variable and employed a maximum likelihood method.26
Sentences were determined for all defendants who pled guilty to
25 Of the 264 defendants who pled guilty to a felony with a written plea bargain, 25.4% received probation as recommended by the prosecutor as part of the bargain, and 29.5% received active prison sentences as recommended by the prosecutor. In collecting data on plea arrangements in which the state agreed to recommend a particular sentence, we counted only those that were approved by the sentencing judge pursuant to N.C. GEN. STAT. § 15A-1023(b) (1978).
26 The odds of an event occurring (or the "odds ratio") are equal to the probability of its occurring divided by the probability of itsnot occurring. For example, if an event occurs with probablity .8, the odds of its occurrence are .8/.2 = 4, or "4 to ." The maximum likelihood estimation procedure is explained in McFadden, Conditional Logit Analysis of Qualitative Choice Behavior, in FRONTIERS IN FcONOMETRICS 105 (Zaremka ed. 1973). We used the LOGIST
INTERIM DECISIONS
any felony or reduced misdemeanor or were convicted at trial, as well as the very few (twenty-three out of 1,378 defendants) who went to trial and were acquitted. The acquitted defendants were considered to have received "zero sentences" so that our analysis could account for the pos-sible benefits as well as the pospos-sible disadvantages of going to trial rather than pleading guilty.
The sentence imposed on the defendant was expressed in three ways: (1) the odds27 in favor of receiving any active imprisonment, (2) the total active maximum prison term imposed, and (3) the time until earliest possible release from prison on the term imposed.28 When the defendant was either acquitted at trial or received a sentence involving no active imprisonment, both his total active maximum prison term and his time to earliest possible release from prison were considered to be zero.
The time to earliest possible release from prison on the defendant's sentence may be the best of our three measures of sentence severity. Presumably most defense attorneys, prosecutors and judges understand the basic rules of serving prison terms and take these rules into account in bargaining about the sentence. Conversations with practitioners sug-gest that the time to earliest release from prison may be the "coinage" of plea bargaining, because felony defendants considering a plea bargain involving imprisonment are most interested in how soon they may be released from prison.
In order not to confuse the effects of administrative variables with the effects of basic factors in the regression analysis, we used a hierarchi-cal approach. First, the dependent variable in logarithm form was re-gressed on the basic factors; these included personal characteristics of
procedure in the SAS language. See Harrell, The LOGISTProcedure, in THE SAS SUPPLEMEN-TAL LIBRARY USER's GUIDE 3 (Reinhardt ed. 1980).
27 See supra note 26.
28 In the models of the last two sentence variables, the logarithms rather than the actual
values were used to reduce the distorting effects of a few very severe sentences. One month was added to each value before computing its logarithm. If the defendant received a prison sentence, the time to earliest release from prison was computed as the least amount of time he could serve in prison before either becoming eligible for parole or being unconditionally dis-charged, whichever would come first. In a few instances, an inmate could be unconditionally discharged before becoming eligible for parole. When a defendant sentenced to imprison-ment became eligible for parole immediately, we assigned a value of two months to his time or earliest release to allow for minimum administrative delay. (North Carolina's laws of pa-role eligibility are in N.C. GEN.'STAT. §§ 15A-1371 to 1380.2, 148-49.15 (1978 & Supp. 1981).) The total maximum prison term was computed by selecting the longest of any group of concurrent prison terms, adding any consecutive terms, and then subtracting the time the defendant spent in pretrial detention, for which he must receive credit under N.C. GEN.
STAT. ch. 15, art. 19A (1978). When the defendant received a nonprison sentence or was
acquitted, both the total maximum prison term and the time to earliest release were
consid-ered zero.
CLARKE AND KURTZ
the defendant-such as age, race, and sex-as well as aspects of the legal case against him--charge, criminal record, evidence, and victim-defend-ant relationships.29 Next, basic factors not associated with the depen-dent variable at least at the .05 level were excluded. Then the dependent variable was regressed on the remaining basic factors plus administrative variables to form two additional models: (1) the "com-plete" model (including detention time, a binary attorney variable [as-signed versus all other categories], and, if the dependent variable was sentence severity, whether the defendant went to trial or pled guilty); and (2) the "attorney differences" model (including a five-level attorney variable but excluding detention time and plea/trial). Before comput-ing each model, we tested for multicollinearity; each independent varia-ble was regressed using ordinary least squares on all other independent variables, and if the resulting R2 exceeded .5, the variable was removed. In fact, the administrative variables (detention, attorney, and plea/trial) proved to have very little correlation with other independent variables.
Table 6 combines the results of all of these models, indicating the effects that tested significant at the .05 level, expressed as percentage increases (+) or decreases (-) for each unit increment in the correspond-ing independent variable.30
B. BASIC FACTORS
I Defendant's Charge and Codefendants
As expected, the defendant's charge or charges and any codefen-dants influenced the final disposition. The seriousness of the initial prin-cipal charge, which we measured as the maximum prison term allowed by law for the offense, did not affect the odds that all of the defendant's charges would be dismissed, but it did significantly affect the severity of the sentence imposed on the defendant who pled guilty or went to trial. The sentence generally became more severe as the seriousness of the charge increased, for both Class I and Class 2 defendants (see Table 6). As more felony charges were initially filed against the Class I or Class 2 defendant, the odds that all charges would be dismissed decreased, and the likely severity of the sentence increased. We thought that the pres-ence of codefendants would make dismissal more likely for each defend-ant, on the theory that there were more suspects available to "take the
29 Although the county or prosecution was in a sense an administrative variable, it could not be "caused by" any other factor. It was included in the basic factors model.
30 These percentages are actually the antilogarithms of the unstandardized coefficients, minus one. All binary independent variables had the value one when a condition was present and zero when it was absent.
INTERIM DECISIONS
0 0
5
0
00
0
o
V2 00
0
.e~-c'4
u
co
. IC. c'4 0 c-i
c-i m .0 -t-E
+: C6 - -:
+
-+
+
-+ -+
.0 . .0
IO
.0
aC-I +
ca
0
0
I-r.2
to 'o 0
o 0
-00
0 . c
I a0 0 u CU20
CIS S
0 a -0
In
.0.0 0.
.0 I
cd 0
Cu0
c:S 0 0 C
0
0
0,-0 0 Cu
o A
0>'c -0
0 -0 cl .
0d bo bo
03
0
0l 0
'UCa
0!'o
1983]
.0 .0 .0 .00 ui a
CLARKE AND KURTZ
.0.0 x '; . . .0 ,x .0 .0
+
0
p4
00
0
o
0
0 00
00
U o E
U U o-
>. 2
00
~
-~
U r 4C' m0 0 0 0
0
0 .0.0.0.0
(0
71 +
*0
.0000
+
[Vol. 74
v 0
0 0
v 0 u
°d
c o
0. 0.
0
0 C
2A z
c~0 -.
*0
0-0
.0-c6 ci.0 .0 .0
co co
.0o. Q0.0t
0)0 C> CI .0.0 -4 i 0
toI
0 0nU
.0 .00
0~~
CL-*0 0 ot
_u
0- =~S.
0 0
0
0
00.
1983] INTERIM DECISIONS 497
H ca cz cle
cc n + +
1- C4 t6 C
0~ +
-sot
>.( ccU i '
C)>
cl 4)
e0 cC~ - a >C .5.o
--
-o
~~
+C Ec -.'00 >~ )~ E
- --
~ ~
~
~
o~
~
~
.- aO -
--C. c)4c Eo~ 0 >
SS c .0 ca C:
-E . 2.C o
0- EC" CS
C 0 o
~0
OcdE-l = S - C
C)0 0 0
z-
C 0 .
-~~~~~ D*~~U~ 0. 4
CLARKE AND KURTZ
rap." We found the presence of codefendants to be significantly associ-ated with greater odds of dismissal for Class 1, but not Class 2,
defendants.
2. Defendant's Prior Criminal Record
A defendant's prior criminal record was not significantly associated with the likelihood that all charges would be dismissed, but it was asso-ciated with severity of the sentence he received if the charges were not dismissed. Being on probation or parole at the time of prosecution meant a much greater chance of receiving an active prison sentence for Class 2, but not Class 1, defendants. It also meant a longer maximum prison term and longer time to serve before earliest possible release from prison for both Class 1 and Class 2 defendants. Finally, the number of prior convictions was positively associated with severity of sentence; the more prior convictions, the greater the odds that a defendant would re-ceive an active prison sentence. Moreover, for Class 2 defendants, as the number of prior convictions increased, so would the length of the likely prison term and the time to earliest possible release from prison.3'
3. Defendant's Social and Economic Characteristics
The defendant's age evidently had little impact on the court's final disposition. The only clear effect of age was that defendants aged twenty-one to twenty-five received more severe sentences than defend-ants under twenty-one, not with respect to their likelihood of receiving an active prison term or the length of their maximum prison term, but with respect to the time to earliest release from prison.32 Notably, other age groups-defendants twenty-six to thirty and those over thirty-did not differ significantly from those under twenty-one, with two excep-tions: those over thirty in Class 2 were more likely to have their charges dismissed, and those over thirty in Class 1 were more likely to avoid imprisonment than those under twenty-one.
The chance that a defendant's charges would be dismissed was not significantly associated with the defendant's race, but if he was charged with a Class 2 offense, sentence severity was associated with race. Black Class 2 defendants received significantly more severe sentences than white Class 2 defendants; black defendants had a 73% greater chance of receiving a prison sentence, a 57% longer total maximum prison term,
31 Prior convictions were determined from the court records pertaining to the county of prosecution and also from local police files; the latter sometimes indicated convictions outside the county, but not consistently. These records were the best available indication of what the parties in the case knew about the defendant's prior convictions at the time of prosecution.
32 Defendants under age 21 at the time of conviction could be sentenced as "committed youthful offenders," which would make them eligible for parole immediately. N.C. GEN. STAT. §§ 148-49.10 to -49.16 (1978).
INTERIM DECISIONS
and a 26% longer time to earliest release from prison.33
Black defendants suffered a disadvantage in sentencing apparently because blacks charged with Class 2 felonies, but not those charged with Class 1 felonies, were more likely than whites to have court-assigned rather than privately paid lawyers and spent a longer time in pretrial detention.34 When type of counsel and detention time were added to the regression model for Class 2 defendants (see Table 6), the race effect disappeared. As a result, what at first appeared to be a racial effect may actually be due to blacks' lower incomes, which would have limited the type of counsel available to them and their opportunity for pretrial release.35
Other demographic characteristics, including the defendant's sex, marital status, residence within or outside the county of prosecution, and employment status, showed no significant relationship to court disposition.
4. Evidence Against the Defendant
A defendant charged with a Class 1 or Class 2 felony was
signifi-cantly less likely to have all charges dismissed if (1) the prosecution could call an eyewitness or (2) the defendant had confessed or made an incriminating statement. Also, having confessed or having made an in-criminating statement was associated with less severe sentences for Class 2 defendants. One possible explanation for this association is that a con-fession, like a guilty plea, may be regarded as a sign of contrition and therefore may lead the sentencing judge to reduce the defendant's
sentence.
33 These estimated race effects are not shown in Table 6 for reasons explained in the next
paragraph.
34 See in/ia notes 40-48 and accompanying text.
35 No reliable data on defendants' incomes were available in the court and police records.
The data on type of counsel and pretrial detention suggest that blacks' disadvantages were at least partly attributable to lower incomes. Among Class 2 defendants whose charges were not dismissed, the proportions who had assigned counsel were as follows: blacks, 81.6% (N=217); whites, 51.7% (N=207). The mean pretrial detention times for Class 2 defendants whose charges were not dismissed were: blacks, 27.1 days (N=2 11); whites, 12.8 days (N= 198). We did not find such discrepancies between black and white defendants in Class 1. Among Class
1 defendants whose charges were not all dismissed, 63.6% of blacks had assigned counsel,
compared with 67.1% of whites, and blacks spent an average of 32.7 days in pretrial deten-tion, compared with 35.3 days for whites. One reason why the disparity in detention times between blacks and whites occurred in Class 2 but not in Class 1 may be that, in Class 2, blacks were, on the average, poorer than whites, but not in Class 1. We have no direct data on defendants' incomes; however, the figures just mentioned show that, for purposes of assigning counsel, in Class 2 the percentage of black defendants found indigent was greater than the percentage of white defendants who were found indigent, but the two percentages were ap-proximately equal in Class 1. Another reason for the absence of the disparity in pretrial detention between blacks and whites in Class 1 may be that Class I (violent) felony charges were so serious that they overcame both blacks' disadvantages and whites' advantages.
CLARKE AND KURTZ
For violent felony defendants in Class 1, the existence of any sort of physical evidence meant both a lower chance of dismissal and a more severe sentence. If the crime resulted in substantial physical injury to the victim beyond the minimum amount necessary to sustain the charge, the chance that Class 1 charges would be dismissed was reduced, -but the effect on sentencing was nil.36 The recovery by the police of stolen property and the extent of the property loss caused by the crime had no significant effect on either dismissal or severity of sentence. It should be remembered, however, that physical injury and property loss were to some extent correlated with the severity of the initial charge against the defendant, which did have an effect on sentencing, as
ex-plained above.
The regression analysis also indicated that for violent felonies, the defendant who had not used a weapon could expect a much more severe sentence; this defendant would likely be sentenced to lengthy imprison-ment. Such a result seems absurd-the absence of a weapon would seem to be a mitigating, not aggravating factor. This peculiar result, however, is probably due to the particular type of violent offense charged. Class 1 defendants who did not use any weapon were much more likely than weapon-using violent felony defendants to have been charged with and convicted of rape, common law robbery, and arson or other burning crimes, which legally do not require a weapon. Defend-ants convicted of such crimes were more likely to receive prison sentences, and longer ones, than most other violent felony defendants.
5 Characteristics of the Victim
The chance that the Class 2 defendant's charge would be dropped increased if the defendant was related to or acquainted with the victim. We anticipated that the criminal court would tend to treat more leni-ently defendants who had some pre-existing relationship with their vic-tims, because related victims would generally have been more reluctant to testify against the defendant than would unrelated victims, and also because a pre-existing relationship would have been associated with ex-tenuating circumstances favorable to the defendant. Thus, we expected to find that such a relationship would work to the defendant's advan-tage in violent felony (Class 1) cases as well as in theft felony (Class 2)
36 Determination of whether substantial physical harm was alleged was based on police and court records and was somewhat subjective. Coders were instructed to try to determine whether the degree of physical harm was substantially in excess of the minimum amount necessary to prove the elements of the offense charged. If homicide was charged, the killing had to be extremely brutal or cruel for the harm to be coded as "substantial." In other words, our intent was to measure a degree of harm more severe than that implied by the charge itself. It may be that the lack of statistical association between our physical harm variable
and sentencing severity is simply due to inadequate information.
1983] INTERIM DECISIONS
cases. Yet, we could confirm this effect only in the latter category. Nonetheless, victim-defendant relationships in Class 1 cases may have had an effect that was expressed at the initial decision about what crime to charge, which we did not study, rather than at the later decision to dismiss charges.
C. ADMINISTRATIVE FACTORS
1. County in Which Prosecution Occurred
The statistical analysis of the association between court disposition and county of prosecution illustrates that within the single jurisdiction of North Carolina local administrative practices and policies cause sub-stantial variation in defendants' final dispositions. Previous studies of North Carolina support this point.3 7
Charges against both Class 1 and Class 2 defendants were generally more likely to be dismissed in Mecklenburg and Buncombe counties than in the other ten counties studied, when differences in the character-istics of cases were controlled for statistically. The greater dismissal rates in these two counties suggest that there was something distinctive about the handling of felony cases there.38 The distinctive characteristic may well have been that their prosecutors, unlike prosecutors in the other ten counties, used formal systems to screen felony charges soon after arrest.3 9
37 Prosecutors' plea bargaining practices vary widely from district to district in North
Carolina. See Bond, supra note 18, at 823, and Lefstein, supra note 18, at 489-94.
38 Another factor may have been that in Buncombe County, the rate of dismissals of
felonies by district court judges was high-5.6%, compared with 5.9% for all twelve counties. Does prosecutorial workload explain the higher dismissal rates in Buncombe and Mecklen-burg counties? Perhaps, but only partly. Three measures of workload were developed:
(1) the number of arrests for F.B.I. "index" crimes per prosecuting attorney; (2) the estimated
number of felony arrests per prosecuting attorney; and (3) the total arrests per prosecuting attorney. These three measures, computed for 1979, produced very similar rankings for the twelve judicial/prosecutorial districts in which the twelve counties were located. Workload indices were then created by computing the ratio of each district's workload measure to the workload of District 1 which generally had the lowest workload measures. District 28 had the highest workload index; its felony arrests per prosecutor were 2.6 times as great as those of District 1. The workload of Mecklenburg County, District 26, however, was not especially high. It had a felony arrest workload 1.7 times as great as that of District 1, which placed it "in the middle of the pack" with respect to the twelve counties. Also, one might suppose that New Hanover County's low dismissal rate was the product of an exceptionally low prosecutorial workload, but this did not prove to be the case; the felony arrest workload of District 5, including New Hanover County, was 1.9 times as great as District l's.
39 New Hanover County's prosecution was distinctive in another way. Its prosecutors
con-CLARKE AND KURTZ
2. Pretrial Detention
As the Class 1 or Class 2 defendant spent more time in detention awaiting court disposition, it became less likely that the charges would be dismissed and more likely that the sentence would be severe. This result agrees with much research in other jurisdictions.40
Several factors may explain the link between pretrial detention and court disposition. First,4' the defendant who is free before court disposi-tion has certain potential advantages that the jailed defendant lacks: acquiring or maintaining a job, making restitution to the victim, and doing other things that may favorably impress the court. The free de-fendant can also help the defense attorney by obtaining favorable wit-nesses and evidence. All of these things will help the accused argue for dismissal, a beneficial plea bargain, or a lenient sentence. As the length of pretrial detention increases, the defendant is less likely to be able to do these advantageous things. In addition, it will be harder for his at-torney to see the accused in jail-the lawyer will have to take valuable time to go to the jail, where there is often neither proper space nor at-mosphere for a conference. Finally, the defendant may be more willing to accept a disadvantageous plea bargain offer after having spent a long time in jail.
Another factor contributing to the association between pretrial de-tention and the type of disposition the defendant receives is that releas-ing the defendant before disposition may weaken the prosecution by intimidating potential state's witnesses. But such intimidation probably
victions, the regression analysis indicated that sentences were not significantly more severe for those convicted.
40 Early studies showed that defendants released before trial were more likely to receive favorable court disposition than defendants who were not released, but these studies failed to control for other factors that might explain both detention and disposition. See Ares, Rankin & Sturz, The Manhattan Bail Project.- An Interim Report on the Use of Pretrial Parole, 38 N.Y.U. L. RE'. 67 (1963); Foote, A Study of the Administration of Bail in New York City, 106 U. PA. L. REv. 693 (1958); Foote, Compelling Appearance in Court: Administration of Bail in Philadelphia, 102 U. PA. L. REV. 1031 (1954); Rankin, The E ect of Pretrial Detention, 39 N.Y.U. L. REv. 641 (1964); Single, The Unconstitutional Administration of Bail. Bellamy v. The Judges of New York City, 8 gRIM. L. BULL. 459 (1972). William Landes' study was the first to (a) control carefully for other potential causal factors and (b) analyze the time in detention as well as whether the defendant was released. His study of New York City defendants found that pretrial detention time was positively associated with sentence length. See Landes, Legality and Reality. Some Evidence on Criminal Procedure, 23 J. LEGAL STUD. 287, 333-35 (1974). John S. Goldkamp, also using a multivariate technique, found in his analysis of Philadelphia cases that defendants who re-ceived no pretrial release were more likely to go to prison if convicted, and tended to receive a longer sentence, than those who did receive release. Goldkamp did not consider the time spent in detention. See Goldkamp, The Efects of Detention on Judicial Decisions: A Closer Look, 253 Jus. Sys. J. 234, 245 (1980).
41 Our source for this explanation is conversations with defense attorneys in North
Caro-lina, as well as AMERICAN BAR ASSOCIATION STANDARDS RELATING TO THE
ADMINISTRA-TION OF CRIMINAL JUSTICE: PRETRIAL RELEASE § 10-1.1 and commentary (2d ed. 1980).