III. RESEARCH METHOD
3.1. Research Design
This is a quantitative research, which has one group pretest-posttest design. Researcher selected one class as the experimental group using simple random probability sampling.
The design can be presented as follows: T1 X T2
T1 is pretest X is treatment T2 is posttest
(Hatch and Farhady, 1982:20)
3.2. Population and Sample
The population of this research was the students at class XI of SMK Budi Karya Natar Lampung Selatan. There were six classes of class XI. Each class consisted 30-35 students. The researcher was choose one class as experimental class. In determining samples, the researcher uses simple random probability sampling, by using lottery.
3.3. Steps in Collecting the Data
In collecting the data, the researcher uses the following steps: 3.3.1. Conducting Try Out
Try out is to make sure that the test is appropriate to be used as a research instrument. This test was multiple choices tests which consist of 40 items with allocation time in 60 minutes. The 40 items of try out test was reduced become 35 items to be used in pretest and posttest. The aim of try out test is to know the quality of the test which would be used as the instrument of the research and to determine which item should be revised for the pretest and posttest. This research used the result of try out test to measure the level of difficulty and discrimination power, to find out the validity and the reliability of the test.
3.3.2. Conducting pretest
3.3.3. Giving treatment
There are two treatments conducted in this research. Each treatment was held for 90 minutes consisting of procedure of teaching vocabulary through Parlour Games.
3.3.4. Conducting posttest
Posttest was conducted after treatments. They were 30 items of multiple choices in 60 minutes to find out whether there is any influence of using parlour games towards students’ vocabulary achievement after giving the treatments.
3.3.5. Analyzing the Data
In analyzing the data, the researcher was arranged the data systematically into a score table based on the pretest and posttest to see whether there is any influence of the students’ vocabulary achievement significantly.
3.4. Instrument Used for Collecting the Data
This research instrument is vocabulary test in the form of pretest and posttest. Pretest was given to check the students’ basic vocabulary achievement. It is done before the treatments. Posttest was used to get the data of the students’ vocabulary achievement after the treatment was given. Then, the researcher found out
3.4.1. Validity
A test is valid if the test measures the object to be measured and suitable with the criteria. To measure whether the test has a good validity, the researcher analyzes from construct and content validity.
a. Construct validity is concerned with whether the test is actually in line with the theory of what it means to know certain language knowledge skill. Knowing vocabulary means knowing; meaning, form, and pronunciation (Nation 1991). This is requires the students to show their knowledge on the meaning, form, and pronunciation of the words.
Table 3.1. Table of Specification (Try out test)
Word Class Items Total Percentage
(%) Verb 1, 2, 3, 4, 5, 6, 7, 8, 9,10, 11,
12, 13, 14, 15, 16, 17, 18, 19, and 20.
20 50
Noun 21, 22, 23, 24, 25, 26, 27, 28, 29, 30, 31, and 32.
12 30
Adverb 33,34, and 35. 3 7.5
Adjective 36,37,38,39, and 40. 5 12.5
Total 40 40 100
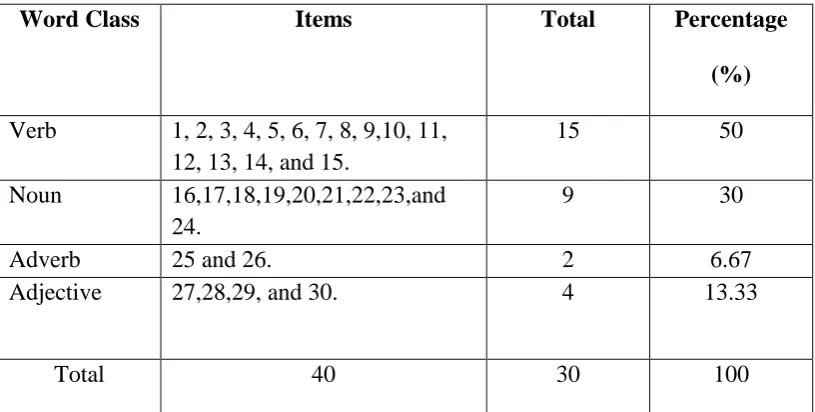
Table 3.2. Table of Specification (Pre test)
Word Class Items Total Percentage
(%) Verb 1, 2, 3, 4, 5, 6, 7, 8, 9,10, 11,
12, 13, 14, and 15.
15 50
Noun 16,17,18,19,20,21,22,23,and 24.
9 30
Adverb 25 and 26. 2 6.67
Adjective 27,28,29, and 30. 4 13.33
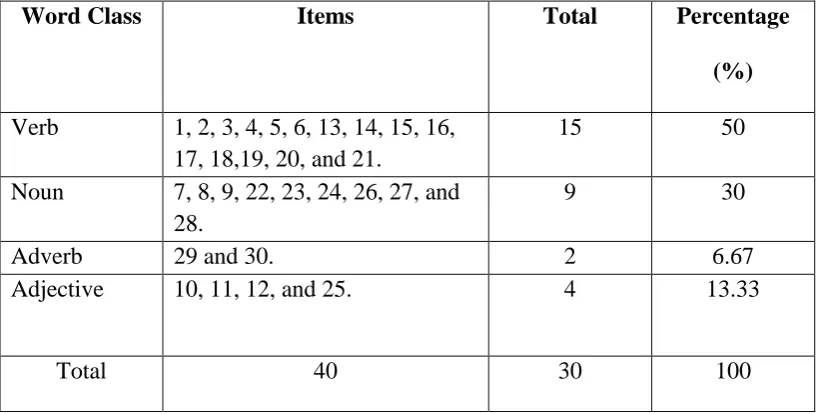
[image:5.595.109.517.498.704.2]Table 3.3. Table of Specification (Post_test)
Word Class Items Total Percentage
(%) Verb 1, 2, 3, 4, 5, 6, 13, 14, 15, 16,
17, 18,19, 20, and 21.
15 50
Noun 7, 8, 9, 22, 23, 24, 26, 27, and 28.
9 30
Adverb 29 and 30. 2 6.67
Adjective 10, 11, 12, and 25. 4 13.33
Total 40 30 100
3.4.2. Reliability
Hatch and Farhady (1982:243) state that reliability of a test can be define as the extent to which a test produces consistent result when administered under similar conditions. In order to estimate the reliability of the test, this research used spilt-half technique and to measure the cofficient of the reliability between odd group and even group, this research uses “the Pearson Product Moment Formula” as follows:
) )(
(
2
2
Y X
XY rl
Where:
y = even number
2X = total score of odd number items
Y = total score of even number items
XY = total number of odd and even numberTo know the coefficient correlation of whole items “Spearmen Brown’s” prophecy formula” (Hatch and Farhady, 1982:286) is used. The formula is as follows:
rl rl rk
1 2
rk = the reliability of the test rl = the reliability of half test
The criteria of reliability are: 0.80 – 1.00 : very high 0.60 – 0.79 : high 0.40 – 0.59 : average 0.20 – 0.39 : low 0.00 – 0.19 : very low
3.4.3. Level of Difficulty
N L U LD
Where:
LD : level of difficulty
U : the proportion of upper group students L : the proportion of lower group students
N : the total number of students following the test
The criteria are:
< 0.30 : difficult 0.30 – 0.70 : average > 0.70 : easy (Shohamy, 1985:79)
3.4.4. Discrimination Power
Discrimination power is used to indicate the discrimination of the failed and the success of the students. To see the discrimination power, the researcher will use the following formula:
N l U DP
2 1
Where:
DP : discrimination power
L : the proportion of lower group students N : total number of students
The criteria are:
1. If the value is positive, it has positive discrimination because a larger number or more knowledgeable students than poor students get the item correct. If the value is zero, it means no discrimination.
2. If the value is negative, it has negative discrimination because more low-level students than high-level students get the item correct
3. In general, the higher discrimination index, the better, in classroom situation most items should be higher than 0.20 index.
(Shohamy, 1985: 82)
3.4.5. Scoring System
In scoring the students’ result of the test, this research employed Arikunto’s formula. The ideal highest score is 100. The score of pretest and posttest was calculated by using the formula as follows:
S= 𝑅
𝑁 x 100% Where,
S : The score of test
R : total of the right answer N : total items
3.6. Data Analysis
After conducting the pretest and posttest, the researcher analyzed the data. It is used to know whether there is an influence of using parlour games towards students’ vocabulary achievement.
The following steps are used to examine the students’ score: 1. Scoring the pretest and posttest
2. Tabulating the score of teaching English vocabulary test result using repeated measures t-test. The formula as follows:
3. Drawing conclusion from the tabulated result of the pretest and posttest administering, that is statistically analyzed using SPSS (Statistical Package For Social Sciences) in order to test whether the influence of stdents’ gain is significant or not.
3.7. Hypothesis Testing
After collecting the data, the reearcher recorded and analyzed them in order to find out wheter there is an influence of the students’ vocabulary achievement or not after the treatment. The researcher used matched T-test to know the level of significance of the treatment effect.
The formula is:
𝑡 =𝑋 1− 𝑋 2
𝑆𝐷
with 𝑆𝐷 =
1 ) )( / 1
( 2
2
nD n
𝑋 1 : Mean from pre-test
𝑋 2 : Mean from post- test
𝑆𝐷 : Standard error of differences between means
n : Subjects on sample (Hatch and Farhady, 1982:114)
The criteria are:
1. If the t-ratio is higher than t- table: H1 is accepted