RESEARCH ARTICLE
Embryonic Tbx3
+
cardiomyocytes form the mature cardiac
conduction system by progressive fate restriction
Rajiv A. Mohan1,2, Mathilda T. M. Mommersteeg3, Jorge N. Domıngueź 4, Caroline Choquet5, Vincent Wakker1, Corrie de Gier-de Vries1, Gerard J. J. Boink1,2, Bastiaan J. Boukens1, Lucile Miquerol5, Arie O. Verkerk1and Vincent M. Christoffels1,*
ABSTRACT
A small network of spontaneously active Tbx3+cardiomyocytes forms the cardiac conduction system (CCS) in adults. Understanding the origin and mechanism of development of the CCS network are important steps towards disease modeling and the development of biological pacemakers to treat arrhythmias. We found that Tbx3 expression in the embryonic mouse heart is associated with automaticity. Genetic inducible fate mapping revealed that Tbx3+ cells in the early heart tube are fated to form the definitive CCS components, except the Purkinje fiber network. At mid-fetal stages, contribution of Tbx3+cells was restricted to the definitive CCS. We identified a Tbx3+population in the outflow tract of the early heart tube that formed the atrioventricular bundle. Whereas Tbx3+ cardiomyocytes also contributed to the adjacent Gja5+ atrial and ventricular chamber myocardium, embryonic Gja5+ chamber cardiomyocytes did not contribute to the Tbx3+ sinus node or to atrioventricular ring bundles. In conclusion, the CCS is established by progressive fate restriction of a Tbx3+cell population in the early developing heart, which implicates Tbx3 as a useful tool for developing strategies to study and treat CCS diseases.
KEY WORDS: Genetic inducible fate mapping, Cardiac conduction system, Sinus node, Atrioventricular node, Atrioventricular bundle, T-box, Tbx3
INTRODUCTION
Dysfunction of the cardiac conduction system (CCS) due to gene mutations, congenital defects, damage after surgery or degenerative disease leads to severe arrhythmias (Baruteau et al., 2015; Park and Fishman, 2011; Wolf and Berul, 2006). Defining the developmental origin and mode of the CCS components is a crucial step towards understanding the etiology of conduction diseases and to pave the way for the development of regenerative strategies (Boink et al., 2015; Cingolani et al., 2018; Rosen et al., 2011; van Eif et al., 2018).
The CCS controls the initiation and propagation of the electrical impulse through the heart to coordinate chamber contractions.
The dominant pacemaker of the heart, the sinus node (SAN), generates the impulse, which rapidly traverses the atria and reaches the slow-conducting atrioventricular (AV) node where impulse propagation is delayed. After atrial contraction has occurred, the impulse propagates from the AV node through the rapidly conducting AV bundle, bundle branches (BBs) and through the Purkinje fiber network (PFN) that distributes the impulse to the left and right ventricular chambers. Because the CCS is crucial for vertebrate heart function and is clinically relevant, it is important to address remaining questions regarding its origin and mechanism of development.
Previously, a model was proposed in which non-CCS chamber cardiomyocytes are recruited to a CCS framework (Cheng et al., 1999), which has been commonly used in the field ever since. Additional evidence, however, supports a model of early specification to a CCS phenotype and subsequent growth of its components (Christoffels and Moorman, 2009; Mohan et al., 2017). More recent retrospective clonal analyses and genetic fate mapping using the pan myocardial marker smooth muscle actin have suggested that the AV bundle segregates early during cardiogenesis, whereas the BB and PFN segregate later (Choquet et al., 2016; Miquerol et al., 2010). Genetic inducible fate mapping and lineage tracing uncovered a lineage relationship between the embryonic AV canal and the formed AV node, AV ring bundles and retro-aortic root branch (RARB), between the embryonic sinus venosus and the SAN, and between the ventricular trabecules and the PFN (Aanhaanen et al., 2009; Davis et al., 2001; Liang et al., 2013; Miquerol et al., 2010; Mommersteeg et al., 2010; Sun et al., 2007; Wiese et al., 2009). Although each of these studies has been informative, the markers used to label or identify the CCS components are either broadly expressed in the embryonic heart or its precursors (e.g. EAP300 and Sma) (Choquet et al., 2016; McCabe et al., 1995) or show dynamic spatiotemporal expression patterns temporally overlapping chamber myocardium or excluding particular CCS cells (e.g.cGata6-Cre,Isl1,Tbx2,Hcn4andCx40) (Aanhaanen et al., 2009; Davis et al., 2001; Liang et al., 2013; Miquerol et al., 2010; Mohan et al., 2017; Sun et al., 2013, 2007). CCS cells in the different components have unique functional properties, yet they also share properties, including spontaneous activity (or automaticity) (Dobrzynski et al., 2013; Mangoni and Nargeot, 2008; van Eif et al., 2018). Tbx3 is specifically expressed in all components of the adult CCS, except for the PFN (Hoogaars et al., 2004). Around the same time that chamber formation is initiated, Tbx3 is expressed in the developing AV canal that maintains automaticity, and in the SAN primordium as soon as it emerges (Hoogaars et al., 2004; Mommersteeg et al., 2007). Tbx3 suppresses the chamber myocardial gene program and induces the pacemaker gene program and phenotype in a dose-dependent
Received 4 May 2018; Accepted 9 July 2018
1Department of Medical Biology, Amsterdam University Medical Centers,
University of Amsterdam, Amsterdam 1105 AZ, The Netherlands.2Department of
Cardiology, Amsterdam University Medical Centers, University of Amsterdam,
Amsterdam 1105 AZ, The Netherlands.3Burdon Sanderson Cardiac Science
Centre, Department of Physiology, Anatomy and Genetics, University of Oxford,
Oxford OX1 3PT, UK.4Department of Experimental Biology, University of Jaén,
Jaén 23071, Spain.5Aix Marseille University, CNRS UMR 7288, IBDM,
Marseille 13288, France.
*Author for correspondence (v.m.christoffels@amc.uva.nl)
R.A.M., 0000-0002-3622-1759; V.M.C., 0000-0003-4131-2636
DEVEL
O
manner (Bakker et al., 2012, 2008; Frank et al., 2011; Hoogaars et al., 2007; Singh et al., 2012). Based on these key functions of Tbx3 in CCS formation and its specific expression in the CCS components, we hypothesize that Tbx3+ cardiomyocytes in the
embryonic heart represent the CCS network of cells. Here, we established that Tbx3-expressing cardiomyocytes in the embryo represent pacemaker-like cells of the CCS. To gain insight into the origin and mode of development of the CCS, we investigated the spatiotemporal pattern of specification of the pacemaker-like cells that make up the SAN, AV node, AV ring bundles, RARB, AV bundle and BBs using an inducible Cre recombinase under the control ofTbx3.
RESULTS
Tbx3 is expressed in a subpopulation of cardiomyocytes throughout development
We first determined the developmental expression pattern of Tbx3 protein in the developing heart. At embryonic day (E) 8.5, Tbx3 protein was clearly detectable in the inflow tract of the heart tube. We also observed weak expression in the distal outflow tract (OFT; Fig. 1A,B), not previously seen byin situhybridization (Hoogaars et al., 2004). At E9.5, the AV canal was morphologically distinguishable and its myocardial wall expressed Tbx3 (Fig. 1C). The dorsal part of the Tbx3+AV canal extended into the common
atrium towards the venous entrance of the heart. The interventricular ring, in between the left and right ventricle, expresses Tbx3 soon after right ventricle formation has been initiated (from mouse E9 onwards) (Hoogaars et al., 2004; Sankova et al., 2012). The crest of the interventricular septum is part of the interventricular ring. Within the interventricular septum, expression of Tbx3 was highest in the crest and gradually decreased towards the apex (epicardial side; Fig. 1C′). Tbx3 expression in the inner curvature was contiguous with the AV canal, interventricular ring and left dorsal side of the OFT. At E10.5, the expression pattern was comparable with that at E9.5 (Fig. 1D). However, previously unnoticed using
in situhybridization, the entire interventricular septum expressed Tbx3 in a gradient from crest to apex (Fig. 1D′). In addition, a Tbx3+
SAN primordium was visible at the border of the sinus venosus and the right atrium (Fig. 1E). Tbx3 expression was confined to a
subpopulation, the presumptive SAN primordium, within the sinus venosus, which in its entirety expresses Hcn4 at embryonic stages (Liang et al., 2013; Mommersteeg et al., 2007). From E12.5 onwards, Tbx3 expression was present in the AV canal and interventricular ring. Within the growing interventricular septum, Tbx3 expression became restricted to the crest: the future AV bundle (Fig. 1F). In the more distal part of the interventricular septum, closest to the apex, Tbx3 expression was absent. The flanks of the crest show Tbx3 expression, coinciding with the future BBs (Wessels et al., 1992). The SAN clearly expressed Tbx3 and this region was contiguous with the AV canal through the Tbx3+right
venous valve and the Tbx3+domain within the interatrial septum
(Fig. 1G). This result is largely consistent with the publishedTbx3 mRNA expression pattern, except for Tbx3 protein expression in the OFT of the early tubular heart and the graded expression in the interventricular septum that were not observed previously (Hoogaars et al., 2004). At late fetal stages (E17.5), the pattern of Tbx3 was highly similar to that of Hcn4, a specific marker of the late fetal and postnatal CCS (Fig. S1) (Liang et al., 2013; Wu et al., 2014). Taken together, Tbx3 expression is associated with the CCS component primordia throughout development.
Embryonic Tbx3+cardiomyocytes are spontaneously active
To determine the basic electrophysiological features of the embryonic Tbx3+cardiomyocytes, we have generated aTbx3Venus/+mouse line,
in which Venus, which encodes yellow fluorescent protein, was incorporated into the endogenousTbx3locus. Immunostaining for Tbx3 and Venus showed that Venus faithfully recapitulates the expression pattern of Tbx3 (Fig. 2A,B).Tbx3Venus/+heterozygous
animals were healthy and fertile.
We measured isolated cells from E10.5 hearts using patch-clamp methodology (Fig. 2C,D). Venus+ cardiomyocytes were
[image:2.612.125.488.507.674.2]spontaneously active, whereas Venus-negative cardiomyocytes were quiescent. However, Venus-negative cardiomyocytes generated action potentials upon stimulation (Fig. 2E). Average action potential parameters are summarized in Table 1. All action potential parameters differed significantly between the two cell types. Venus-negative cardiomyocytes had a stable resting membrane potential of −62.6±2.6 mV, whereas Venus+ cardiomyocytes showed
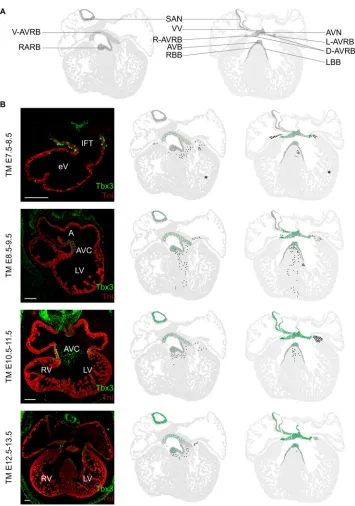
Fig. 1. Developmental expression pattern of Tbx3 in the mouse heart.All sections were immunolabeled for Tbx3 (green) and TnI (red). Sections of an E8.5 heart showing the Tbx3+IFT (A) and Tbx3+OFT (B). (C) Section of an E9.5 heart showing the Tbx3+AV canal and IVR. The Tbx3+IVR is also shown in C′.
Sections of an E10.5 heart showing the Tbx3+AV canal (D) and Tbx3+SAN in the right sinus horn (E). The Tbx3+IVR is also shown in D′; this image is also used in
Fig. 5B. (F,G) Sections of an E12.5 heart showing Tbx3+SAN, left and right AV canal walls, and AV bundle (F); and continuity of Tbx3 expression from SAN
through the right venous valve to the AV canal (G). A, common atrium; AVC, atrioventricular canal; eV, embryonic ventricle; IFT, inflow tract; IVS, interventricular septum; LA, left atrium; LV, left ventricle; OFT, outflow tract; RA, right atrium; RV, right ventricle; RVV, right venous valve; SAN, sinus node. Scale bar: 100μm.
DEVEL
O
spontaneous diastolic depolarization and a maximum diastolic potential (MDP) of −50.2±1.3 mV. The maximum upstroke velocity (Vmax) was low in Venus+cardiomyocytes (2.8±0.6 V/s)
as opposed to Venus-negative cardiomyocytes (39.0±5.5 V/s). The action potential amplitude (APA) was higher in Venus-negative cardiomyocytes and repolarization completed earlier and faster, resulting in shorter action potential duration (APD) at 20, 50 and 90% of repolarization (APD20, APD50and APD90, respectively). Venus+
cardiomyocytes, but not Venus-negative cardiomyocytes, showed a hyperpolarization-activated current or funny current (If) upon
voltage steps from −40 to−120 mV, whereas the Venus-negative cardiomyocytes displayed a fast and large inward current upon depolarization with sodium current (INa)-like kinetics (Fig. 2F). These
results indicate that Venus+ cardiomyocytes, and thus Tbx3+
cardiomyocytes, display characteristics specific for pacemaker cells as early as E10.5, in contrast to Venus-negative cardiomyocytes that display chamber cardiomyocyte characteristics.
Embryonic cardiac Tbx3+cells are the progenitors of the definitive CCS
Using a novel Tbx3CreERT2 allele, we assessed the fate of the progeny of the Tbx3+cells in the developing heart. The expression
ofCreERT2recapitulated the expression ofTbx3(data not shown). Homozygous Tbx3CreERT2/CreERT2 embryos were not viable, confirming disruption ofTbx3. HeterozygousTbx3CreERT2/+mice are healthy and fertile.
To label Tbx3+ cells in Tbx3CreERT2/+;RosamTmG/+ double
transgenic embryos, tamoxifen was administered to pregnant females on two consecutive days, and the descendants of the labeled Tbx3+cells (hereafter referred to as Tbx3+progeny) were
analyzed in embryos, fetuses and adults (Fig. 3A). We did not observe any labeling in the absence of tamoxifen (data not shown). The labeling efficiency and distribution pattern within the Tbx3+
domain was visualized by labeling Tbx3+cells at E8.5-9.5 followed
by analysis at E10.5 (Fig. 3B and Fig. S2). In two independent tamoxifen-mediated labeling experiments, we observed that labeling within the Tbx3+domain was homogenously distributed,
suggesting equal likelihood for labeling to occur independently of the Tbx3+subdomain.
We repeated the experiment using the same labeling period, but now followed by an analysis of Tbx3+progeny in the adult mouse.
Both the CCS and Tbx3-negative chamber myocardium contained Tbx3+progeny, indicating that the embryonic Tbx3+cell population
contains progenitors of the adult CCS (Fig. S3). However, the yield of viable pups was low due to premature labor and embryonic lethality, which did not depend on the genotype and was most probably caused by tamoxifen toxicity. To circumvent this issue, we decided to perform the fate analysis at fetal stages, when the CCS components are well formed. When Tbx3+ cells were labeled at
E8.5-9.5 and analyzed at E14.5, Tbx3+progeny was present in the
SAN, venous valves, AV node, AV ring bundles and AV bundle (Fig. 3C). This was confirmed by immunohistochemistry using Tbx3 to mark the E14.5 CCS (Fig. 3D,E). In addition, Tbx3+
progeny were found in the Tbx3-negative chamber myocardium, e.g. the interventricular septum at E14.5 (Fig. 3F). Altogether, these data suggest that embryonic Tbx3+cardiomyocytes contribute to the
Tbx3+CCS components and chamber myocardium.
Tbx3+progenitor population is progressively restricted to a CCS fate
We 3D reconstructed an E12.5 heart labeled at E8.5-9.5 and visualized the relative contributions of Tbx3+cardiomyocytes to the
CCS. Labeled descendants were observed mainly in the Tbx3+CCS
and to some extent in the adjacent Tbx3-negative chamber myocardium (Fig. 4A). The volumes of Tbx3+progeny in Tbx3+
and Tbx3-negative (chamber) myocardium were determined at subsequent stages of labeling using partial reconstructions (Fig. 4B). Labeling before formation of the heart tube (E6.5-7.5) resulted in scarcely labeled hearts in which Tbx3+ progeny was
[image:3.612.49.404.58.242.2]found in the E11.5 AV canal and left ventricle (Fig. S4), suggesting Fig. 2. Tbx3+cells have pacemaker properties in contrast to Tbx3−cells.(A,B) Yellow fluorescent protein Venus expression patterns (B) recapitulates those of Tbx3 (A) in an E10.5 Tbx3Venus/+mouse embryo visualized by
immunolabeling. (C,D) E10.5 mouse heart, unstained (C) and endogenous Venus fluorescence pattern (D). Fluorescence is specific to the AV junction and SAN primordium. (E) Typical examples of the action potentials of a freshly isolated Venus+cell and a Venus−cell. The Venus−cell was stimulated at 2 Hz. (F) Typical examples of hyperpolarization-activated current (If) in a Venus+cell upon
voltage steps from−40 to−120 mV, and a fast and large inward sodium current in a Venus−cell upon depolarization from−120 to−40 mV. Scale bar: 100μm.
Table 1. Action potential characteristics of single Venus+and Venus−
cells
Venus+cells (n=8) Venus−cells (n=10)
Spontaneous active 8 out of 8 0 out of 10 Mean s.e.m. Mean s.e.m.
Cycle length (ms) 622.2 74.8 500‡ –
MDP (mV) −50.2 1.3 −62.6* 2.6
APA (mV) 61.9 5.3 72.8* 4.7
Vmax (V/s) 2.8 0.6 39.0* 5.5
APD20(ms) 54.9 11.2 10.7* 1.9
APD50(ms) 78.7 13.2 23.3* 3.6
APD90(ms) 137.5 33.3 89.8* 7.8
Data are mean±s.e.m.;n, number of cells; MDP, maximal diastolic potential; APA, action potential amplitude; Vmax, maximal upstroke velocity; APD20,
APD50and APD90, action potential duration at 20, 50 and 90% repolarization.
*P<0.05; unpairedt-test.–, not applicable.
‡Stimulation at 2 Hz.
DEVEL
O
[image:3.612.48.299.577.690.2]low (or brief ) expression of Tbx3. Analysis at a later stage was not possible due to embryonic lethality. When labeled at E7.5-9.5 and analyzed at E14.5, ∼40% of the progeny was found in the CCS and 60% in the chambers (Fig. 4C). The variation in relative contributions to the CCS was large between hearts of the same labeling period. Labeling between E10.5 and 15.5 resulted in a relative contribution to the CCS of 80% to over 95%, respectively, with far less variation between hearts at the same labeling stage. These data suggest that the fate of the Tbx3+ progenitors is
progressively restricted towards the CCS lineage, which is established by E15.5.
To visualize the distribution pattern of the Tbx3+progeny in the
heart, we made use of two molds in which the location of a GFP+
cell or cell cluster was drawn in (Fig. 5A and exemplified in Fig. S5). Labeling at E7.5-8.5 led to Tbx3+progeny in the AV node,
[image:4.612.49.379.55.342.2]AV ring bundles and RARB, and to a lesser extent in the AV bundle and BBs. In addition, Tbx3-negative cardiomyocytes were labeled within the base of the right atrium, upper part of the interventricular
Fig. 3. Embryonic cardiac Tbx3+cells are progenitors of the definitive CCS.(A) Scheme of labeling and analysis time points. Green dots represent tamoxifen administration (labeling) and red dots indicate harvesting of embryos or hearts (analysis). Axis shows embryonic days and neonatal day 0 (ND0) and 2 months of age (2-mo). (B) Tbx3+
progeny distribution at E10.5 of E8.5-9.5 Tbx3+cells.
TnI in red, Tbx3‘high’in green, Tbx3‘low’in blue and Tbx3+progeny in yellow. (C) Whole-mount E14.5
heart showing GFP fluorescence in the entire Tbx3+
CCS (SAN, AV junction, AV bundle and proximal BBs) after tamoxifen administration at E8.5-9.5. (D-F) All sections were immunolabeled for TnI (red), Tbx3 (green) and Tbx3+progeny by GFP (yellow), showing
Tbx3+progeny in SAN (D), AV node (E) and
Tbx3-negative interventricular septum (F) following labeling of Tbx3+cells at E8.5-9.5. Arrowheads indicate Tbx3+
progeny. AVRBs, atrioventricular ring bundles; IAS, interatrial septum; IVS, interventricular septum; RA, right atrium; SAN, sinus node. Scale bar: 100μm.
Fig. 4. 3D reconstructions to visualize and determine relative contributions of Tbx3+ -derived cells to CCS components and chamber myocardium during development.
(A) Ventral and top-side view of a 3D reconstruction of an E12.5 heart showing TnI (gray), Tbx3 (red) and Tbx3+progeny (green).
Labeling was performed at E8.5-9.5 and analysis at E12.5. (B) Example of a lateral and ventral view of a partial 3D reconstruction showing TnI (gray), Tbx3+progeny in CCS
(green) and in chamber myocardium (black). Labeling was performed at E10.5-11.5 and analysis at E17.5. (C) Relative contribution in volume of Tbx3+progeny in CCS over total
volume of Tbx3+progeny in the heart. At least
three hearts per condition were included. AVB, atrioventricular bundle; AVC, atrioventricular canal; Ca, caudal; Cr, cranial; D, dorsal; LA, left atrium; LV, left ventricle; RA, right atrium; RV, right ventricle; SAN, sinus node; TM, tamoxifen administration; V, ventral. Scale bar: 100μm.
DEVEL
O
[image:4.612.51.395.485.733.2]septum, and trabecular and compact myocardium of the left ventricle (Fig. 5B). When labeled at E8.5-9.5, Tbx3+ progeny
were observed in the aforementioned populations and also in the SAN. The amount of Tbx3+ progeny in the AV bundle was
increased compared with the previous stage. In addition, the Tbx3+
part of the right venous valve and Tbx3+interatrial septum were
labeled. Furthermore, the base of the Tbx3-negative right atrium, left atrium and left ventricle contained Tbx3+ progeny. Tbx3+
progeny were found throughout the interventricular septum from crest to compact myocardium (Fig. 5B). Labeling at later stages (E10.5-11.5, E12.5-13.5 and E14.5-15.5) resulted in progeny in all aforementioned Tbx3+structures, as well as the Tbx3+part of
the left venous valve, thus including all structures of the formed Tbx3+ CCS. Within the chamber myocardium, the right
and left atria no longer contained Tbx3+ progeny. Labeling of
the interventricular septum and base of the left ventricle remained. These contributions decreased with increasing developmental stages of labeling (Fig. 5B). Complementary, each consecutive labeling period resulted in an increase in the number of GFP+cell or cell clusters in each of the Tbx3+CCS components
(identified based on morphology; Fig. S6). Because CreERT2
expression level positively correlates with the labeling probability of a cell, this increase suggests Tbx3 expression increases during development in the progenitors of the respective CCS components.
We next investigated whetherTbx3-negative embryonic chamber cardiomyocytes contribute to the Tbx3+ CCS lineage.
[image:5.612.49.404.52.558.2]Tbx3-negative atrial and left ventricular cardiomyocytes activate Gja5 (Cx40) upon their differentiation from the embryonic heart tube (Fig. S7) (Delorme et al., 1995; Hoogaars et al., 2004; Miquerol
Fig. 5. Distribution pattern of Tbx3+ progeny in the heart labeled at subsequent stages of development.
(A) View of generalized section of ventral (left) and mid-dorsal planes (right) that were used as molds to project labeled cells/cell clusters obtained from multiple sections. AVB, atrioventricular bundle; AVC, atrioventricular canal; AVN, atrioventricular node; AVRB, atrioventricular ring bundle (D, dorsal; L, left; R, right; V, ventral); LBB, left bundle branch; RBB, right bundle branch; VV, venous valves; SAN, sinoatrial node. (B) Images in the first column visualize the Tbx3 expression pattern by immunofluorescence at the developmental stages of labeling. TnI, red; Tbx3, green. The image of the TM10.5-11.5 heart is
reproduced from Fig. 1D′. Second column (ventral mold) and third column (mid-dorsal mold) show the Tbx3+progeny distribution
patterns in the formed heart in the CCS components (green) and chamber
myocardium (black). At least three hearts per condition were included. The asterisk represents an exceptionally large cluster of Tbx3+progeny in the left ventricle of one
heart. Scale bar: 100 µm. TM, tamoxifen administration.
DEVEL
O
et al., 2010; Sankova et al., 2012). We examined whether chamber cardiomyocytes constitute an additional progenitor population for the SAN and AV conduction system. Gja5CreERT2-IRESmRFP mice were crossed with RosaeYFP/+reporter mice and tamoxifen
administrated at E10.5. Hearts of double transgenic pups (n=4) were harvested and analyzed at E15.5. To assess whether embryonic Gja5+ progenitors contribute to the CCS, we performed
immunohistochemistry for Tbx3 to mark the SAN and AV conduction system, TnI (troponin I) to label cardiomyocytes, and YFP to visualize the labeled descendants of the Gja5+progenitors.
Analysis of YFP expression revealed incomplete recombination of Gja5+-derived cardiomyocytes in the atria and ventricle; however,
no contributions were observed in the SAN, AV node or AV canal (AV ring bundles) in all four hearts (Fig. 6A,B), suggesting embryonic chamber cardiomyocytes do not contribute to the Tbx3+
CCS lineage.
The atrioventricular bundle originates from the outflow tract of the primary heart tube
Tamoxifen administration at E7.5-8.5 (early heart tube stages) resulted in labeling of the AV bundle and BBs, indicating that their progenitors express Tbx3 during this labeling period (Fig. 5B). The initial embryonic heart tube gives rise to the left ventricle and AV canal, whereas the right ventricle and OFT form from progenitor cells that are added to the arterial pole of the heart (Aanhaanen et al., 2009; De la Cruz et al., 1977; Kelly et al., 2014; Liang et al., 2013). The AV bundle is positioned in between the expanding left ventricle and right ventricle. Therefore, a likely origin of the AV bundle is the distal OFT of the heart tube at stages before the future right ventricle and definitive OFT are being added. Indeed, a Tbx3+ population
was identified in the E8.0-8.5 distal OFT (Figs 1A and 7A). Ventral OFTs of cultured E8.5 mouse embryos were labeled using DiI (Fig. 7B), and their fates assessed after 48 h of culture (corresponding to stage E10.5). After culturing, labeling was observed in the outer curvature of the ventricular loop, in the interventricular foramen and within the interventricular septum in between the left ventricle and right ventricle (Fig. 7C,D and Fig. S8). These data indicate that the AV bundle derives from the Tbx3+
cells in the distal OFT of the E8.0-8.5 heart tube.
Tbx3+progeny in chamber myocardium acquires chamber myocardial properties
The GFP+Tbx3−cells in the chamber myocardium are derived from progenitor cells that had pacemaker properties during the stage they expressed Tbx3. To test whether these cells retained pacemaker properties or acquired a chamber myocardial phenotype,Tbx3CreERT2/+;
RosamTmG/+double transgenic embryos were treated with tamoxifen
at E7.5-8.5 or 8.5-9.5. At E14.5, GFP+ ventricular chamber
cardiomyocytes were characterized by immunohistochemistry and by patch-clamp methods. GFP+ventricular cardiomyocytes within
the interventricular septum express TnI and expressed Gja1 (Cx43), a marker of chamber myocardium, as did the surrounding Tbx3-negative GFP-Tbx3-negative cardiomyocytes, but did not express Tbx3 (Fig. 8A-C).
We next performed patch-clamp analysis of GFP+and GFP−cells isolated from the ventricles and compared them with GFP+cells
isolated from the SAN and AV junction, separated using regional dissection. Fig. 8D shows typical membrane potentials of a GFP+
SAN/AV junction cardiomyocyte, and GFP-negative and GFP+
chamber cardiomyocytes. All GFP+SAN/AV junction cells (n=6)
were spontaneously active, whereas all GFP-negative ventricular chamber cardiomyocytes (n=11) were quiescent. We found both quiescent and spontaneously active GFP+ ventricular chamber
cardiomyocytes (n=8) (Table 2; Fig. 8E). Both the quiescent GFP+
[image:6.612.60.287.56.292.2]and the GFP− chamber cardiomyocytes could generate action potentials upon stimulation that resembled the morphology of an Fig. 6. Embryonic Gja5+cardiomyocytes do not contribute to the Tbx3+
sinus node and atrioventricular conduction system.(A)Gja5expression in the atrial and left ventricular chamber myocardium at E10.5 shown byin situ hybridization. Green dots represent tamoxifen administration (labeling) and red dots indicate harvesting of hearts (analysis). (B,C) After labeling Gja5+cells at
E10.5, labeled Gja5+progeny were not present in the E15.5 SAN (B,C) and AV
bundle (C). Sections were stained for nuclei (blue) and immunolabeled for TnI (red), Tbx3 (white) and Gja5+progeny by GFP (green). AVB, atrioventricular
bundle; LA, left atrium; LV, left ventricle; RA, right atrium; RV, right ventricle; SAN, sinus node. Scale bar: 100μm.
Fig. 7. DiI labeling of E8.0 distal OFT reveals its fate to the interventricular ring-AV bundle.
(A) Immunolabeling of Tbx3 in cardiomyocytes of distal OFT at E8.0. (B) E8.0 heart with DiI labeling ( purple) of the distal OFT (arrow). (C) Visualization of DiI labeling after 48 h of culture showing labeling in the IVR. eV, embryonic ventricle; LV, left ventricle; IVR, interventricular ring; OFT, outflow tract. Scale bar: 10μm.
DEVEL
O
[image:6.612.48.390.620.739.2]embryonic ventricular cardiomyocyte (Fig. 8F) (Wetzel and Klitzner, 1996). However, GFP+ chamber cardiomyocytes had a
more depolarized MDP and lower Vmax than GFP-negative chamber cardiomyocytes (Table 2). In a subset of cells, we measured net membrane currents upon voltage clamp steps
from −40 to −120 mV. GFP+ SAN/AV junction cells, but not
GFP− chamber cardiomyocytes, showed a hyperpolarization-activated current (If). However, GFP-negative chamber
cardiomyocytes had larger currents at the beginning of the voltage clamp step to −120 mV, which points to the inward rectifier potassium current (IK1). We plotted the IK1and Ifdensities against
the MDP in GFP+SAN/AV junction, and GFP−and GFP+chamber
cardiomyocytes (Fig. 8G). A more-negative MDP was accompanied by a larger IK1(square symbols) and smaller If(round symbols),
indicating that the cardiomyocytes within the chamber that used to express Tbx3 during development, i.e. GFP+ventricular chamber
cardiomyocytes, differentiated towards a chamber cardiomyocyte phenotype.
DISCUSSION
Our data show that the CCS is established by progressive fate restriction of a Tbx3+cell population in the early developing heart.
From E10.5 onwards, a pacemaker-like phenotype discriminates Tbx3+cardiomyocytes from Tbx3−cardiomyocytes. Furthermore,
the Tbx3+cells were observed to form a network in the developing
heart that excludes early (Gja5+) chamber myocardium. This Tbx3+
[image:7.612.50.419.57.459.2]network includes the AV bundle primordium in the interventricular septum, even though the AV bundle initiatesGja5expression during fetal stages (Bakker et al., 2008; Delorme et al., 1995; Miquerol
Fig. 8. Tbx3+progeny in chamber myocardium acquire chamber
myocardial properties.(A) Immunolabeling of Gja1 (white), Tbx3 (green) and Tbx3+
progeny by GFP (magenta) showing the location of Tbx3+progeny in E14.5
interventricular septum. (B) Tbx3+progeny
in interventricular septum indicated by the box in A at higher magnification (63× with 5× digital zoom). Composition of DAPI (blue), Tbx3+progeny by GFP (magenta)
and Gja1 (white). (C) Tbx3+progeny in
interventricular septum (63× magnification with 5× digital zoom). Composition of DAPI (blue), Tbx3+progeny by GFP (magenta)
and TnI (white). (D) Typical examples of membrane potentials of a SAN/AV junction GFP+cell, a ventricular GFP-negative cell
and a ventricular GFP+cell. (E) Number of
spontaneous active cells (green) of total number of measured cells per group. (F) Typical action potentials of a ventricular GFP+cell and ventricular GFP−cell after stimulation at 2 Hz. (G) Plot of If(round
symbols) and IK1(square symbols) in relation
to the MDP of GFP+SAN/AV junction cells
(green), GFP+ventricular cells (yellow) and
GFP-negative ventricular cells (gray). Scale bar: 100μm.
Table 2. Action potential characteristics of single ventricular GFP+and
GFP−cells
Ventricular GFP− cells (n=11)
Ventricular GFP+
cells (n=8)
Spontaneous active 0 out of 11 3 out of 8 Mean s.e.m. Mean s.e.m.
Cycle length (ms) 500 − 500‡ −
MDP (mV) −75.5 0.7 −70.7* 2.2
APA (mV) 98.6 4.4 89.8 4.9
Vmax (V/s) 74.9 12.7 41.3* 8.1
APD20(ms) 28.6 7.6 26.2 3.8
APD50(ms) 57.8 11.8 49.6 8.3
APD90(ms) 101.0 14.3 99.8 18.7
Data are mean±s.e.m.n, number of cells; MDP, maximal diastolic potential; APA, action potential amplitude; Vmax, maximal upstroke velocity; APD20,
APD50and APD90, action potential duration at 20, 50 and 90% repolarization.
*P<0.05; unpairedt-test.–, not applicable.
‡Stimulation at 2 Hz.
DEVEL
O
[image:7.612.48.300.567.689.2]et al., 2010). Together, these data suggest that the Tbx3+
cardiomyocyte population represents the primordial CCS in the embryo. Analysis of the fate of Tbx3+cell populations labeled at
specific stages of development indicated that they are progenitors of the definitive CCS from early tubular heart stages (E8.5-9.5) onwards, and that their fate is progressively restricted to the definitive Tbx3+ CCS (Fig. 9). Finally, our data indicate that
early Tbx3+ cardiomyocytes maintaining Tbx3 expression form
CCS components, whereas they differentiate to chamber-type cardiomyocytes when they turn off Tbx3 expression. Based on the function of Tbx3 in inducing a pacemaker phenotype in cardiomyocytes (Bakker et al., 2012; Hoogaars et al., 2007), loss of CCS components [including SAN, AVN and AV bundle inTbx3 -null, hypomorphs or conditional mutants (Frank et al., 2011; Hoogaars et al., 2007; Singh et al., 2012)], the co-localization of Tbx3+cells with sites of CCS development and the spontaneous
activity of Tbx3+cells, we propose that throughout development
and after birth, the Tbx3+ cardiomyocytes constitute the CCS
framework, except for the ventricular component: the PFN primordium. The latter apparently does not require Tbx3 to maintain automaticity.
Labeling of Tbx3+cells as early as E8.5 (tubular heart stage)
revealed that this cell population contains the progenitors of definitive Tbx3+CCS components. The progenitors of the AV node/
AV ring bundles are the first to emerge in the early heart tube, followed by those of the AV bundle/BBs, and finally those of the SAN, which emerges from E9.5 onwards (Fig. 9). Furthermore, the embryonic Tbx3+ cell population also contributes to the Tbx3− chamber myocardium. The labeling efficiency by CreERT2 was
rather low, as only a fraction of the actual Tbx3+population was
labeled. However, the labeling distribution was homogenous within the Tbx3+domain (Fig. 3B and Fig. S2). The level and duration of
nuclear CreERT2expression in a cell population is proportional to
the labeling frequency within the CreERT2-positive population.
Therefore, the Tbx3+progeny distribution patterns per heart region,
which are indicative of the labeling frequency, reflect the level and duration of Tbx3 (CreERT2) expression in that region (Fig. 5B and
Fig. S6). The labeling frequency in the Tbx3-negative chambers decreased with later tamoxifen administration, indicating that during development the initially Tbx3+ cells contributing to the
chamber myocardium continuously decrease Tbx3 expression prior to their differentiation to chamber myocardium. Complementary to this, we found an increase in the number of GFP+clusters in each
main CCS component with later stages of labeling, suggesting the Tbx3 level in primordial CCS components increases during development. This may provide a basis for CCS lineage restriction of Tbx3+cells (Fig. S6).
Earlier work suggested that the CCS develops by recruitment of cells from the chamber (working) myocardium to the CCS lineage (Cheng et al., 1999). This was based on the observation that clones originating from a single virally labeled cardiomyocyte in the embryonic heart contained both EAP300+cardiomyocytes of the
conduction system and nearby EAP300−working cardiomyocytes. Along with the observed slow proliferation of the EAP300+CCS
components (AV bundle and right AV ring bundle), this suggested recruitment of non-conductive (EAP300−) cardiomyocytes to an EAP300+ specialized CCS network. EAP300 is expressed in all
cardiomyocytes until 13-15 days of development (McCabe et al., 1995), implying that all cardiomyocytes in the clones were EAP300+ until a fraction acquired an EAP300− phenotype. Although still widely used in the field, our current analysis challenges this recruitment model, as it implies that Tbx3− chamber cardiomyocytes should switch on Tbx3 and (again) acquire a pacemaker phenotype, which is unlikely to occur. To directly address this issue, we traced the fate of Gja5+
cardiomyocytes, becauseGja5is expressed in the early embryonic Tbx3−chamber myocardium and never observed in Tbx3+SAN or
AV canal/node/junction cardiomyocytes, i.e. in the CCS components that maintain slow conductive properties throughout development (Fig. S7) (Alcolea et al., 1999; Christoffels et al., 2000; Delorme et al., 1995; Hoogaars et al., 2004; Miquerol et al., 2010). Genetic inducible fate mapping of the embryonic Gja5+
chamber cardiomyocytes showed that, from E10.5 onwards, chamber cardiomyocytes do not contribute to the Tbx3+SAN or
AV junction (AV node, AV ring bundles and RARB). These data suggest that Tbx3-negative Gja5+ cardiomyocytes are not
recruited to the Tbx3+CCS lineage. BecauseGja5expression is
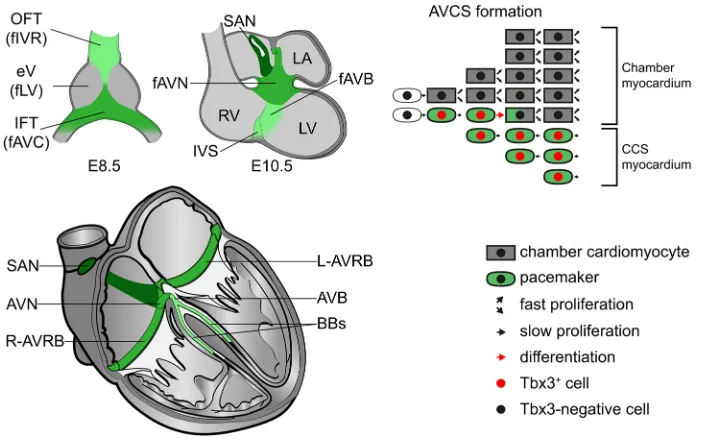
[image:8.612.47.404.57.277.2]activated in the AV bundle during fetal stages and is poorly expressed in the right ventricular compact myocardium (Bakker et al., 2008; Delorme et al., 1995; Miquerol et al., 2010) (Fig. S7), Fig. 9. Model of the development of the CCS revealed by Tbx3+genetic inducible fate mapping.Representation of Tbx3+cells (green)
in the heart at E8.5 and E10.5, and their fate in the formed heart. AV conduction system formation follows a progressive restriction of the fate of embryonic Tbx3+cells towards the formed
AV conduction system. AVB, atrioventricular bundle; AVC, atrioventricular canal; AVCS, atrioventricular conduction system; AVN, atrioventricular node; BBs, bundle branches; CCS, cardiac conduction system; eV, embryonic ventricle; f, future; IFT, inflow tract; IVR, interventricular ring; IVS, interventricular septum; LA, left atrium; L-AVRB, left atrioventricular ring bundle; LV, left ventricle; OFT, outflow tract; R-AVRB, right atrioventricular ring bundle; RV, right ventricle; SAN, sinus node.
DEVEL
O
this marker is less suitable to address contributions from these components.
Whether embryonic Tbx3+cells themselves are bipotent or form
subpopulations giving rise to either CCS or chamber myocardium is unclear from our data. Lineage tracing by labeling single cells could address the issue of bipotency. We have used low dose tamoxifen-mediated labeling of Tbx3+cells as well as the multi-color Confetti
reporter in attempts to perform a clonal analysis. However, both approaches were unsuccessful (data not shown). Nevertheless, the cell fate decision towards the CCS is associated with the level of Tbx3 expression in the progenitors, reflected by more labeled (GFP+) cell clusters within the CCS components. Furthermore,
homozygous loss ofTbx3and one allele ofTbx2(Tbx2 and Tbx3 are partially redundant in the AV canal) or their upstream activator Bmp2 resulted in AV canal cardiomyocytes with a chamber cardiomyocyte identity (Singh et al., 2012). Finally, postnatal loss of SAN, AV node and AV bundle tissue was observed in Tbx3 hypomorphs (∼30% of normal Tbx3 levels; Tbx2 is no longer expressed in AV canal after fetal stages), and severe reduction of Tbx3 dose resulted in bradycardia, AV block, and loss of SAN and AV bundle cells (Frank et al., 2011). Together, these data indicate that Tbx3 is required to induce and maintain the CCS phenotype, and that levels below threshold cause these cells to differentiate to chamber myocardium. Therefore, we hypothesize that the Tbx3+
cells are bipotent and that the level of Tbx3 in a cardiomyocyte within the population controls whether or not it maintains the CCS phenotype. Paracrine signaling from neighboring cardiomyocytes may regulate Tbx3 levels, implying that the relative position of the Tbx3+cells within the developing CCS is important. A limitation of
our approach is that Tbx3CreERT2/+mice are haploinsufficient for
Tbx3, which could affect the extent of the contribution of Tbx3+
cells to the chamber myocardium. Nonetheless, wild-type and Tbx3+/− SAN cells show identical action potentials (data not shown), suggesting that the effect of haploinsufficiency is limited. The initiation of Tbx3 expression in the AV bundle progenitors present in the OFT of the E8.0 heart tube is the first detected sign of specification and differentiation towards the AV bundle. In line with this, Sma-CreERT2-mediated fate mapping indicated that the interventricular septum (including the AV bundle) derived from the anterior,Hcn4−region of the early heart tube. Our data indicate that these AV bundle progenitors must have been added to the tube just before the right ventricle forms from the second heart field (Devine et al., 2014; Kelly et al., 2014). The addition of cardiomyocytes to the heart tube is a continuous process, suggesting that temporally specific signaling in the heart progenitor field may underlieTbx3induction and AV bundle specification. The graded pattern of Tbx3+progeny within the Tbx3-negative interventricular
septum provides insight into the establishment of AV bundle/BBs and formation of the interventricular septum. The spatiotemporal labeling pattern likely reflects the graded transmural pattern and subsequent confinement of Tbx3 expression to the crest of the interventricular septum (Fig. 1) (Bakker et al., 2008; Choquet et al., 2016). Clonal analysis suggested that tamoxifen-labeled E7.5 Sma+
cardiomyocytes include cells exclusively fated to become the AV bundle, whereas lineage segregation still occurs for the BBs at that stage (Choquet et al., 2016). This could reflect limited proliferation and non-dispersive growth of the clones that ended up in the AV bundle region, as the position and number of cell cycles of the labeled progenitor cell in these studies is not known. Indeed, the interventricular septum cardiomyocytes proliferate rapidly, whereas the Tbx3+prospective AV bundle domain maintains a lower rate of
proliferation (Bakker et al., 2008; Cheng et al., 1999; Moskowitz
et al., 2007). We propose that the cells with high Tbx3 expression within the interventricular septum form the AV bundle and BBs. The cells just underneath, which express Tbx3 at lower levels, eventually lose Tbx3 expression, differentiate into chamber myocardium, gain fast-proliferating properties and form the Tbx3-negative interventricular septum. Not all GFP+ Tbx3− cardiomyocytes showed the full chamber myocardial-type electrophysiological phenotype at E14.5 (Fig. 8E,G), suggesting they were in the transition from a nodal to a chamber phenotype after losing Tbx3. We think that this transition is completed at a later developmental stage. Alternatively, at this stage, the phenotype of cardiomyocytes may be graded along the AV bundle to ventricular apex axis in the septum. However, the expression patterns of Cx43 and other targets of Tbx3 involved in conduction do not show a gradient along this axis.
The undifferentiated SAN progenitor cells have been prospectively mapped to a small cell population in the lateral plate mesoderm of Hamburger and Hamilton stage 8 chicken embryos (Bressan et al., 2013). In mouse, the sinus venosus (including the SAN) is formed fromTbx18+Isl1+Shox2+Nkx2-5
-low cardiogenic mesodermal cells from E9-9.5 onwards (Dominguez et al., 2012; Liang et al., 2013; Mommersteeg et al., 2010, 2007; Sun et al., 2013; Wiese et al., 2009).Hcn4marks SAN pacemaker cells in the mature heart and has been used for genetic inducible fate mapping as well (Liang et al., 2013). However, expression ofHcn4in the early developing heart is not confined to the SAN and maintained in the entire sinus venosus until late fetal stages (Liang et al., 2013; Mommersteeg et al., 2007). Upon Hcn4+
sinus venosus formation, a small right-sided subpopulation of these sinus venosus cells immediately initiates Tbx3, which may be the first specific indication of SAN development (Mommersteeg et al., 2007; Wiese et al., 2009). Labeling of Tbx3+ cells around E9
indicated that the SAN progenitors indeed express Tbx3 and form the definitive SAN, and do not contribute to adjacent components such as the right atrium or the Tbx3−but Hcn4+sinus venosus.
The functional properties of cardiomyocytes of the CCS differ between mouse and human. However, it seems that the development of the CCS components is remarkably comparable (Sizarov et al., 2011). The spatiotemporal expression patterns of key cardiogenic and CCS-specific transcription factors are very similar. This suggests that the order of cell fate decisions is conserved between mouse and human and therefore our results could be useful in a clinical context. Insight into the precise timing and mechanism of specification and maintenance of the different CCS components can be used in programming human embryonic or induced stem cells towards a pacemaker phenotype (Birket et al., 2015; Chen et al., 2016; Protze et al., 2017). Disease modeling in patient-specific induced pacemaker cells seems possible in the near future. Moreover, there is a great interest in the development of biological pacemakers by reprogramming resident cells of the heart (Boink et al., 2015; Cingolani et al., 2018; Rosen et al., 2011; van Eif et al., 2018). Our data indicate that with both approaches, early onset and maintenance of Tbx3 expression at the right level is a prerequisite to obtain and maintain induced pacemaker disease models or biological pacemakers for regenerative purposes.
MATERIALS AND METHODS Generation of theTbx3CreERT2allele
A cosmid with Tbx3, isolated from the 129/Ola cosmid genomic library
obtained from the Resourcenzentrum (RZPD) in Berlin, was kindly provided by Dr Andreas Kispert (Institut fur Molekularbiologie, Medizinische
Hochschule Hannover, Hannover, Germany). Homologous DNA sequences,
DEVEL
O
6.1 kb of upstream and 2.1 kb of downstream sequences, were ligated to an
Frt-flankedCreERT2-polyA PGK-neocassette in which the first three codons
of the Tbx3-coding region in exon 1 were replaced by the CreERT2-pA
cassette.CreERT2was derived from pCAG-CreERT2(Matsuda and Cepko,
2007). A diphtheria toxin-negative selection cassette was placed at the 3′
end of the targeting construct. The linearized targeting construct was electroporated into E141B10 embryonic stem (ES) cells. ES clones were screened for homologous recombination by PCR and subsequently Southern blotting, and one clone was injected into C57Bl/6 host blastocysts. Chimeras were mated with FVB females to obtain heterozygous
carriers. Finally, Tbx3CreERT2NEO/+mice were crossed withFlpE mice to
remove thePGK-neocassette (Rodríguez et al., 2000).
Transgenic mice (Mus musculus) were maintained on a FVB/NJ
background commercially obtained from Jackson Laboratory (stock number 100800). Mice 2- to 8-months old, preferably males, were used for generating fetuses/adults. Progeny were screened by PCR for the
presence of theTbx3CreERT2allele using the following primers: forward
(AGCGGAGCCAAGCCAGCA), reverse1 (Tbx3 allele-binding
CCTTG-GCCTCCAGGTGCAC) and reverse2 (CreERT2-binding
GCTAGAGCC-TGTTTTGCACGTTCA). Animal care was carried out in accordance with guidelines from the European Union and Amsterdam University Medical Centers.
RosamTmG/+andRosaeYFP/+reporter mouse lines, and
Gja5CreERT2-IRESmRFP
mTmGreporter mice have been described previously (Muzumdar et al.,
2007). Transgenic mice were maintained on a FVB/NJ background commercially obtained from Jackson Laboratory (stock number 100800). Mice 2- to 8-months old, preferably females, were used for generating
fetuses/adults. Gja5CreERT2-IRESmRFP and RosaeYFP/+ reporter mice have
been described previously (Beyer et al., 2011; Srinivas et al., 2001).
Transgenic mice were maintained on a 129sv/CD1 background.RosaeYFP/+
reporter mice were commercially obtained from the Jackson Laboratory (stock number 006148). Progeny were screened by PCR for the presence of theGja5CreERT2-IRESmRFPallele using the following primers: forward (CA-GCCTCTAGAAAGTAGAGGG), reverse1 (AGGCTGAATGGTATCGC-ACC) and reverse2 (GCATCGACCGGTAATGCAGGC). PCR for the RosaeYFP/+allele was carried out using the following primers: forward (A-AAGTCGCTCTGAGTTGTTAT), reverse1 (GGAGCGGGAGAAATGG-ATATG) and reverse2 (GCGAAGAGTTTGTCCTCAACC). PCR to detect
the presence of theRosamTmGallele was carried out using the following
primers: forward (CGACGTAAACGGCCACAAGTT) and reverse (TT-GATGCCGTTCTTCTGCTTGT). Animal care was in accordance with guidelines from the European Union and Amsterdam University Medical Centers.
Induction of Cre by tamoxifen administration and progesterone administration
Tamoxifen (Sigma-Aldrich, T5648) was dissolved in >99% ethanol and diluted 10 times in freshly opened peanut oil to 10 mg/ml. Tamoxifen administration was performed by injecting 150 µl intraperitoneally on day 1
and 200 µl by oral gavage on day 2 forTbx3CreERT2/+;RosamTmG/+embryos
and mice. A mixture of tamoxifen and progesterone (Sigma-Aldrich, P0130) was used to obtain viable pups. Progesterone (50 mg/ml; Sigma-Aldrich, P0130) and tamoxifen (100 mg/ml) were dissolved in >99% ethanol and diluted 10 times in freshly opened peanut oil. The same administration scheme was followed as for tamoxifen alone. Hearts were harvested at
multiple pre- and postnatal stages. For theGja5CreERT2-IRESmRFP/+;RosaeYFP/+
embryos, tamoxifen (Sigma-Aldrich, T5648) was dissolved at 20 mg/ml; 200 µl was injected intraperitoneally into pregnant females at E10.5, and hearts were harvested and analyzed at E15.5.
Immunohistochemistry
See the supplementary Materials and Methods for a detailed description of the experimental procedure. The primary antibodies used were: goat Tbx3 polyclonal (1:150; Santa Cruz Biotechnology, sc-31656), mouse anti-TnI polyclonal (1:400; Millipore, MAB1691), rabbit anti-Hcn4 polyclonal
(1:200; Millipore, AB5808), chicken anti-GFP polyclonal (1:400; Abcam, ab13970), goat anti-Gja5 (Cx40) polyclonal (1:150; Santa Cruz Biotechnology, sc-20466) and mouse anti-Gja1 (Cx43) monoclonal (1:200; BD Biosciences, 610061). The secondary antibodies used were Alexa Fluor 647 or 680 donkey anti-goat IgG (1:200; Invitrogen, A-21477 or A-21084), Alexa Fluor 555 or 568 donkey anti-mouse IgG (1:200; Invitrogen, A-31570 or A-10037), Alexa Fluor 488 donkey anti-rabbit IgG (1:200; Invitrogen, R37118) and Alexa Fluor 488 goat anti-chicken IgG (1:200; Invitrogen A-11039) or donkey anti-chicken IgG (1:200; Jackson ImmunoResearch Laboratories, 703-545-155). Nuclei were stained using DAPI (1:1000; Sigma, D9542).
In situhybridization
In situ hybridization was performed as described previously (Moorman et al., 2001).
Dye injection and mouse embryo culture
Dye labeling and further embryo culture were performed as described previously (Franco et al., 2001). Labeling of the distal outflow tract was performed by injection of DiI (Interchim, FP-46804A) into the ventral region of the outflow tract myocardium in E8.5 mouse embryos. Embryos
were then cultured for 48 h with 5, 20 and 40% O2, 5% CO2, 75% N2in
rolling bottles, fixed in 4% formaldehyde in PBS, and analyzed and photographed using a Leica MZ16F fluorescence stereomicroscope.
3D reconstruction and quantification of CCS lineage contribution The approach undertaken by us to create a 3D reconstruction of expression patterns has been well described previously (Soufan et al., 2003). In brief, images were taken using a fluorescence microscope Leica DM6000 of sections covering the entire heart that were immunolabeled for Tbx3, TnI
and GFP. A set of images covering the entire heart is referred to as a‘stack’.
The images in the stack were renamed, followed by a conversion from a 12-bit image to a 8-bit image and, if necessary, the minimum and maximum thresholds altered using a MATLAB-based in-house ImageConverter program. In Amira software, the TnI stack was used to align the images using the AlignSlices module. The translational and rotational parameters obtained were applied to the Tbx3 and GFP stacks. The expression domains
of TnI and Tbx3 and GFP+ cells were labeled individually and 3D
reconstructions generated.
To measure the volume of Tbx3+ progeny in the CCS and chamber
myocardium, minor changes had been made to the approach. Instead of a 3D reconstruction of the entire heart, a partial 3D reconstruction was made. It was decided to use 21 images (147 µm thickness) within the stacks in the middle of the ventral-dorsal axis of the (isolated) four-chambered heart.
After labeling the GFP+ cells followed by subdividing them into
non-cardiomyocyte, Tbx3+ pacemaker cell and Tbx3-negative chamber
cardiomyocyte, their volumes were measured using the MaterialStatistics
module. The relative volume of GFP+cells in the CCS over GFP+in the
heart was calculated per heart. At least three hearts were measured per labeling period. The geometric mean of multiple hearts and lowest and highest relative volume observed are visualized.
Visualizing the distribution pattern of Tbx3+progeny
Two 2D molds were made that together represent the 3D heart. One mold
represents the ventral part of the heart, including the OFT, part of the Tbx3+
SAN, the ventral side of the Tbx3+ AV ring bundles and the Tbx3+
retroaortic root branch. The other mold represents the mid-dorsal region of
the heart, including part of the Tbx3+ SAN, venous valves, interatrial
septum, AV node, dorsal and lateral sides of the AV ring bundles, AV
bundle, and BBs (see Fig. 5A). The Tbx3+progeny were projected onto
these molds for each heart as exemplified in Fig. S5. One dot on the mold
represents a GFP+cell or cluster of cells within an image. Every fifth image
in a stack was used to draw in the GFP+cells, meaning a step size of 35 µm
through the entire heart. In this way, the distribution pattern of the Tbx3+
progeny in the entire heart has been projected onto the two molds. The
molds in Fig. 5B are a projection of the sum of Tbx3+progeny from multiple
hearts (at least three) of the same labeling period.
DEVEL
O
Cellular electrophysiology
Action potentials were recorded at 37°C in isolated cells using the amphotericin-perforated patch-clamp technique. See the supplementary Materials and Methods for a detailed description of the experimental procedure.
Acknowledgements
We thank Jaco Hagoort for his assistance with AMIRA software and Jan Ruijter for advice regarding volume measurements.
Competing interests
The authors declare no competing or financial interests.
Author contributions
Conceptualization: R.A.M., G.J.J.B., B.J.B., L.M., A.O.V., V.M.C.; Methodology: R.A.M., B.J.B., V.M.C.; Formal analysis: R.A.M., V.M.C.; Investigation: R.A.M., M.T.M.M., J.N.D., C.C., V.W., C.d.G.-d.V., L.M., A.O.V., V.M.C.; Data curation: R.A.M., V.M.C.; Writing - original draft: R.A.M., A.O.V., V.M.C.; Writing - review & editing: R.A.M., M.T.M.M., J.N.D., V.W., G.J.J.B., B.J.B., L.M., A.O.V., V.M.C.; Visualization: R.A.M., V.M.C.; Supervision: V.M.C.; Project administration: R.A.M., B.J.B., V.M.C.; Funding acquisition: G.J.J.B., V.M.C.
Funding
This work was supported by the Hartstichting [2010B205 to V.M.C.] and Fondation Leducq [to V.M.C.]. B.J.B. is supported by a personal grant from the Hartstichting (2016T047). G.J.J.B. is supported by personal grants from the Hartstichting (2014T065), the Nederlandse Organisatie voor Wetenschappelijk Onderzoek (ZonMw Veni 016.156.162) and the European Research Council (ERC Starting Grant 714866).
Supplementary information
Supplementary information available online at
http://dev.biologists.org/lookup/doi/10.1242/dev.167361.supplemental
References
Aanhaanen, W. T. J., Brons, J. F., Dominguez, J. N., Rana, M. S., Norden, J., Airik, R., Wakker, V., de Gier-de Vries, C., Brown, N. A., Kispert, A. et al.
(2009). The Tbx2+ primary myocardium of the atrioventricular canal forms the atrioventricular node and the base of the left ventricle.Circ. Res.104, 1267-1274.
Alcolea, S., Theveniau-Ruissy, M., Jarry-Guichard, T., Marics, I., Tzouanacou, E., Chauvin, J.-P., Briand, J.-P., Moorman, A. F. M., Lamers, W. H. and Gros, D. B.(1999). Downregulation of connexin 45 gene products during mouse heart development.Circ. Res.84, 1365-1379.
Bakker, M. L., Boukens, B. J., Mommersteeg, M. T. M., Brons, J. F., Wakker, V., Moorman, A. F. M. and Christoffels, V. M.(2008). Transcription factor Tbx3 is required for the specification of the atrioventricular conduction system.Circ. Res.
102, 1340-1349.
Bakker, M. L., Boink, G. J. J., Boukens, B. J., Verkerk, A. O., van den Boogaard, M., den Haan, A. D., Hoogaars, W. M. H., Buermans, H. P., de Bakker, J. M. T., Seppen, J. et al.(2012). T-box transcription factor TBX3 reprogrammes mature cardiac myocytes into pacemaker-like cells.Cardiovasc. Res.94, 439-449.
Barry, P. H. and Lynch, J. W.(1991). Liquid junction potentials and small cell effects in patch-clamp analysis.J. Membr. Biol.121, 101-117.
Baruteau, A.-E., Probst, V. and Abriel, H.(2015). Inherited progressive cardiac conduction disorders.Curr. Opin. Cardiol.30, 33-39.
Beyer, S., Kelly, R. G. and Miquerol, L.(2011). Inducible Cx40-Cre expression in the cardiac conduction system and arterial endothelial cells.Genesis49, 83-91.
Birket, M. J., Ribeiro, M. C., Verkerk, A. O., Ward, D., Leitoguinho, A. R., den Hartogh, S. C., Orlova, V. V., Devalla, H. D., Schwach, V., Bellin, M. et al.
(2015). Expansion and patterning of cardiovascular progenitors derived from human pluripotent stem cells.Nat. Biotechnol.33, 970-979.
Boink, G. J. J., Christoffels, V. M., Robinson, R. B. and Tan, H. L.(2015). The past, present, and future of pacemaker therapies.Trends Cardiovasc. Med.25, 661-673.
Bressan, M., Liu, G. and Mikawa, T.(2013). Early mesodermal cues assign avian cardiac pacemaker fate potential in a tertiary heart field.Science340, 744-748.
Chen, I. Y., Matsa, E. and Wu, J. C.(2016). Induced pluripotent stem cells: at the heart of cardiovascular precision medicine.Nat. Rev. Cardiol.13, 333-349.
Cheng, G., Litchenberg, W. H., Cole, G. J., Mikawa, T., Thompson, R. P. and Gourdie, R. G.(1999). Development of the cardiac conduction system involves recruitment within a multipotent cardiomyogenic lineage. Development 126, 5041-5049.
Choquet, C., Marcadet, L., Beyer, S., Kelly, R. G. and Miquerol, L.(2016). Segregation of central ventricular conduction system lineages in early SMA+ cardiomyocytes occurs prior to heart tube formation.J. Cardiovasc. Dev. Dis.
3, 1-13.
Christoffels, V. M. and Moorman, A. F. M.(2009). Development of the cardiac conduction system: why are some regions of the heart more arrhythmogenic than others?Circ. Arrhythm. Electrophysiol.2, 195-207.
Christoffels, V. M., Habets, P. E. M. H., Franco, D., Campione, M., de Jong, F., Lamers, W. H., Bao, Z.-Z., Palmer, S., Biben, C., Harvey, R. P. et al.(2000). Chamber formation and morphogenesis in the developing mammalian heart.Dev. Biol.223, 266-278.
Cingolani, E., Goldhaber, J. I. and Marbán, E. (2018). Next-generation pacemakers: from small devices to biological pacemakers.Nat. Rev. Cardiol.
15, 139-150.
Davis, D. L., Edwards, A. V., Juraszek, A. L., Phelps, A., Wessels, A. and Burch, J. B. E.(2001). A GATA-6 gene heart-region-specific enhancer provides a novel means to mark and probe a discrete component of the mouse cardiac conduction system.Mech. Dev.108, 105-119.
De la Cruz, M. V., Sanchez Gomez, C., Arteaga, M. M. and Arguëllo, C.(1977). Experimental study of the development of the truncus and the conus in the chick embryo.J. Anat.123, 661-686.
Delorme, B., Dahl, E., Jarry-Guichard, T., Marics, I., Briand, J.-P., Willecke, K., Gros, D. and Théveniau-Ruissy, M. (1995). Developmental regulation of connexin 40 gene expression in mouse heart correlates with the differentiation of the conduction system.Dev. Dyn.204, 358-371.
Devine, W. P., Wythe, J. D., George, M., Koshiba-Takeuchi, K. and Bruneau, B. G. (2014). Early patterning and specification of cardiac progenitors in gastrulating mesoderm.eLife3, 1-23.
Dobrzynski, H., Anderson, R. H., Atkinson, A., Borbas, Z., D’Souza, A., Fraser, J. F., Inada, S., Logantha, S. J. R. J., Monfredi, O., Morris, G. M. et al.(2013). Structure, function and clinical relevance of the cardiac conduction system, including the atrioventricular ring and outflow tract tissues.Pharmacol. Ther.139, 260-288.
Dominguez, J. N., Meilhac, S. M., Bland, Y. S., Buckingham, M. E. and Brown, N. A.(2012). Asymmetric fate of the posterior part of the second heart field results in unexpected left/right contributions to both poles of the heart.Circ. Res.111, 1323-1335.
Franco, D., Kelly, R., Moorman, A. F. M., Lamers, W. H., Buckingham, M. and Brown, N. A.(2001). MLC3F transgene expression inivmutant mice reveals the importance of left-right signalling pathways for the acquisition of left and right atrial but not ventricular compartment identity.Dev. Dyn.221, 206-215.
Frank, D. U., Carter, K. L., Thomas, K. R., Burr, R. M., Bakker, M. L., Coetzee, W. A., Tristani-Firouzi, M., Bamshad, M. J., Christoffels, V. M. and Moon, A. M.
(2011). Lethal arrhythmias in Tbx3-deficient mice reveal extreme dosage sensitivity of cardiac conduction system function and homeostasis.Proc. Natl. Acad. Sci USA109, E154-E163.
Hoogaars, W. M., Tessari, A., Moorman, A. F., de Boer, P. A., Hagoort, J., Soufan, A. T., Campione, M. and Christoffels, V. M.(2004). The transcriptional repressor Tbx3 delineates the developing central conduction system of the heart.
Cardiovasc. Res.62, 489-499.
Hoogaars, W. M. H., Engel, A., Brons, J. F., Verkerk, A. O., de Lange, F. J., Wong, L. Y. E., Bakker, M. L., Clout, D. E., Wakker, V., Barnett, P. et al.(2007). Tbx3 controls the sinoatrial node gene program and imposes pacemaker function on the atria.Genes Dev.21, 1098-1112.
Kelly, R. G., Buckingham, M. E. and Moorman, A. F.(2014). Heart fields and cardiac morphogenesis.Cold Spring Harb. Perspect. Med.4, 1-11.
Liang, X., Wang, G., Lin, L., Lowe, J., Zhang, Q., Bu, L., Chen, Y., Chen, J., Sun, Y. and Evans, S. M.(2013). HCN4 dynamically marks the first heart field and conduction system precursors.Circ. Res.113, 399-407.
Mangoni, M. E. and Nargeot, J.(2008). Genesis and regulation of the heart automaticity.Physiol. Rev.88, 919-982.
Matsuda, T. and Cepko, C. L. (2007). Controlled expression of transgenes introduced by in vivo electroporation.Proc. Natl. Acad. Sci. USA104, 1027-1032.
McCabe, C. F., Gourdie, R. G., Thompson, R. P. and Cole, G. J. (1995). Developmentally regulated neural protein EAP-300 is expressed by myocardium and cardiac neural crest during chick embryogenesis.Dev. Dyn.203, 51-60.
Miquerol, L., Moreno-Rascon, N., Beyer, S., Dupays, L., Meilhac, S. M., Buckingham, M. E., Franco, D. and Kelly, R. G.(2010). Biphasic development of the mammalian ventricular conduction system.Circ. Res.107, 153-161.
Mohan, R., Boukens, B. J. and Christoffels, V. M.(2017). Lineages of the cardiac conduction system.J. Cardiovasc. Dev. Dis.4, 1-14.
Mommersteeg, M. T. M., Hoogaars, W. M. H., Prall, O. W. J., de Gier-de Vries, C., Wiese, C., Clout, D. E. W., Papaioannou, V. E., Brown, N. A., Harvey, R. P., Moorman, A. F. M. et al.(2007). Molecular pathway for the localized formation of the sinoatrial node.Circ. Res.100, 354-362.
Mommersteeg, M. T. M., Domı́nguez, J. N., Wiese, C., Norden, J., de Gier-de Vries, C., Burch, J. B. E., Kispert, A., Brown, N. A., Moorman, A. F. M. and Christoffels, V. M.(2010). The sinus venosus progenitors separate and diversify from the first and second heart fields early in development.Cardiovasc. Res.87, 92-101.
Moorman, A. F. M., Houweling, A. C., de Boer, P. A. J. and Christoffels, V. M.
(2001). Sensitive nonradioactive detection of mRNA in tissue sections: novel application of the whole-mount in situ hybridization protocol.J. Histochem.
Cytochem.49, 1-8.
DEVEL
O
Moskowitz, I. P. G., Kim, J. B., Moore, M. L., Wolf, C. M., Peterson, M. A., Shendure, J., Nobrega, M. A., Yokota, Y., Berul, C., Izumo, S. et al.(2007). A molecular pathway including id2, tbx5, and nkx2-5 required for cardiac conduction system development.Cell129, 1365-1376.
Muzumdar, M. D., Tasic, B., Miyamichi, K., Li, L. and Luo, L.(2007). A global double-fluorescent Cre reporter mouse.Genesis45, 593-605.
Park, D. S. and Fishman, G. I.(2011). The cardiac conduction system.Circulation
123, 904-915.
Protze, S. I., Liu, J., Nussinovitch, U., Ohana, L., Backx, P. H., Gepstein, L. and Keller, G. M. (2017). Sinoatrial node cardiomyocytes derived from human pluripotent cells function as a biological pacemaker.Nat. Biotechnol.35, 56-68.
Rodrı́guez, C. I., Buchholz, F., Galloway, J., Sequerra, R., Kasper, J., Ayala, R., Stewart, A. F. and Dymecki, S. M.(2000). High-efficiency deleter mice show that FLPe is an alternative to Cre-loxP.Nat. Genet.25, 139-140.
Rosen, M. R., Robinson, R. B., Brink, P. R. and Cohen, I. S.(2011). The road to biological pacing.Nat. Rev. Cardiol.8, 565-666.
Sankova, B., Benes, J., Jr, Krejci, E., Dupays, L., Theveniau-Ruissy, M., Miquerol, L. and Sedmera, D.(2012). The effect of connexin40 deficiency on ventricular conduction system function during development.Cardiovasc. Res.95, 469-479.
Singh, R., Hoogaars, W. M., Barnett, P., Grieskamp, T., Rana, M. S., Buermans, H., Farin, H. F., Petry, M., Heallen, T., Martin, J. F. et al.(2012). Tbx2 and Tbx3 induce atrioventricular myocardial development and endocardial cushion formation.Cell Mol. Life Sci.69, 1377-1389.
Sizarov, A., Devalla, H. D., Anderson, R. H., Passier, R., Christoffels, V. M. and Moorman, A. F. M.(2011). Molecular analysis of patterning of conduction tissues in the developing human heart.Circ. Arrhythm. Electrophysiol.4, 532-542.
Soufan, A. T., Ruijter, J. M., van den Hoff, M. J. B., de Boer, P. A. J., Hagoort, J. and Moorman, A. F. M. (2003). Three-dimensional reconstruction of gene expression patterns during cardiac development.Physiol. Genomics13, 187-195.
Srinivas, S., Watanabe, T., Lin, C.-S., William, C. M., Tanabe, Y., Jessell, T. M. and Costantini, F.(2001). Cre reporter strains produced by targeted insertion of EYFP and ECFP into the ROSA26 locus.BMC Dev. Biol.1, 4.
Sun, Y., Liang, X., Najafi, N., Cass, M., Lin, L., Cai, C.-L., Chen, J. and Evans, S. M.(2007). Islet 1 is expressed in distinct cardiovascular lineages, including pacemaker and coronary vascular cells.Dev. Biol.304, 286-296.
Sun, C., Zhang, T., Liu, C., Gu, S. and Chen, Y. P.(2013). Generation of Shox2-Cre allele for tissue specific manipulation of genes in the developing heart, palate, and limb.Genesis51, 515-522.
van Eif, V. W. W., Devalla, H. D., Boink, G. J. J. and Christoffels, V. M.(2018). Transcriptional regulation of the cardiac conduction system.Nat. Rev. Cardiol.15, 1-14.
Verkerk, A. O., den Ruijter, H. M., Bourier, J., Boukens, B. J., Brouwer, I. A., Wilders, R. and Coronel, R.(2009). Dietary fish oil reduces pacemaker current and heart rate in rabbit.Heart Rhythm.6, 1485-1492.
Wessels, A., Vermeulen, J. L. M., Verbeek, F. J., Virágh, S., Kálmán, F., Lamers, W. H. and Moorman, A. F. M.(1992). Spatial distribution of“tissue-specific” antigens in the developing human heart and skeletal muscle: III. An immunohistochemical analysis of the distribution of the neural tissue antigen G1N2 in the embryonic heart; implications for the development of the atrioventricular conduction system.Anat. Rec.232, 97-111.
Wetzel, G. T. and Klitzner, T. S.(1996). Developmental cardiac electrophysiology recent advances in cellular physiology.Cardiovasc. Res.31, E52-E60.
Wiese, C., Grieskamp, T., Airik, R., Mommersteeg, M. T. M., Gardiwal, A., de Gier-de Vries, C., Schuster-Gossler, K., Moorman, A. F. M., Kispert, A. and Christoffels, V. M.(2009). Formation of the sinus node head and differentiation of sinus node myocardium are independently regulated by tbx18 and tbx3.Circ. Res.
104, 388-397.
Wolf, C. M. and Berul, C. I.(2006). Inherited conduction system abnormalities–one group of diseases, many genes.J. Cardiovasc. Electrophysiol.17, 446-455.
Wu, M., Peng, S. and Zhao, Y.(2014). Inducible gene deletion in the entire cardiac conduction system using Hcn4-CreERT2 BAC transgenic mice.Genesis 52, 134-140.