4358
LEVENSHTEIN DISTANCE-BASED REGULARITY
MEASUREMENT OF CIRCADIAN RHYTHM PATTERNS
1TAEK LEE, 2HOH PETER IN
1,2Department of Computer Science and Engineering, Korea University, South Korea
E-mail: 1comtaek@gmail.com, 2hoh_in@korea.ac.kr
ABSTRACT
In this paper, we introduce an algorithm and an application for modeling user’s circadian rhythm with activity trackers, also known as smart bands (e.g., Misfit Shine or Fitbit). The proposed algorithm detects anomalies in the user 's circadian rhythm pattern (i.e., activity pattern of 24-hour cycle). Diurnal biorhythm data were collected using smart bands and the data were analyzed using Levenshtein distance. We evaluate the performance of the proposed algorithm to distinguish between ordinary days and abnormal days. During the experiment period, the users recorded the mood, fatigue, and event occurrence of the day, and evaluated the performance of the proposed algorithm through comparison with user’s recorded opinions. In the user study, the proposed method detected normal or abnormal patterns of life rhythm with 86% accuracy. Keywords: Anomaly Detection, Circadian Rhythm, Pattern Modeling, Wearable Device, Activity Tracker
1. INTRODUCTION
Including human, all the animals in the world have circadian rhythm in their daily life. For example, people get up in the morning, see sun rising, work hard during daylight, and sleep at night after sunset. People having regular daily life pattern can feel better than ever. Regular patterns in life makes regular biological hormone level and consequently it derives stabilized circadian rhythm repeatedly. However, if irregular daily patterns occur, it can confuse the circadian clock in human body and it can cause for example insomnia, fatigue, or depression.
Thus, it is very important to measure daily rhythm for healthcare. A wearable device, called a smart band or fitness tracker, is a useful device for observing and measuring several healthcare related scales, such as walking or running distance, calorie consumption, heart pulse rate, and quality of sleep. Unfortunately, most applications that currently use smart bands are just offering simple weight loss diet scales or health care information. Smart bands are thought as a good tool that can be effectively used to improve various health troubles and mental illnesses such as fatigue, bipolar disorder, and insomnia beyond simple health care goals. It is reported that circadian rhythms in daily cycle can cause bipolar disorder and insomnia when broken or incorrect [1].
Therefore, we measured the user's circadian rhythm using smart bands and detected abnormal patterns. The circadian rhythm is a biological process that exhibits an endogenously entrained oscillation of about 24 hours. This 24-hour rhythm is fundamentally influenced by daily cycle clocks inside human body that can adjust human creatures and behavior to the everyday changes of day and night cycles. An irregular or erroneous pattern in everyday life can confuse the internal biological clock and create an abnormal biological rhythm [1].
In this paper, the circadian rhythm is derived from user data such as step count per minute, sleep time and sleep quality, which can be measured by a user-worn smart band. Then, the induced rhythm data was compared to those of normal standard days using Levenshtein distance [2] and all abnormal patterns were tested and detected. The results of the anomaly detection were evaluated according to the user's research record in interviews based on the questionnaire.
4359 commute, work for 8 hours in a certain space, and return home at 18:00) and their pattern can be changed by some events or new habits. For example, Figure 3 shows a bar chart where each of bars is an activity level per each hour in a day. People with normal regular life patterns might have similar distribution shape of the daily bar chart over a long period of days.
2. LEVENSHTEIN DISTANCE ALGORITHM
In our study, a 24-hour rhythm pattern is encoded as a string form. To measure similarity of strings, we use Levenshtein distance that internally uses three modifications of insertion, deletion, and substitution to make two given strings identical. The number of modifications means dissimilarity (distance) between the two strings. The more the two strings are dissimilar each other, the more modifications are required to make them identical. For example, suppose that there are two strings: x = revgniaton and y = recognition. There exist many possible combinations with repeated modifications in completely converting x into y. To minimize the total converting cost, the Levenshtein distance algorithm can be used better than using exhaustive search. Figure 1 shows a table describing a sequence of modifications that converts x into y with the algorithm. The Levenshtein distance algorithm internally uses a 2D array,
D[0…r][0…c], with (r + 1) * (c + 1) size. Figure
1 has the vertical axis of the string y and a horizontal axis of the string x. Values in the cells are cost changed by incremental modifications.
0 1 2 3 4 5 6 7 8 9 10 1 0 1 2 3 4 5 6 7 8 9 2 1 0 1 2 3 4 5 6 7 8 3 2 1 1 2 3 4 5 6 7 8 4 3 2 2 2 3 4 5 6 6 7 5 4 3 3 2 3 4 5 6 7 7 6 5 4 4 3 2 3 4 5 6 7 7 6 5 5 4 3 2 3 4 5 6 8 7 6 6 5 4 3 3 3 4 5 9 8 7 7 6 5 4 4 4 4 5 10 9 8 8 7 6 5 5 5 4 5 11 10 9 9 8 7 6 6 6 5 4 0 1 2 3 4 5 6 7 8 9 10 x= r e v g n i a t o n 0 y=
1 r 2 e 3 c 4 o 5 g 6 n 7 i 8 t 9 i 10 o 11 n
(j-1, i-1) ( j-1, i) (j, i-1) (j, i)
no change substitute (S) insert (I) delete (D)
Figure1.AnExampleofLevenshteinDistance Computation
Figure 2 is a pseudo code for the algorithm that computes Levenshtein distance between two input strings x and y. In Figure 2, the line number 1 and 2 are for initialization. The line number 3 through 12 are for forward computation. In the line number 8, D[j-1][i]+icost means cost of
insertion, D[j][i-1]+dcost means cost of
deletion, and D[j-1][i-1]+scost means cost
of substitution; the constants 1, 1, and scost are
respective unit cost for each modification. The line number 9 is used for backward tracking. The line number 13 through 23 are for finding the best solution by backward tracking. In the line number 13, the Levenshtein distance outcome becomes finally located in bottom of the right corner in the array D. Backward tracking begins from bottom of the right corner of the array D. Forward computation fills up the table of Figure 1 with a proper sequence of modifications and consequently the Levenshtein distance outcome should be located on the cell, D[r][c] at the end. While filling up
the array D, modifications are logged in the array
action[][]. Through the backward tracking
steps, the algorithm tracks back edit_list[],
from (r, c) toward (0, 0), to search for a sequence of modifications that convert the string x into the string y with the minimum total cost.
Input: test string x and base string y Output: distance d between x and y,
a list of change operations, edit_list[]
1. c = length(x), r = length(y) 2. create an array D[0…r][0…c] 3. for (i=0 to c) D[0][i] = i; 4. for (j=0 to r) D[j][0] = j; 5. for (j=1 to r)
6. for (i=1 to c) {
7. if (xi= yj) scost=0; else scost=1;
8. D[j][i] = min(D[j-1][i]+icost, D[j][i-1]+dcost,
D[j-1][i-1]+scost);
9. act = minimum operation in the line 8
10. if (act=‘substitute’ and scost=0)
act=‘no change’
11. action[j][i]=act;
12. }
13. d = D[r][c]; 14. j = r; i=c; 15. k = 1; 16. repeat {
17. if (action[j][i]=‘insert’)
{ edit_list[k]=‘insert’; j--; }
18. else if (action[j][i]=‘delete’)
{ edit_list[k]=‘delete’; i--; }
19. else if (action[j][i]=‘substitute’)
{ edit_list[k]=‘substitute’; j--; i--; }
20. else if (action[j][i]=‘no change’)
{ edit_list[k]=‘no change’; j--; i--; }
21. k++;
22. } until (j=0 and i=0);
23. reverse the sequence of edit_list[]
Figure2.LevenshteinDistanceComputingAlgorithm
3. THE PROPOSED METHOD: HOW TO MEASURE CIRCADIAN RHYTHM
[image:2.612.315.517.367.596.2] [image:2.612.94.299.500.640.2]4360 user study period, and then divided the step scope from 0 to the maximum into quartiles; that is, Zero = [0%, 25%), Low = [25%, 50%), Medium = [50%, 75%), and High = [75%, 100%]. Next, we encoded the circadian rhythm data from the smart band into 24-length strings, for example, CRx = t1t2t3…t24 = ZZLMH….ZZ, where each letter represents a certain level of activity in each hour. Thus, a 24-length string depicts the CR pattern of a user (See Figure 3).
ZZLHMZZMHMHMZZZHHZHH…ZZ
24 characters
Figure3. PatterDataConvertingProcess
CR11= ZZLMH….ZZ
CR12= ZLLMH….ZZ
CR13= ZZHMH….ZZ
CR130= LZLMH….ZZ
…
Translated 30 days strings (User 1)
① Do cross comparison with Levenshtein distance ② Sort the CRs in order of their distance averages ③ Larger distance values, more abnormal days
Low distance gap
(Closer to most days) (Far away from most days)High distance gap
… …
30 days patterns (User 1)
Figure4.TheProposedProcesstoMeasurePattern IrregularityusingLevenshteinDistance
With the encoded 24-length string, the user's rhythm data can be compared in terms of similarity as shown in Figure 4. If the string for a certain day is the same as the string captured for most other days, it indicates that the user activity follows the normal activity pattern. Otherwise, the user's day was abnormal (e.g., too much activity or no activity). A cross-comparison between the days’ strings of all pairs allows you to determine a near or
far day from the average day. For comparison, Levenshtein distance [2] was used in our study.
Using Levenshtein distance is very useful. Particularly, it is suitable for modeling dynamics of circadian rhythm patterns. Levenshtein distance is a measure of the difference between two sequences. It measures the number of modifications (i.e., inserts, deletes, or substitutions) needed to make the order of the two strings given equal. For various reasons, user's daily activity pattern can be distorted against the pattern of normal days. For example, a business meeting that is not on schedule can be suddenly inserted into schedule. Even though you usually work out at the gym regularly in the afternoon, you should delete appointments due to night shifts or substitute work shifts with other schedules. Thus, an irregular daily pattern can occur and in this case the Levenshtein distance can model the dynamics very well. The Levenshtein distance algorithm internally has three weight parameters for cost of modification such as insertion, deletion and substitution costs. Several actions for character insertion, deletion, and substitution determine the total cost of string editing. Metaphorically, higher cost means that it is difficult to convert a severely distorted abnormal rhythm pattern into a pattern of normal days.
In addition to step-based activities, sleep-related activities are considered good resources for monitoring circadian rhythms. Therefore, we performed three measurements of bedtime, sleep length, and sleep quality to understand the user's rhythm pattern at night. They are numerical data that can be directly acquired from the smart band, Fitbit. Bedtime is the time when the user goes to bed, sleep length is the interval between bedtime and wake-up time, and sleep quality is a ratio of good sleep excluding restless time from total sleep length. The smart band Fitbit has a motion sensor so that it can detect any subtle motion change (e.g., toss and turn in bed). For example, if the restless time with some motions was one hour and the whole sleep length was ten hours, then sleep quality will be 90% (i.e., ratio of good sleep is 90%). Once bed time, sleep length, and quality of sleep comprehensively breaks, users cannot feel normal.
[image:3.612.97.300.219.343.2]4361 4. USER STUDY
In this section, we evaluated validity of the method proposed in Section 3 by applying it to a real world-based experiment setting and comparing method outcomes with user opinions.
4.1 Experiment Setup
In the experiment, Fitbit devices were used and 24-hour user rhythm data was collected from 6 subjects for 15 days. Subjects were full-time graduate students who had daily rhythmic patterns. During the experiment period, they were asked every day to report whether they felt unusual compared to their average normal days or not. The subjects had regular jobs with very regular life patterns. If they had some unexpected events in a day or they were extraordinarily busy, they could recognize and easily remember some unusual days. After collecting questionnaire data, for evaluation, we matched results of the proposed anomaly detection technique and results of the opinions reported every day from the subjects. The students were full-time so had regular schedules in the lab going to work at 9:00 and getting off work at 19:00 during weekdays.
During the experiment period, they received an email every in the morning and were asked to answer two questions in the email: “(1) Were there any irregular events yesterday?” and “(2) How did you feel yesterday in terms of activities compared to your average days?” For the first question, subjects were asked to answer using a free description, for example, “nothing special,” “I was sick,” “I watched a movie,” “I slept late,” “I took a walk for exercise,” “I worked overtime until night,” “I had an education seminar,” “I took a business trip,” “I went shopping,” and so on. For the second question, subjects were asked to choose one of three choices: “1 – yesterday was easier than average in terms of activities,” “2 – yesterday was no different from usual,” and “3 – yesterday was definitely harder than average.” Table 1 presents an example of an answer-sheet from a subject.
With the two types of question answers, we could clearly understand whether a subject’s opinion for a day was actually normal or abnormal. Because our detection method proposed in Section 3 outputs a binary variable: either ‘normal’ or ‘abnormal’, we had to gain a same binary type of opinion from the answer-sheet to match it with an output that the detection method generates for the method performance evaluation. Basically, if the answer in the second question from the
[image:4.612.312.523.152.633.2]answer-sheet was 2, then we regarded it as normal and otherwise abnormal.
Table 1. An Example of the User-Answered Opinion Record
Date Answer for Question 1 Answer for
Question 2
2013-11-19 2
2013-11-20 2
2013-11-22 2
2013-11-23
participated in an invited seminar, team-building
dinner at night
3
2013-11-24 3
2013-11-25 wedding ceremony of afriend 3
2013-11-26 business trip for a project
meeting 3
2013-11-27 conference participation 3
2013-11-28 conference participation 3
2013-11-29 conference participation 3
2013-11-30 3
2013-12-01 3
2013-12-02 3
2013-12-03 education seminar 2
2013-12-04 education seminar 2
2013-12-05 education seminar 2
2013-12-06 education seminar 2
2013-12-07 education seminar 2
2013-12-08 went shopping 3
2013-12-09 3
2013-12-10 installed and setup a server 2
2013-12-11 2
2013-12-12 escorted Prof. Yeun to
dinner 2
2013-12-13 2
2013-12-14
I was sick, so could not attend my swimming
program
2
2013-12-15 2
2013-12-16 dinner with parents 3
2013-12-17 2
2013-12-18 2
2013-12-19 2
2013-12-20 2
2013-12-21 a seminar on secure coding 2
2013-12-23 I worked at the weekend 2
4362 handle that problem, we also manually investigated answers given for the free description question to interpret the normality of a day more precisely. For example, if a subject answered “2 – yesterday was as usual” for the second question, yet explicitly recorded “I took a business trip” for the first question, we labeled it to be an abnormal day, because it was absolutely obvious that the subject had undertaken a totally different pattern of activity over the whole day because of the irregular business trip event. Similarly, it is also a self-evident fact that weekends are completely different compared to weekdays in terms of activities if they did not attend the lab. Therefore, weekends were also regarded as abnormal from the regular schedule of viewpoint.
4.2 Results
In this section, we first present the performance evaluation results of our proposed anomaly detection method. We then give optimization results for the cost parameters adopted in the Levenshtein distance computation.
4.2.1 Performance Evaluation
We tested our proposed method in two aspects of detection: abnormal days versus normal days. From distance-sorted activity data (in descendent order), the top three and bottom three days were selected and respectively predicted as abnormal and normal representatives. That is, the top three days are considered as outliers and the bottom 3 days are considered as norms. If the prediction outcomes of the six days correctly match with opinions of the user-answered daily records, then the matched ones were considered accurate detection cases.
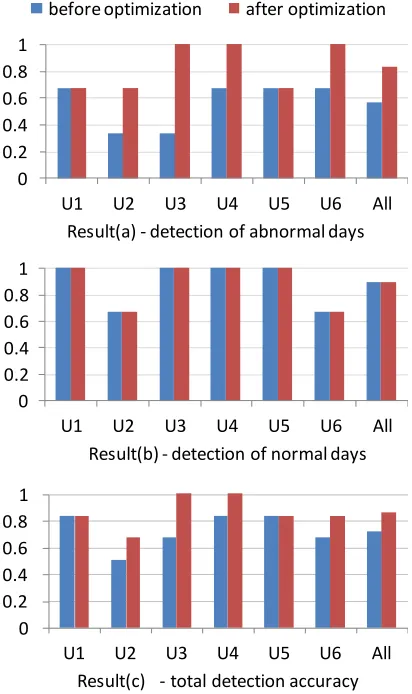
Figure 5 shows the evaluation results of our proposed anomaly detection method before and after using optimized parameters with step-based activity data.
Result(a) in Figure 5 shows the detection accuracy for predicting abnormal days. Before optimization, for most users except user U2 and U3, our proposed method worked better (accuracy = 67%) than a random method can do (50%). The average detection accuracy was 56% (all users in Figure 5); after optimization, the performance was significantly improved to 83%, but same in U1 and U5.
Result(b) in Figure 5 shows the detection accuracy for predicting normal days. The
performance was comparatively much better than the case of detecting abnormal days. The performance for all users was 89% both before and after optimization.
Result(c) in Figure 5 shows total detection accuracy for predicting both abnormal and normal days. The optimization process apparently improves the performance for each user, and the performance for all users after optimization was 86%.
Result(a) ‐ detection of abnormal days 0
0.2 0.4 0.6 0.8 1
U1 U2 U3 U4 U5 U6 All
before optimization after optimization
0 0.2 0.4 0.6 0.8 1
U1 U2 U3 U4 U5 U6 All
Result(b) ‐ detection of normal days
0 0.2 0.4 0.6 0.8 1
U1 U2 U3 U4 U5 U6 All
Result(c) ‐ total detection accuracy
Figure 5. Evaluation of Circadian Rhythm Detection using Step-based Activity Data
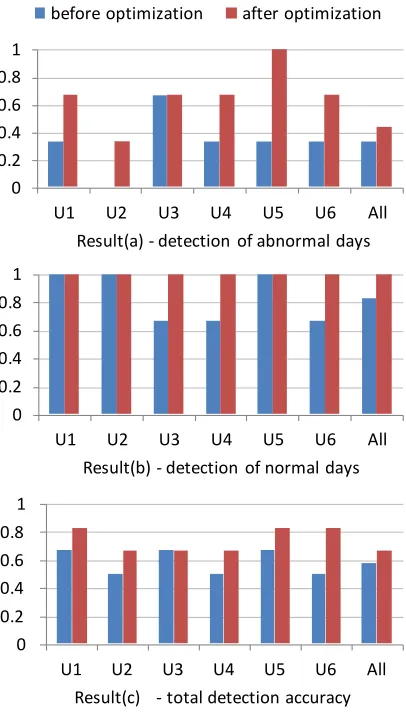
[image:5.612.318.524.225.572.2]4363 day detection, the proposed method worked well with or without optimization.
As shown in Result(c) in Figure 6, the total detection accuracy for all users with sleep-based activity data was 67%, an average performance after optimization. Even after parameter optimization, the total detection accuracy (67%) was still lower than the case of using step-based activity data (86%, all users in Result(c) of Figure 5). That indicates that step-based activity data is preferred to sleep-based activity data in terms of more precisely predicting a user’s actual feeling for abnormal days.
0 0.2 0.4 0.6 0.8 1
U1 U2 U3 U4 U5 U6 All
Result(a) ‐ detection of abnormal days
before optimization after optimization
0 0.2 0.4 0.6 0.8 1
U1 U2 U3 U4 U5 U6 All
Result(b) ‐ detection of normal days
0 0.2 0.4 0.6 0.8 1
U1 U2 U3 U4 U5 U6 All
[image:6.612.97.300.262.618.2]Result(c) ‐ total detection accuracy
Figure 6. Evaluation of Circadian Rhythm Detection using Sleep-based Activity Data
Even though a globally optimized set of weight parameters (i.e., icost, dcost, and scost in Figure 2) existed in the case of using
step-based activity data, we could not find a globally optimized set of weight parameters (i.e.,
weight coefficients for bedtime, sleep length, and sleep quality variables) in the case of using sleep-based activity data. One of possible reasons, for example, some users were sensitive to a change of bed time in feeling their rhythm broken, whereas others were insensitive to it but sensitive to a change of sleep length. Note that all the performances “after optimization” in Figure 6 were results that distance measures with individually optimized weights produced.
4.2.2 Parameter Optimization
To optimize the three weight parameters used in the Levenshtein distance algorithm (i.e., icost, dcost, and scost in the line number 8 of Figure
[image:6.612.316.519.376.495.2]2), we simulated various parameter settings by incrementally changing each cost of insertion, deletion, and substitution from 1 to 10; that is, there were 1000 iterated simulation rounds (=10×10×10). For each parameter combination, we tested our detection method for all the six subjects, and computed the average accuracy from the six evaluated outcomes in every simulation round.
Figure 7. Detection Accuracy for Each Different Parameter Setting (Sorted by Average Accuracy)
4364 abnormal day detection was about 47% (from 0.83 to 0.44), which indicates that the detection accuracy for abnormal days can be more significantly improved by optimization.
From the 1000 simulation rounds, we found nine parameter settings (5:4:8, 6:5:9, 7:1:3, 8:1:2, 9:1:2, 9:1:3, 9:2:4, 10:1:2, and 10:2:4) that maximized the detection accuracy. The median proportion was approximately 7:1:3. This provides an important insight that users’ circadian rhythms tend to be strongly affected by an event unusually inserted into their schedule (i.e., about seven times more sensitive than when an event is deleted from their schedule); that is, in other words, users might feel a day is very unusual or irregular by some unexpectedly occurred events.
5. RELATED WORK
In this section, we present the existing studies related to our study. We surveyed two categories of studies: one category is studies about anomaly detection methods and the other one is about relevant healthcare-ICT studies.
5.1 Anomaly Detection Methods
In general, there are three representative existing techniques to detect anomaly patterns in data. They are model-based technique, Proximity-based technique, and Density-Proximity-based technique [3].
Model-based technique: it builds a model of the data (e.g., Gaussian distribution, regression analysis). In the technique, anomalies are objects that do not fit the model very well. This technique has disadvantages in some cases because the statistical distribution of the data is unknown or no training data to build a model is available.
Proximity-based technique: it defines a proximity measure between objects. Anomalous objects are those that are distant from most of the other ones.
Density-based techniques: it computes estimates of the density of objects if a proximity is measurable. Objects that are in regions of low density are relatively distant from their neighbors and considered anomalous.
Anomaly detection has a long history, particularly in statistics, where it is also known as outlier detection. Relevant books on the topic are those of Barnett and Lewis [4], Hawkins [5], and Rousseeuw and Leroy [6]
5.2 Healthcare-ICT Studies
In the literature, there have been many studies that used wearable and mobile devices to
effectively measure and diagnose health state or life rhythms.
The study [7] presents two stages of a rank-order based algorithm that automatically distinguish between activity and rest periods with utilizing the signal data collected by actigraphy. The algorithm processes regions of consecutive zero signals corresponding to invalid data using a combined activity/rest probability model. Even though the algorithm can detect ether ‘activity’ or ‘rest’ period, it cannot be used for measuring irregularity of the signals.
The study [8] examines and classifies the behavior pattern of the elderly and presents their monitoring methods in three representative approaches based on (1) video-based analysis, (2) acoustic and ambience sensor, and (3) kinematic sensor. The first focuses on computer vision and video analytics based technologies. This technology has the disadvantage that the camera should be fixed at a certain position in the usual place, it is rather expensive, and it can be used only indoors. This is because a camera network and a computer dedicated to data processing are required. Second, since vibration and sound sensor data are used to detect the vibration, the use environment is restricted to the room and the noise received from the sensor may deteriorate, which is not effective in a normal residential environment. A third approach is to use an accelerometer or gyroscope. Since the signal is captured from the sensor worn on the body of the subject, there is an advantage that it can be freely applied indoors and outdoors.
The authors in the study [7] developed an armband device to measure skin temperature, light, and activity across days to detect internal circadian rhythms. They performed curve-fitting with sum of sine functions from sensor data daily collected by the armband device and investigated a state of phase-alignment of the fitted rhythm curve. If any misalignment of the rhythm curve is found, it was interpreted as anomalies. Extracting curves fitted from sensor data is a good idea to find a circadian rhythm. However, at least 48 hours of continuous sensor data are costly required to extract a circadian curve, and outcome of the curve fitting method can be sometimes unreliable if the input data is incomplete or has many noises. Prediction accuracy of the circadian rhythm phase was not studied in [7] and remained a future work.
4365 postures over time periods with Dynamic Bayesian Networks and Hidden Markov Model. The recognition of action “going to bed” and “wake up” helps estimating begin and end of the period of a circadian rhythm. Detection rate of deviations from the reference circadian rhythm varied depending on tested days from 80% to 90%. One disadvantage, machine learning approaches require sufficient training data that is unfortunately not available at the early phase of system building.
Periodicity detection from user lifelogs is particularly challenging because the lifelog data itself is not always continuous and it can have missing logs as users may use lifelogging devices intermittingly. The authors in the study [11] presented a method for periodicity detection in lifelog data with missing and irregularly sampled data.
The study [12] proposed two statistical methods, root mean square of successive RR difference (RMSSD) and Shannon entropy (ShE) to detect atrial fibrillation (AF). RR is an interval between peak points in electrocardiogram data. RMSSD is expected to be higher in a segment recorded from a patient with an irregular pulse. ShE quantifies the likelihood that runs of patterns exhibiting regularity over some duration of data. ShE is therefore expected to be higher when patients have pulses that exhibit greater RR interval irregularity. Measuring variability of RMSSD and ShE might be a good indication to test whether circadian rhythm is regular or not. However, these measures cannot explain some influential events causing irregularity of the circadian rhythm.
The study [13] presents two approaches for detecting anomalies in track data of user activity. One is to predict temporal variations in behavior (i.e., rhythm of life) and the other one is the bulk behavior of targets. Although tracks on individuals may not be unusual, their combined group actions can be suspicious.
6. CONCLUSION
In this paper, we proposed a method to define circadian rhythm of user's daily cycle using smart bands and to detect rhythm patterns of normal and abnormal days. To verify the proposed method, the detection results were compared with actual user opinions. In our user study, the proposed method detected normal or abnormal patterns of life rhythm with 86% accuracy when using step-based activity data.
To our knowledge, few studies have been conducted to encode circadian rhythm patterns, measure a distance between the rhythm patterns,
and detect their abnormalities with smart bands. If using our proposed method, it is easy to grasp the trend of change of rhythm patterns because it calculates numerical distance how different a day is from the other days in the activity amount of viewpoint. In addition, the method provides the ability to evaluate impact on insertion, deletion, and substitution of some daily events that can affect change of daily regular rhythms.
When detecting abnormal events, perhaps, a statistical approach can be used to find upper and lower boundary thresholds of a certain level of standard deviation and decide that outliers observed beyond the boundary are abnormal ones. However, we did not use such the approach because it cannot model circadian rhythm patterns dynamically changed by some unexpectedly inserted events or some suddenly deleted/substituted events.
7. LIMITATIONS AND FUTURE WORK There are some limitations in our study depending on applied subjects or conditions as follows.
Factors that feel fatigue or an unusual day can be different from person to person. If there was a sudden change in terms of daily activity, mostly rhythms would be broken, but there would be insensitive people. For example, people may feel that it was a helpless feeling or a hard day, not as a variation in physical activity, but as an unusual event or a psychologically exceptional event (esp., a bad thing). Thus, a mental state change is difficult to capture with our activity-based method.
As the number of days with anomalous activity patterns increases in daily life, and the accumulation of such days can be felt to be not so new by the learning effect later on. Therefore, the interpretation power of the difference of the activity pattern distance with other days becomes weak, and possibly the rhythm change prediction may become inaccurate. Therefore, as the number of anomalous days increases, the applied weighting may be adjusted so that the distance difference of the activity pattern becomes more sensitive.
4366 prevention of user's mistake and convenience in the future study.
Lastly, our proposed method needs to be more thoroughly compared with other alternatives in the future study especially in terms of performance and cost aspects. Our method is easy and cheap to adopt in the aspect of cost with reasonable performance. However, if a more accurate modeling approach is necessary depending on the application requirement, perhaps, any other sophisticated alternative should be considered with combining more multiple sensor data.
ACKNOWLEDGEMENTS:
The corresponding author of this paper is Hoh Peter In (hoh_in@korea.ac.kr), and we declare that this paper is an improved version of our preliminary study [14] that had been previously introduced in a conference. This research was supported by a grant of the Korea Health Technology R&D Project through the Korea Health Industry Development Institute (KHIDI), funded by the Ministry of Health & Welfare, Republic of Korea (grant number : HI14C3212).
REFRENCES:
[1] H. J. Lee, G. H. Son, and D. Geum, “Circadian rhythm hypotheses of mixed features, antidepressant treatment resistance, and manic switching in bipolar disorder,” Psychiatry Investigation, vol.10, no.3, pp.225–232, Sept. 2013.
[2] V. I. Levenshtein, “Binary codes capable of correcting deletions, insertions, and reversals,” Soviet Physics Doklady, vol.10, no.8, pp.707– 710, Feb. 1966.
[3] P. N. Tan, M. Steinbach, and V. Kumar, “Introduction to data mining,” Addison-Wesley, 2006.
[4] V. Barnett and T. Lewis, “Outliers in Statistical Data”, Wiley Series in Probability and Statistics. John Wiley & Sons, 3rd edition, April 1994.
[5] D. M. Hawkins. “Identification of Outliers”, Monographs on Applied Probability and Statistics. Chpman & Hall, May 1980.
[6] P. J. Rousseeuw and A. M. Leroy, “Robust Regression and Outlier Detection”, Wiley Series in Probability and Statistics. Jon Wiley & Sons, September 2003.
[7] Cristina Crespo, Mateo Aboy, José Ramón Fernández, and Artemio Mojón, “Automatic identification of activity–rest periods based on actigraphy”, Medical & Biological Engineering & Computing, April 2012, Volume 50, Issue 4, pp 329-340
[8] Hijaz F., Afzal N., Ahmad T., and Hasan O., “Survey of fall detection and daily activity monitoring techniques”, Information and Emerging Technologies (ICIET), 2010 International Conference on, 14-16 June 2010 [9] B. L. Smarr, D. C. Burnett, S. M. Mesri, K. S. J.
Pister, and L. J. Kriegsfeld, “A Wearable Sensor System with Circadian Rhythm Stability Estimation for Prototyping Biomedical Studies,” IEEE Trans. Affect. Comput., vol. 7, no. 3, pp. 220–230, 2016. [10] Andrea Caroppo, Giovanni Diraco, Gabriele
Rescio, Alessandro Leone, and Pietro Siciliano, “Heterogeneous Sensor Platform for Circadian Rhythm Analysis,” Advances in Sensors and Interfaces (IWASI), 2015 6th IEEE International Workshop on, pp. 187–192, 2015.
[11] F. Hu, A. F. Smeaton, and E. Newman, “Periodicity detection in lifelog data with missing and irregularly sampled data,” Proc. - 2014 IEEE Int. Conf. Bioinforma. Biomed. IEEE BIBM 2014, pp. 16–23, 2014.
[12] D. D. McManus, J. Lee, O. Maitas, N. Esa, R. Pidikiti, A. Carlucci, J. Harrington, E. Mick, and K. H. Chon, “A novel application for the detection of an irregular pulse using an iPhone 4S in patients with atrial fibrillation,” Hear. Rhythm, vol. 10, no. 3, pp. 315–319, 2013. [13] R. O. Lane and K. D. Copsey, “Track Anomaly
Detection with Rhythm of Life and Bulk Activity Modeling,” 15th Int. Conf. Inf. Fusion, pp. 24–31, 2012.