5296
MEASURING SMARTPHONE USAGE TIME IS NOT
SUFFICIENT TO PREDICT SMARTPHONE ADDICTION
1MYOUNGHEESHIN, 2KANGWOO LEE
1Department of Herb Science, Dong-Eui Institute of Technology, Busan, Korea
2School of Information and Communication Engineering, Sungkyunkwan University, Suwon, Korea
E-mail: 1[email protected], 2[email protected]
ABSTRACT
Usage time is a major criterion to determine whether a user is addicted to their smartphone, and many smartphone apps aiming to decrease smartphone addiction have been developed with this criterion in mind. However, this rule of thumb is based on an incorrect assumption that develops from studies on internet addiction. Our study tests how applicable this rule truly is, through correlation and discriminant analysis on smartphone usage patterns. Using a self-diagnosis scale for smartphone addiction (S scale for short) and smartphone usage tracker, we collected S scale scores and smartphone usage patterns from 195 undergraduate participants. The statistical results indicate that 1) smartphone addiction is highly correlated with communication but not entertainment and 2) solely measuring the total usage time is not enough to predict whether a smartphone user is addicted. Our results imply that additional measures to capture richer information on smartphone-related activities are necessary for developing anti-addiction apps.
Keywords: Smartphone addiction, Smartphone usage time, Smartphone usage pattern, Fisher’s linear
discriminant analysis, Communication
1. INTRODUCTION
Technology overtakes our daily lives if we lose our control over it. Many people get anxious if they cannot use their phone, even if only for a few minutes. In Korea, it is reported that 16.2% of total smartphone users are addicts; this number is rapidly increasing, even as the number of internet addicts is declining [1]. Often, it is treated the same as internet addiction and considered to be caused by “over-involvement with a game” [2],[3]. Even though smartphone addiction has become a major threat to our mental health, little progress has been made in understanding this addiction.
Smartphone addiction is generally understood as a dependence syndrome that shows various problematic behaviors or clinical disorders in daily life [4]. It comprises of a wide spectrum of problematic behaviors that ranges from excessive texting [5] to social isolation [6] or social anxiety [7]. That is, it has many facets of problematic behaviors not only at the personal and social levels but also those at the levels of technology dependency [4] and clinical disorders [8]. On the basis of these conceptualizations and perspectives, smartphone addiction scales have been developed to measure problematic behaviors and psychological
attitudes associated with technology dependency and its clinical consequence.
It seems that there are clearly distinctive approaches in the measurement of smartphone addiction – questionnaire-based scale [9] and smartphone app tracker [10]. A smartphone addiction questionnaire is generally designed to measure daily life disturbance, withdrawal,
tolerance, and virtual world orientation
characteristics as main factors of the smartphone addiction diagnostic scale [11]. Meanwhile, anti-smartphone addiction apps incorporate tracking features such as the total amount of data consumption or usage time [12]. Those apps track a user’s usage of a device and allow him/her to set daily limits; the app notifies the user if the device is overused.
Most studies on smartphone addiction
5297 quantifies the amounts of smartphone usage and easily obtains the statistics of the smartphone usage patterns, the studies based on the app trackers simply show a general tendency of smartphone usage patterns. These two methodological approaches are independently used in their academic areas. It is not clearly understood how the surveys’ measure of smartphone addiction is related to smartphone usage.
A few researchers have attempted to analyze smartphone addiction in terms of smartphone usage—data they obtained from log files—and establish a relationship between smartphone inventory and usage behaviors [16],[17]. However, these experiments had an extremely small sample size [16] and focused on uncovering a correlative relationship, not classification or regression.
Based on the issues raised above, this paper investigates smartphone addiction with regards to smartphone usage patterns obtained from real smartphone users via a smartphone usage tracker app. This study aims to discover the relationship between smartphone addiction diagnostic scale (S scale) and smartphone usage patterns, to characterize smartphone addiction in terms of categorical usage patterns of smartphone, and to discriminate smartphone addicts from non-addicts using Fisher’s linear discriminant analysis.
2. METHODS
2.1 Participants
A total of 195 undergraduate and graduate students participated in the experiment. Participants were aged from 18 years to 30 years. 124 participants were males and remaining 71 were females. The participants were recruited through the web posting services of the university where the authors belong to. Only participants who owned an Android smartphone were selected, since the smartphone application we used to collect usage patterns only works on the Android platform. Participants were paid 10,000 Korean won (approximately 9.5 USD) upon completion of the smartphone usage data collection and subsequent survey. All participants provided written informed consent prior to the study.
2.2 Apparatus
2.2.1 Smartphone usage tracker
A smartphone app called “Smartphone Usage Tracker” was used to collect users’ smartphone usage patterns [18]. It is a free app that can be obtained in Google Play. This app monitors the usage time of each individual app and averages
them to get total usage time per day. It can graphically show how much time is spent on your smartphone and can also allow users to send the averaged usage data through e-mail.
2.2.2 Smartphone addiction self-diagnosis
scale
We used a modified version of smartphone addiction self-diagnosis scale (called “S scale”), originally developed by the National Information Society Agency [19], to measure smartphone addiction. This scale divides users into three groups—highly risky users (addicted users in this study), tentatively risky users (risky users in this study) and normal users—on the basis of their
measured score. The scale is composed of 15
questions that are classified into 4 sub-categories: disturbance of adaptive functions, virtual life orientation, withdrawal, and tolerance. Each question is rated according to a 4-point scale. For instance, some examples of the questions in the sub-categories are given below:
Disturbance of adaptive functions: My school
grades (or work productivity) dropped due to excessive internet use.
Virtual life orientation: Using a smartphone is
more enjoyable than spending time with family or friends.
Withdrawal: I get restless and nervous when I
am without a smartphone.
Tolerance: Spending a lot of time on my
smartphone has become a habit.
2.3 Procedure
The experiment was composed of two procedure steps. First, participants were asked to install the smartphone usage tracker app on their phone. They were instructed not to delete this application for at least 15 days and to send their average smartphone usage patterns to a researcher via e-mail. Second, after a few days, the participants were asked to fill out the S scale survey. A series of statistical analyses were carried out on the data collected using both smartphone usage patterns and the S scale.
3. RESULTS
5298 utilizing only the patterns of smartphone usage.
3.1 S Scale Scores of 3 Groups – Normal, Risky
and Addicted
The S scale scores of participants were collected using S scale questionnaires composed of 15 questions. The result of the score is presented in Table 1. The participants were divided into 3 groups – normal, risky and addicted groups. The lower 67.7% of the participants, whose S scale scores ranged from 6 to 29, is classified into the normal groups, the 18.5% of participants, whose S scale scores ranged from 29 to 33, placed between the normal and addicted groups is classified into the risky groups, and the higher 13.8% of the participants, whose S scale scores ranged from 34 to 44, is assigned to the addicted group. The mean of S score for the normal group is 22.56 (SD = 5.05), the mean of S score for the risky group is 31.13 (SD = 1.19) and the mean of S score for the addicted group is 36.87 (SD = 2.70).
This grouping is a little bit arbitrary. Since the smartphone addiction is measured along the S scales score, it is hard to say there is a clear cut between normal and addicted groups. We simply considered the upper 18.5% of participants as smartphone addicts and remaining 81.5 % of participants is considered as either normal or risky group.
Table 1: The means of S Scale Score for 3 participant groups – Normal, Risky and Addicted Groups – placed with Their Number of Cases, Proportions, Means and
Standard Deviations (SD)
Group N Proportion Mean SD Normal 132 67.7% 22.56 5.05
Risky 36 18.5% 31.13 1.19 Addicted 27 13.8% 36.87 2.70
3.2 Smartphone Application Usage Pattern
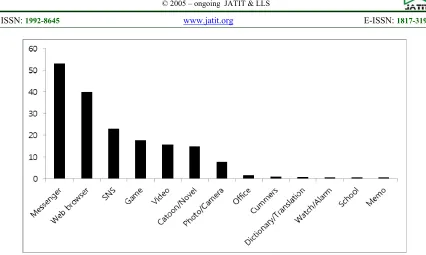
Fig. 1 presents a histogram of the most-used 13 apps, compiled using the collected smartphone usage data through the smartphone usage tracker app. The mean of smartphone app usage time is 182.06 minutes per day. The figure places messenger (52.98 min), web browsers (40.01 min), SNS (22.91 min), games (17.78 min), video (15.88 min), and web toon/web novel (14.85 min) in descending order from left to right.
Actually, the participants reported that they installed much more apps than those daily used in their smartphone. That is, a few of installed apps are dominantly used. As shown in Figure 1, the participants spend most of their time to use a
messenger, web browser, SNS and smartphone game.
[Figure 1 should be here]
3.3 Correlation between S Scale Score and
Smartphone App Usage
In order to investigate the relationship between S scale score and smartphone app usage time, we carried out the correlation between them. Table 2 presents the correlation coefficients and their significance levels between S scale scores and smartphone app usage time for each app. We found that the S scale score correlates with total usage
time of a device (ρ= .287, p < .001), and time spent
using web browsers (ρ= .278, p < .001), messenger
apps (ρ=.172, p < .05), and SNS apps (ρ =.156, p
< .05), but is not correlated with time spent using
game (ρ= .013, P = .858) and video apps (ρ
[image:3.612.331.502.370.610.2]= .033, P = .654).
Table 2: The Correlation Coefficients and Significance Levels between S scale score and Smartphone Usage
Time for Participants’ Smartphone Apps.
Apps Coefficient (ρ) Significance level
Total .287 .000 Web Brower .278 .000 Messenger .172 .017
SNS .156 .031
Storage .116 .108 Photo/camera .111 .124 Dictionary .103 .155
Memo .103 .157
Calculator .089 .222 Commerce .075 .304 Account .066 .362 Mail .065 .369 Downloader .060 .410 Cartoon/Novel .046 .523 Video .033 .654 Game .013 .858
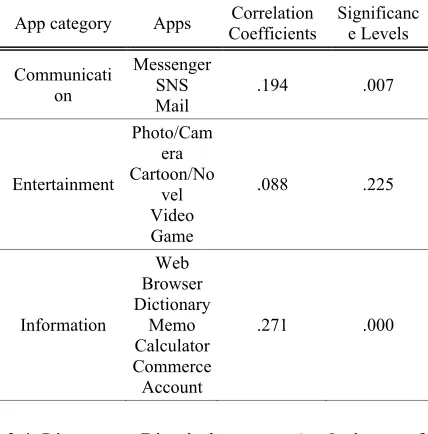
[image:3.612.84.304.483.542.2]5299 browser, dictionary, memo, calculator, commerce, account are grouped into the information category. This analysis was performed to figure out which smartphone activity is associated with smartphone addiction. The result of the correlation analysis is given in Table 3. We found that the S scale score is correlated with communication (ρ= .194, p < .01)
and information (ρ = .271, p < .001), but not
[image:4.612.87.301.255.472.2]entertainment (ρ= .088, p = .225).
Table 3: Correlation between S scale score and Smartphone Apps Categorical Usage Time. The Correlation Coefficient and Significance Level Are
Placed along with Its App Category.
App category Apps Coefficients Correlation Significance Levels
Communicati on
Messenger SNS
Mail .194 .007
Entertainment
Photo/Cam era Cartoon/No
vel Video Game
.088 .225
Information
Web Browser Dictionary
Memo Calculator Commerce Account
.271 .000
3.4 Linear Discriminant Analysis of
Smartphone Addiction Using Smartphone Usage Patterns
To test whether a participant can be properly classified into a normal or addicted user using smartphone usage patterns, a linear discriminant analysis was carried out. For this purpose, we firstly divided the participants into two groups — normal and addicted, and the risky group was discarded. This was done to make the groups be more distinctive. So, according to the S scale score, lower 132 participants were assigned to the normal group and the upper 27 participants were assigned to the addicted group. In some sense, it is assumed that the S scale value is the ground truth, and thus a statistical model is required to accurately
classify smartphone usage patterns into
corresponding classes.
With the factors corresponding to the 10 largest eigenvalues obtained from factor analysis, we performed Fisher’s linear discriminant analysis [20] on the smartphone usage patterns. This method is commonly used in statistics and pattern
recognition to find a linear combination of features that characterizes or separates two or more classes of object. The classification result from the linear discriminant analysis with 10 factors is compared with that from the linear discriminant analysis with the total amount of usage time only.
Table 4 presents the comparative results. It is not surprising that the Fisher’s linear discriminant analysis with 10 factors (79.9% correct response) outperformed that with only total smartphone usage time (66.0% correct response). However, it should be noted that the analysis showed the normal group has a higher correct response rate (84.8%) than those (55.6%) from the addicted group (Fig. 2) in the linear discriminant analysis with 10 factors. In contrast, 12 of 27 (44.4%) smartphone addicts are misclassified to the normal group. Only 15 of 27 (55.6%) smartphone addicts are correctly classified into the addicted group. The gray bar in Fig. 2 indicates the correct classification, but the black bar indicates the incorrect classification. In comparison of Fisher’s linear discriminant analysis with 10 factors, the classification performance of the analysis with the total usage time only is clearly worse. That is, 68.9% of normal participant is correctly classified whereas 31.1 % of normal participants is incorrectly classified. For smartphone addicted group, 48.1% of addicted participants is classified into the normal. Only 51.9% of addicted participants is correctly classified.
[Figure 2 and Table 4 should be here]
4. DISCUSSION
Our research in this paper focuses on how to characterize smartphone addiction in terms of smartphone usage pattern and what factors differentiate smartphone addicts and non-addicts. Also, our research attempted to show the relation between the survey-based score and the smartphone usage pattern. The experimental results raised some important issues that are worth to discuss here.
4.1 Smartphone Addiction is Communicatively
Addicted
5300 noted that increased smartphone usage does not necessarily enhance relationships with family members or friends. On the contrary, smartphone addiction can negatively impact communication skills [23]; it may actually cause a breakdown in communication, as users spread their attention to many people in different social networks at the same time. Communication thus becomes shallow and never concentrated [24], [25].
Unlike internet addiction, which is understood to be an addiction to gaming [26],[27], smartphone addiction does not show any statistically significant correlation with the usage time on game apps. This is due to smartphones’ function as a communication device. People daily use their phone to communicate with their friends and family. When it comes to entertainment, the device’s small display and keyboard make it not ideal for gaming. Moreover, its multimedia processing and memory size limits its usability and engagement. A recent study of elementary students in South Korea showed similar results and indicates that SNS usage is a stronger predictor of smartphone addiction than game usage [28].
4.2 Does Total Usage Time Sufficiently Explain
Smartphone Addiction?
The engineering approach to smartphone addiction seems based in the belief that smartphone addiction and smartphone usage time are tightly coupled. This approach conceptualizes smartphone addiction as an excessive use of smartphones that interferes with users’ daily lives. So, a smartphone user can be considered as an addict if his/her usage time exceeds a predefined usage time amount. Accordingly, recent research shows that the overuse of smartphones can be used to model smartphone addiction, to develop smartphone addiction inventories, and to discover the influential factors of smartphone addiction [12],[13],[14]. Most anti-smartphone addiction apps, therefore, monitor how much time a user spends on his/her smartphone and allows the user to set daily time limits.
Our study, however, demonstrates that this strategy is not good enough to predict whether a user is addicted. The classification accuracy of discriminant analysis using only total smartphone usage time was 66.0%, but 10 factors improved the accuracy to 79.9% (Table 4). This means that smartphone application usage patterns need to be considered as well as total usage times. Some apps significantly influence smartphone addiction, while others do not.
Even though the correct classification rate for the normal group significantly improved, when
the smartphone applications usage patterns were used, the addicted group classification still remained poor. As shown in Fig. 2, only 55.6% of smartphone addicts were correctly classified. One possibility for this misclassification is that the usage time does not capture psychopathological symptoms, such as compulsive smartphone usage or interpersonal conflict. This implies that measuring smartphone usage time alone is not sufficient to predict smartphone addiction. It would be necessary to measure more variables that captures rich phenomenon of smartphone addiction. For instance, smartphone addiction is more likely to correlate with the frequency of smartphone usage (daily use count) or repetitive login than the duration of use (daily time spent on the smartphone) [16], [17]. Therefore, additional measures such as number of screen touches, repetitive logins, etc. would better reflect the compulsive behaviors. A further study with these measures will shed some light on smartphone addiction.
4.3 Is The S Scale Score Precise Enough for
Ground Truth?
Throughout our statistical analysis, it is assumed that the S scale score is considered as the ground truth that independent variables should be mapped to. This means that the S score is accurate enough for the classification of the smartphone usage patterns (training data set), and thus is used for a criterion in decision making of whether a statistical model correctly classifies an input pattern or not [29], [30],[31].
However, as implied by the term ‘self-diagnosis’, the S score is based on the subjective evaluation on smartphone addiction. So, it is possible for our participants to over-estimate or under-estimate their smartphone addiction. It seems that some participants are likely to under-estimate their addictivity of smartphone in the S scale survey, even though their smartphone usage patterns clearly indicated that they overuse their smartphone.
5301
5. CONCLUSION
In summary, we explored the smartphone addiction under the relationship between the S scale score and smartphone usage patterns. Our research efforts attempted to reveal what features of smartphone usage patterns is associated with smartphone addiction and how smartphone addiction can be characterized in terms of smartphone usage patterns. Our research effort also extends to establish a linear discriminant analysis model to map the smartphone usage patterns to the normal or addicted groups.
This study provides an interesting insight into the relation between a survey-based approach and a device-based approach on the smartphone addiction. We try to reveal the discrepancies between these two approaches. Even though the smartphone usage pattern is more accurate, it is limited in representing the multifacet nature of smartphone addiction. On the other hand, the
credibility of the self-diagnosed survey would be
speculated because of its subjective nature. Nonetheless, our current methodology is limited in the variety of smartphone activity variables and the collection duration of participants’ activities. These limitations may fail to show richer smartphone addictive behaviors and more stably converging usage patterns. For a future study, our research work will be dedicated to employing more smartphone activity patterns and the latent constructs that underlies smartphone-addictive behaviors and their clinical effects with sufficiently long data collection duration. It is also hoped that our research will contribute to help people who suffers from this technology-abused syndrome.
6. ACKNOWLEDGMENTS
This research was supported by Basic Science Research Program through the National Research Foundation of Korea (NRF) and funded
by the Ministry of Education
(2016R1A6A3A11933734).
REFRENCES:
[1] The Korean National Information Society Agency, “The survey on Internet Addiction 2011”. Seoul, South Korea: The Korean Ministry of Public Administration, 2012. [2] Kuss, D. J. and Griffiths, M. D., “Internet
Gaming Addiction: A systematic Review of
Empirical Research”, International Journal of
Mental Health and Addiction, Vol. 10, No. 2,
2012, pp. 278-296.
[3] Billieux, J., Maurage, P., Lopez-Fernandez, O., Kuss, D. J. and Griffiths, M. D., “Can Disordered Mobile Phone Use Be Considered a Behavioral Addiction? An Update on Current Evidence and a Comprehensive Model for
Future Research”, Current Addiction Reports,
Vol. 2, No. 2, 2015, pp. 156-162.
[4] Lin, T. C. and Chiang, Y-H., “Investigating predictors of smartphone dependency symptoms and effects on academic performance, improper
phone use and perceived sociability”,
International Journal of Mobile
Communications,
http://www.trishalin.com/uploads/1/3/4/8/13481 349/2_ijmc_lin___chiang_smartphone.pdf. Accessed: 2017.5.20.
[5] Goswami, V. and Singh, D. R., “Impact of mobile phone addiction on adolescent’s life: A
literature review”, International Journal of
Home Science, Vol. 2, 2016, pp. 69-74.
[6] Bian, M. and Leung, L., “Linking loneliness, shyness, smartphone addiction symptoms, and patterns of smartphone use to social capital”,
Social Science Computer Review, Vol. 33, No. 1,
2014, pp.61–79.
[7] Enez Darcin, A., Kose, S., Noyan, C. O., Nurmedov, S., Yılmaz, O., and Dilbaz, N., “Smartphone addiction and its relationship with social anxiety and loneliness”, Behaviour & Information Technology, Vol. 35, No. 7, 2016, pp.520-525.
[8] Kormendi, A., Brutoczki, Z., Vegh, B. P., and Szekely, R., “Smartphone use can be addictive?
A case report”, Journal of Behavioral
Addictions, Vol. 5, No. 3, 2016, pp.548–552
[9] Kwon, M., Kim, D.-J., Cho, H., and Yang, S., “The smartphone addiction scale: development and validation of a short version for adolescent”,
PloS one, Vol. 8, No. 12,2013, e83558.
[10] Lee, U., Lee, J., Ko, M., Lee, C., Kim, Y., Yang, S., Yatani, K., Gweon, G., Chung, K.-M., and Song, J., “Hooked on smartphones: An exploratory study on smartphone overuse among
college students”, Proceedings of the 32nd
Annual ACM Conference on Human Factors in
Computing Systems, CHI ’14, ACM (NY, USA),
April 26-May 1, 2014, pp.2327–2336.
[11] Kim, D., Lee, Y., Lee, J., Nam, J. K., and
Chung, Y., “Development of Korean
smartphone addiction proneness scale for
youth”, PLoS One, Vol. 9, No. 5, 2014,
e97920.
[11] Tosell, C., Kortum, P., Shepard, C., Rahmati, A. and Zhong, L., “Exploring smartphone addiction: insights from long-term telemetric
5302
Interactive Mobile Technologies, Vol. 9, No. 2,
2015, pp.37–43.
[12] Ko, M., Lee, J., Yang, S. and Lee, U., “An Analysis of Mobile Apps for Intervening Excessive Smartphone Usage: Intervention
Method Perspectives”, HCI Society of Korea,
2014, pp. 747-750.
[13] Gökçearslana, S., Mumcub, F. K., Haşlamanc, T. and Çevikd, Y. D., “Modelling smartphone addiction: The role of smartphone usage,
self-regulation, general self-efficacy and
cyberloafing in university students”,
Computers in Human Behavior, Vol. 63, 2016,
pp. 639-649.
[14] Pavia, L., Cavani, P., Blasi, M. D. and Giordano, C., “Smartphone Addiction Inventory
(SPAI): Psychometric properties and
confirmatory factor analysis”, Computers in
Human Behavior, Vol. 63, 2016, pp. 170–178.
[15] Aljomaa, S. S., Qudah, M. F. A., Albursan, I. S., Bakhiet, S. F. and Abduljabbar, A. S., “Smartphone addiction among university students in the light of some variables”,
Computers in Human Behavior, Vol. 61, 2016,
pp. 155-164.
[16] Lee, H., Ahn, H., Choi, S. and Choi, W., “The SAMS: Smartphone Addiction Management
System and Verification”, Journal of Medical
Systesm., 2014, Vol 38:1. doi:
10.1007/s10916-013-0001-1
[17] Lin, Y. –H., Lin, Y. -C., Lee, Y. -H., Lin, P. – H., Lin, S. –H., Chang, L. -R., Tseng, H. -W., Yen, L. –Y., Yang, C. C. H. and Kuo, T. B. J., “Time distortion associated with smartphone addiction: Identifying smartphone addiction via
a mobile application (App)”, Journal of
Psychiatric Research, Vol. 65, 2015, pp.
139-145.
[18] Agrawal, V. App Usage Tracker (Version 5.0) [Mobile application software]. Retrieved from https://play.google.com/store/apps/details?id=co m.agrvaibhav.AppUsageTracking&hl=ko, 2016 [19] Shin, K. W., Kim, D. I. and Jung, Y. J.,
“Development of Korean Smart Phone Addiction Proneness Scale for Youth and
Adults”, Korean National Information Society
Agency Press, Seoul, 2011, pp. 42-53.
[20] Martinez, A. M. and Kak, A. C., “PCA versus
LDA” IEEE Transactions on Pattern Analysis
and Machine Intelligence. Vol. 23, No. 2, 2001,
pp.228–233.
[21] Elhai, J. D., Levine, J. C., Dvorak, R. D. and Hall, B. J., “Fear of missing out, need for touch, anxiety and depression are related to
problematic smartphone use”, Computers in
Human Behavior, Vol. 63, 2016, pp. 509-516.
[22] Salehan, M. and Negahban, A., “Social networking on smartphones: When mobile
phones become addictive”, Computers in
Human Behavior, Vol. 29, 2013, pp.
2632-2639.
[23] Kim, J. –H., “Smartphone-mediated
communication vs. face-to-face interaction: Two routes to social support and problematic
use of smartphone”, Computers in Human
Behavior, Vol. 67, 2017, pp. 282-291.
[24] Bian, M., and Leung, L., “Linking loneliness, shyness, smartphone addiction symptoms, and patterns of smartphone use to social capital”,
Social Science Computer Review, Vol. 33, No. 1,
2014, pp. 61–79.
[25] Drago, E., “The effect of technology on
face-to-face communication”, Elon Journal of
Undergraduate Research in Communications,
Vol.6, No. 1, 2016, pp.13-19.
[26] Kuss, D. J., “Internet gaming addiction: current
perspectives”, Journal of Psychology Research
& Behavior Management, Vol. 6, 2013, pp.125–
137.
[27] Weinstein, A., and Lejoyeux, M., “Internet
addiction or excessive Internet use”, American
Journal of Drug & Alcohol Abuse, Vol. 36,
2010, pp. 277–283.
[28] Jeong, S. –H., Kim, H. J., Yum J. –Y. and Hwang, Y., “What type of content are smartphone users addicted to?: SNS vs. games”,
Computers in Human Behavior, Vol. 54, 2016,
pp. 10-17.
[29] Carlotto, J. M., “Effect of Errors in Ground
Truth on Classification Accuracy”,
International Journal of Remote Sensing, Vol.
30, No. 18, 2009, pp.4831–4849.
[28] Sikdar, S. K., Kang, B., O'Donovan, J., Hollerer, J. and Adal, S., “Cutting through the noise: Defining ground truth in information credibility
on twitter”, HUMAN, Vol. 2, 2013, pp. 151-167.
[30] Yannakakis, G. N. and Martinez, H. P. “Ratings
are overrated!”, Frontiers in ICT , Vol. 2, No.13
file:///C:/Users/lee/Downloads/fict-02-00013%20(1).pdf
[31 ] Steinfeld, A., Quinones, P.-A., Zimmerman, J., Bennett, S. R., and Siewiorek, D., “Survey Measures for Evaluation of Cognitive
Assistants”, Proceeding NIST Performance
Metrics for intelligent Systems Workshop, 2007,
5303
[image:8.612.90.516.58.313.2]
Figure 1: Daily usage Time of Smartphone Applications
Table 4: Classification Results Obtained from Fisher’s Linear Discriminant Analysis
factor S scale
predicted
normal predicted addicted total classification accuracy
N % N % N % %
10 factors normal 112 84.8 20 15.2 132 100.0 79.9 addicted 12 44.4 15 55.6 27 100.0
Total smartphone
usage time
normal 91 68.9 41 31.1 132 100.0
66.0 addicted 13 48.1 14 51.9 27 100.0
[image:8.612.95.519.373.694.2]1) 10 factors 2) Total usage time factor only