5443
A RE-CONSTRUCTIVE ALGORITHM TO IMPROVE IMAGE
RECOVERY IN COMPRESSED SENSING
1R.JAYA LAKSHMI, 2DR.G.V.SUBBA RAO
1 Department of ECE, KL University, Vaddeswaram, Guntur ,A.P,India. 2 Department of ECE, KL University, Vaddeswaram, Guntur, ,A.P,India
ABSTRACT
In this paper, we study the Compressed Sensing (CS) image recovery problem. The traditional method divides the image into blocks and treats each block as an independent sub-CS recovery task. This often results in losing global structure of an image. In order to improve the CS recovery result, we propose a nonlocal estimation step after the initial CS recovery for de-noising purpose. The nonlocal estimation is based on the well-known nonlocal means (NL) filtering that takes advantage of self-similarity in images. We formulate the nonlocal estimation as the low-rank matrix approximation problem where the low-rank matrix is formed by the nonlocal similarity patches. An efficient algorithm, Extended NonLocal Douglas-Rachford (E-NDLR), based on Douglas-Douglas-Rachford splitting is developed to solve this low-rank optimization problem constrained by the CS measurements. Experimental results demonstrate that the proposed E-NDLR algorithm achieves significant performance improvements over the state-of-the-art in CS image recovery.
Keywords: Image Recovery, Algorithm, Reconstruction, Compressed Sensing, NDLR
1. INTRODUCTION
Compressed Sensing (CS) has drawn quite some attention as a joint sampling and compression approach It states that under certain conditions, signals of interest can be sampled at a rate much lower than the Nyquist rate while still enabling exact reconstruction of the original signal. CS-based approach has an attractive advantage that the encoding process is made signal-independent and computationally inexpensive at the cost of high decoding/recovery complexity. Usually, the CS measurement is acquired through projecting the raw signals on to a pre-defined random sampling operator. Thus, CS is especially desirable in some image processing applications when the data acquisition devices must be simple (e.g., inexpensive resource deprived sensors), or when oversampling can harm the object being captured (e.g., X-ray imaging), among which the compressive sensing Magnetic Resonance Imaging (CS-MRI) is most promising as it significantly reduces the acquisition time of MRI scanning. When applied to 2D images, CS faces several challenges including a computationally expensive reconstruction process and huge memory required to store the random sampling operator. Several fast algorithms have been developed for CS reconstruction. The memory challenge was first addressed in Gan (2007)
using a block based sampling operation, which later on became the most common method in CS image recovery.
Block-based compressed sensing (BCS) has made the CS image recovery practical since it reduces the recovery cost, where image acquisition is conducted in a block-by block manner through the same compressed sensing (CS) measurement operator. However, manually dividing the image into blocks and treating each image block as an independent sub-CS recovery task would inevitably lose some global properties of the image. Thus it would often require some filtering technique to generate good visual recovery result. Nonetheless, the recovered image still suffers a low PSNR. Aside from BCS, another class of popular methods is based on the total variation (TV) model, which exploits the prior knowledge that a natural image is sparse in the gradient domain. TV based algorithms often suffer from undesirable staircase artifacts and tend to over-smooth image details and textures.
5444 built on the well-known nonlocal means (NL) filtering that takes advantage of self-similarities in images, which preserves certain global structure. We formulate the nonlocal estimation into the low-rank approximation problem where the low-rank matrix is formed by the nonlocal similarity patches. Furthermore, by using a deterministic annealing (DA) approach, we incorporate the CS measurement constraint into the low-rank optimization problem. We propose an efficient algorithm based on Douglas-Rachford splitting (DR) to solve the low-rank matrix approximation problem combined with the CS measurement constraints, the solution to which is the final CS recovery output.
The proposed E-NDLR algorithm effectively reduces the staircase artifacts that introduced in BCS and TV by utilizing the nonlocal similarity patches while preventing over-smoothness by recursively incorporating the initial CS measurement constraint.
The rest of the chapter is organized as follows. Section 2 provides a brief review of the CS image recovery problem as well as some related works. Section 3 discusses the nonlocal estimation and Douglas-Rachford Splitting method. We conduct experiments in Section 4 on both standard test images and MRI images. Section 6 concludes the paper.
2. Background and Related Works CS Image Recovery Problem
Mathematically, the sparse representation model assumes that a signal x 2 Rn can be
represented as x = α where € Rnxn is a sparsifying basis or dictionary, and most
entries of the coding vector α are zero or close to zero. This sparse decomposition of
x can be obtained by solving a relaxed convex l1-minimization problem in the following Lagrangian form:
Min { ||x - α||22 + λα||α||1 } , ………. (1)
α where constant λα denotes the regularization parameter.
In CS image recovery, we consider an image I € Rn x n. By representing the image
I in vector format, denoted as x, what we observe is the projected measurement y via
y = x +v , where € Rmxn (m < n) is the measurement operator and v is the additive noise vector. To recover x from y, first y is sparsely coded with respect to the basis by
Solving the following minimization problem
= arg min { ||y - α||22 + λα||1 } ……… (2)
and then x is reconstructed by ^x = α.
This can be easily extended to the block-based scenario, as stated in Elad and Aharon (2006). Let xi = Rix denote an image patch extracted at location i, where Ri is the matrix extracting patch xi from x at pixel location i. Given a basis , each patch can be sparse represented and solved by Eq. (1). Then the entire image x can be represented by the set of sparse code using { i}. The patches can be overlapped to suppress the boundary artifacts. Similarly, in order to reconstruct the image x from the measurement y, we can adopt the same block-based CS recovery by solving i from Eq. (2). The whole image x is then reconstructed as
^x = α = (iN RiT Ri)-1 iN (RiT αi) as proved in Elad and Aharon (2006).
The Iterative soft thresholding (IST) algorithm Daubechies et al. (2004) can be very efficient in solving the problem in Eq. ( 2). In the (k + 1)-th iteration, the solution is given by α(k+1) = Sr(α(k)+ *y - *α(k)) where Sr (.) is the classic soft-thresholding operator Daubechies et al. (2004). In this paper, we use a slightly modified IST algorithm Daubechies et al. (2008), where the solution in each iteration is called the projected Landweber iteration with the adaptive descent parameter β(k) > 0,
α(k+1) = PR[α(k) + β(k) *(y-(k))] ……….(3)
where PR is the l2 projection of on the l1 ball with radius R. The adaptive descent
Parameter β(k) can be selected using the greedy strategy as follows,
βk = ||*( y -α(k)) ||22 / ||*(y-α(k))||22 ………. (4)
This is an accelerated version of IST that converges faster than the original IST. Readers may refer to Daubechies et al. (2008) for details.
2. RELATED WORKS
5445 between rectangular patches are used as a prior on natural images. The idea of nonlocal means has recently received much attention in image processing Peyr´e et al. (2008); Yang and Jacob (2013); Zhang et al. (2012a); Shu et al. (2014); Dong et al. (2014b); Chierchia et al. (2014);
Dong et al. (2014a). For example, Peyre et al. Peyr´e et al. (2008) proposed to use the Total Variation (TV) prior and nonlocal graph to solve the inverse problem with application in CS. The same idea was also adopted in Yang et al. Yang and Jacob (2013).
Zhang et al. Zhang et al. (2012a) proposed TVNLR which improves the conventional TV approach by adding a nonlocal regularization to the CS recovery problem and solved the problem using the Augmented Lagrangian Method (ALM).
Shu et al. proposed the NLCS algorithm Shu et al. (2014) and tried to group similar patches through NLS (nonlocal sparsity) regularization. The authors in Chierchia et al. (2014) proposed a nonlocal total variation structure tensor (ST-NLTV) regularization approach for multicomponent image recovery from degraded observations, leading to significant improvements in terms of convergence speed over state-of-the-art methods such as the Alternating Direction Method of Multipliers (ADMM).
Dong et al. proposed the nonlocal low-rank regularization (NLR-CS) method Dong et al. (2014a) which explored the structured sparsity of the image patches for compressed sensing. In order to explore the low-rank structure of the image patches, a smooth but non-convex surrogate function for the rank estimation is adopted as objective function.
Zhang et al. proposed nonlocal TV regularization (NLVT) Zhang et al. (2010) for CS image recovery. NLTV is based on the Operator splitting (BOS).
In this work, we adopt the nonlocal means filtering idea and introduce a new nonlocal estimation step after the initial CS reconstruction to further remove noise. It differs from Peyr´e et al. (2008) as we use the `1-norm based sparsity of the image and result in solving a convex optimization problem using the projection
method. In the nonlocal graph is similar to the nonlocal weights between patches as used in our paper.
The main difference is that the author further imposed that these weights correspond to a probability distribution and that the graph only connects pixels that are not too far away. While in Yang and Jacob (2013), the nonlocal weights may be improved using a different distance metric (i.e., robust distance metric) to promote the averaging of similar patches while minimizing the averaging of dissimilar patches. In this paper, we only aim to find similar patches to form low-rank matrix and thus differ from these methods. In Dong et al. (2014a) instead of using the nuclear norm for low-rank approximation, the authors proposed to use non-convex surrogate function and subsequently solved the optimization problem via ADMM. In Shu et al. (2014), two non-local sparsity measures, i.e., non-local wavelet sparsity and non-local joint sparsity, were proposed to exploit the patch correlation in NLCS. It then combines with the conventional TV measure to form the optimization objective function and use the ADMM method to solve the CS recovery problem. It differs from our algorithm in that their search for similar patches is incorporated in the objective function while E-NDLR directly adopts the nonlocal means filtering approach to find the similar patches and then conducts low-rank approximation. After getting the non-local low-rank estimation, we further incorporate the initial CS measurement constraint into the low-rank optimization problem, using a deterministic annealing (DA) approach to further improve the recovery result. Additionally, compared to the traditional ADMM method, we propose to use Douglas-Rachford splitting method to effectively solve the combined optimization problem.
5446 the initial CS image recovery task. By searching and incorporating the nonlocal similarity patches the traditional block based CS recovery artifacts could be resolved. Second, we propose to estimate the grouped similarity patches matrix as a low-rank matrix completion problem, referred as nonlocal low-rank estimation. The idea is that, by searching the nonlocal similarity patches we could resolve the block and staircase artifacts, while using low-rank estimation we can further denoise the grouped similarity patches. Third, we incorporate the initial CS measurement constraint into the low-rank estimation optimization problem. By using a deterministic annealing (DA) approach, the Douglas-Rachford splitting effectively solves the reformulated optimization problem.
Figure 1: An Illustration Of Nonlocal Estimation And Similar Patches Denoising Using Low Rank
Matrix Approximation.
3. NONLOCAL LOW-RANK REGULARIZATION AND DOUGLAS-RACHFORD
SPLITTING
In this section, we present the idea of nonlocal low-rank regularization, followed by the proposed Douglas-Rachford splitting method. We refer to the algorithm as the Extended NonlocalDouglas-Rachford splitting (E-NDLR) algorithm.
Nonlocal Low-rank Regularization for CS Image
An example to illustrate the nonlocal estimation step is shown in Fig. 1. The Lena image in the first row is obtained from the IST CS recovery algorithm. Then the nonlocal similar patches are searched across the entire image. We denote the nonlocal similar patches of xi as xi;1; xi;2; xi;3; _ _ _ xi;q . These extracted patches then form the
matrix Bi where the low rank approximation is conducted to yield the resulting denoised patch matrix, as shown in the second row. We apply patch reweight to obtain the estimated patch xe to update the original patch xi. After iterating over the entire image, the much cleaner Lena image is shown leftmost in the second row. Nonlocal Similarity Patches
The basic idea of nonlocal (NL) means filtering is simple. For a given pixel ui in an image x, its NL filtered new intensity value, denoted by NL(ui), is obtained as a weighted average of its
neighborhood pixels within a search window of size w.
In our work, we extend the pixel-wise nonlocal filtering to the patch-based filtering.
Specifically, we search for the nonlocal similar “patches” xi;j ; j = 1; 2; _ _ _ ; q, to the given
patch xi in a large window of size w centered at
pixel ui. Here, q is the total number of similar patches to be selected. The weight of patch xi;j to
xi, denoted as ij , is then computed by
ij = exp ( -||xi-xij ||22) / h2 ) , j = 1, …. , q
…………. (5)
where h is a pre-determined scalar and ci is the
normalization factor. Accordingly, for each patch xi, we have a set of its similar patches,
denoted by i. Then the nonlocal estimates
of each patch ^xi can be computed as ^xi = j€i
ij xij . Further, this can be written in a
matrix form as
^xnl = W ∑i=1p W(i,j ) = { ij if xj € i o otherwise
………(6)
where p denotes the number of all patches in the entire image and ^xnl is the nonlocal
estimated image output.
Patch Denoising by Low-rank Approximation
Although we can use Eq. ( 6) to remove noise in the IST recovered image ^x to a certain
5447 Thus, it is imperative to apply some denoising techniques before the nonlocal similarity
patch reweight using Eq. ( 6) to prevent the noise from accumulating. By rewriting the
nonlocal similarity patches into the matrix format, we have Bi = [xi;1; xi;2; ; _ _ _ ; xi;q],
where each column of Bi is a vector representation of xi;j ; j = 1; 2; _ _ _ ; q for patch xi.
Since all columns of Bi share similarity with patch xi, the columns of Bi should bear a high degree of similarity between each other. In other words, we can safely treat Bi as a low-rank
matrix. We thus formulate the nonlocal patch denoising problem into the lowrank
matrix approximation problem Cand`es and Tao (2010) as follows,
minB1 || Bi - B^i||22 + ƛBi|| B^i||*
……….(7)
where ||B^i|| is the nuclear norm of the low-rank approximated patch matrix B^i, defined by
||B^i||= sqrt(||B^i||T) = ∑
r=1q r and r ‘s are in
singular values of B^i
In addition, since the columns of Bi (or the patches) are also a subset of the reconstructed image from IST recovery algorithm, it should be subject to the CS measurement constraint y =x. Therefore, multiplying Eq. ( 7) with W, we reformulate the denoising problem of Eq. ( 7) into
min || x – WBi ||22 + ƛx||x||* s.t.y = x
………..8
In what follows, we discuss in sec. 3.2 how to solve Eq. ( 8) with the CS measurement constraint using the method referred to as the Douglas-Rachford splitting method.
Douglas-Rachford Splitting
The Douglas-Rachford splitting method was originally proposed in Douglas and Rachford (1956) for solving matrix equations. Later on it was advanced as an iterative scheme to minimize the functions of the form,
min(x) =F(x) + G(x) ………(9)
where both F and G are convex functions for which one is able to compute the proximal mappings proxF and proxG which are defined as proxF (x) = arg min(y) ||x-y||22+ ϓF(y)
………(10)
The E-NDLR Algorithm
Algorithm 2 provides a pseudo-code for the proposed Nonlocal Douglas-Rachford splitting (E-NDLR) algorithm. Given the observation y (i.e., compressed measurements), the E-NDLR algorithm first outputs an intermediate reconstruction result ^xIST through the IST algorithm. This soft-thresholding output is then used to calculate the nonlocal estimated image ^xnl, which is used to initialize the low-rank optimization problem in Eq. ( 7) where the Douglas-Rachford splitting method will be carried out iteratively based on Eqs Algorithm 2: Extended Nonlocal
Douglas-Rachford Splitting (E-NDLR) Algorithm
Algorithm 1:
I Measurement matrix € Rmxn
I Basis matrix € Rnxn
I Observation vector y € Rm.
I Number of IST iterations iter, number of nonlocal estimation iterations J, DR splitting iterations K
Algorithm 2:
I An estimate ^x € Rn of the original image x.
1: Initialize α0 0
2: for k = 1; …; iter do
3: (a) Select β(k) based on Eq. ( 4)
4: (b) Update α(k+1) using Eq. ( 3)
5: end for
6: for j = 1; 2; _ _ _ ; J do 7: Step 1: Nonlocal Estimate
8: (a) Calculate nonlocal weights Wij via Eq. ( 5)
9: (b) Obtain low-rank patch matrix Bi via Eq. (
7)
10: Step 2: Douglas-Rachford Splitting to solve Eq. ( 8)
11: for k = 1; 2; _ _ _ ;K do
12: (a) Calculate proxF (x) via Eq. ( 11) 13: (b) Calculate proxG(x) via Eq. ( 12) 14: (c) Calculate ~xk+1 via Eq. ( 14) 15: end for
16: end for
5448 As for calculating the nonlocal estimates of the image, the E-NDLR algorithm obtains
[image:6.612.96.278.163.301.2]the averaged result based on J nonlocal estimation iterations.
Figure 2: CS Recovery Results On Lena Image With 10% Measurements At Iteration J.
Experiments
In this section, we evaluate the E-NDLR algorithm for CS image reconstruction where both standard test images and MRI images are used. The reason for choosing MRI images for evaluation purpose is due to the significant impact of CS on the clinical practice of MRI, where long acquisition time has been one of the primary obstacles. We implement the algorithm using Matlab 2013b on a 2:20GHz laptop computer. BCS-SPL Mun and Fowler (2009) is a block-based CS image recovery method solved using a smoothed version of projected Landweber (SPL) algorithm. The smoothing process is done by the Wiener filter. We further compare our result with one of the state-of-the-art algorithms for image CS recovery, known as TVAL3 Li et al. (2009a). TVAL3 tries to minimize the image total variation norm using augmented lagrangian and alternating direction algorithms. Several TV-based methods are also compared. The TV benchmark method denoted as TV which is implemented based on l1magic (2006), TVNLR Zhang et al. (2013) and NLTV Zhang et al. (2010). We also compare E-NDLR performance with other nonlocal based approaches, e.g., NLCS Shu et al. (2014) and NLR-CS Dong et al. (2014a). Finally, to evaluate the potential of E-NDLR as a standalone denoising method, we compare its performance with the state-of-the-art BM3D Dabov et al. (2007) method for noise removal purpose.
CS Recovery on Standard Image Dataset
We present the experimental results for noiseless CS measurements and then report the
results using noisy CS measurements.
Noiseless Recovery
We first test the E-NDLR algorithm in noiseless settings using standard test images of size 512* 512. The block-based image patch is of size 6 * 6. We set the number of similar patches q in the nonlocal estimation step as 4 We use the scrambled Fourier matrix as the CS measurement operator _ and DCT matrix as the basis to repr
esen t the origi nal
image in the initial IST recovery. The parameters are selected as we find that the recovery result gradually converges when J reaches 12 for all the image datasets. Figure. 2 show one example on Lena image using 10% of measurements. Note that at iteration 0, we use the initial IST recovery result.
5449
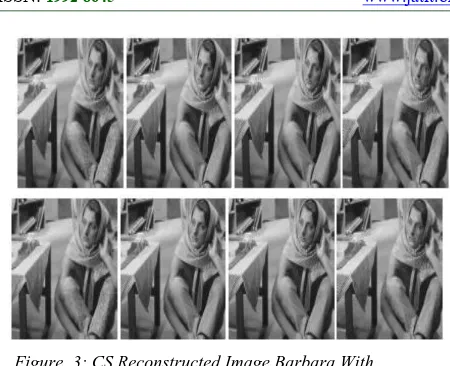
Figure 3: CS Reconstructed Image Barbara With 30% Measurement Ratio. (A) Original Image; (B) Proposed E-NDLR Recovery, PSNR=37:30db; (C) BCS-SPL Recovery Mun And Fowler (2009), PSNR=25:92db; (D) TVAL3 Recovery
Li Et Al. (2009a), PSNR=24:79db; (E) TVNLR Recovery Zhang Et Al. (2013), PSNR=25:35db. (F) NLCS Recovery Shu Et Al. (2014), PSNR=31:65db; (G) NLR-CS Recovery Dong
Et Al. (2014a), PSNR=34:26db; (H) NLTV Recovery Zhang Et Al. (2010), PSNR=31:79db
Figure 4: Boat Image With Cropped Character Patch Using 20% Measurements. (A) Proposed E-NDLR Recovery, PSNR=32:48db; (B) NLCS Recovery Shu Et
Al. (2014),PSNR=30:66db; (C) TVNLR Recovery Zhang Et Al. (2013), PSNR=28:02db; (D) NLR-CS Recovery Dong Et Al. (2014a), PSNR=29:07db; (E) NLTV Recovery Zhang Et Al. (2010),PSNR=27:97db.
By doing this, we would be able to quantify how much improvement E-NDLR has gained. Also, since the initial image from IST output is noisy, we further apply the state-of-the-art denoising algorithm - BM3D on top of the IST recovery result to denoise the result image in order to compare with the E-NDLR result.
In Table 1, the column TVAL3+E-NDLR denotes applying E-NDLR on the TVAL3 resulting image, the column BCS-SPL+E-NDLR denotes E-NDLR applied on top of the BCSSPL output, and IST+BM3D denotes BM3D applied on top of the IST output. Note, we also generate the sole IST algorithm output in the first column. From the table, we can see that the columns correspond to TVAL3+E-NDLR,
BCS-SPL+E-NDLR and E-BCS-SPL+E-NDLR yield similar PSNR. This result indicates the generalization capability of E-NDLR, that it actually gives the best available denoised recovery result no matter what the initial input is. That is, E-NDLR has the great potential of serving as a stand-alone denoising algorithm.
Some visual results of CS reconstructed image Barbara with 30% measurement ratio are presented in Fig. 3. Obviously, E-NDLR generates much better visual quality than those from
BCS-SPL and TVAL3, where both BCS-SPL and TVAL3 have blurred artifacts. When compared using Table 1, we see E-NDLR outperforms the other two algorithms largely in PSNR. The reason is that the image Barbara itself has a lot of texture patterns (i.e., nonlocal similar patches), which had been successfully exploited in the E-NDLR algorithm. Fig. 4
[image:7.612.90.295.387.454.2]demonstrates the Boat image with cropped character patch using 20%
Figure 5: Part Of Lena Image With 200% Magnification Using 20% Measurements. (A) Original
Image; (B) Reconstruction Using Proposed E-NDLR With IST, PSNR=36:33db; (C) TVAL3 + E-NDLR,
PSNR=36:35db (D) BCS-SPL + E-NDLR, PSNR=36:35db. Measurements. Also, We Show In
Fig. 5 The Result Of Original E-NDLR Using IST As
Well As TVAL3+E-NDLR And BCS-SPL+E-NDLR. They All Have Similar Visual Results As Compared To
The Original Image. This Is Consistent To The
Observation Made Based On Table 1 That Their
Recovery Psnrs Are Very Close.
Noisy Recovery
5450 test images and add different SNRs (5; 10; 15; 25; 35) to their 20% CS measurements and report the PSNR values of the final CS recovered image in Table 2.
From Table 2, we see that by adding 5dB of Gaussian noise on the CS measurements, all the TV-based algorithms’ (i.e., TV, NLTV, TVAL3 and TVNLR) recovery performance suffer in terms of PSNR as compared with their original noiseless recovery settings. When the noise SNR reaches 35, the recovery result is close to its noiseless case. It also demonstrates that the recovery performance degrades on both BCS-SPL and NLCS when noise is added while E-NDLR is affected much less by the noise in all SNR cases. We see that the NLR-CS algorithm is also robust on noise with only less than 1dB PSNR decrease as compared with its noiseless settings for all the testing images. For BM3D, as a denoising algorithm, we see that the recovery result is not affected much with different noise dB levels. However, E-NDLR still outperforms NLR-CS and BM3D in the noisy CS recovery case.
Figure 6: Axial T2 Weighted Brain image CS recovery using 4 fold downsampling (25% measurements). (a) Original image; (b) reconstruction
using Sparse MRI, PSNR=31:84dB; (c) DLMRI, PSNR=34:75dB; (d) E-NDLR (IST),
PSNR=34:86dB.
4.2 Recovery Performance on MRI Data
In this experiment, the performance of the proposed E-NDLR algorithm is demonstrated on the real MRI Brain image data with a variety of undersampling factors. The image used is in vivo MR scans of size 512 * 512 from ARS (2009). The CS data acquisition is simulated by downsampling the 2D discrete Fourier transform of the Brain image.
Our result is compared with a leading CS MRI method by Lustig et al. Lustig et al. (2007) (denoted as SparseMRI) and the dictionary learning based recovery algorithm called DLMRI Ravishankar and Bresler (2011). The SparseMRI method is to minimize both the l1 norm and the TV norm of the image in the wavelet domain. The DLMRI uses K-SVD dictionary learning
[image:8.612.327.505.298.401.2]methods and tries to find the best sparse representation of the image for CS recovery. We adopt the same 2D random sampling scheme as in Ravishankar and Bresler (2011) with 2:5; 4; 6; 8; 10; 20 fold downsampling. Here, for the k fold downsampling, it is equivalent to the measurement ratio (i.e., m n ) of 1 k . In Fig. 6, we present the CS recovery result on the Brain image with 4 fold downsampling. We observe that E-NDLR (based on IST) gives the best recovery result in PSNR which is 34:86dB. The DLMRI method also has a close PSNR of 34:75dB. We also demonstrate in Fig. 7 the comparison with various downsampling factors. When the downsampling factor is within 10 fold, the E-NDLR performance is comparable to that of 72
Figure 7: CS Recovery Results Comparison With Various Down Sampling Factors.
5451
Table 1 . PSNR Performance
Algorithms IST TV TVAL3 BCS-SPL IST+ BM3D NLCS TVNLR NLRCS NLTV NLDR
TVAL3+ NLDR BCS+ SPL+ NLDR Lena image m/n
Q1 25
.41 22.75 29.02 28.31 25.93 31.74 28.62 29.58 25.94 33.67 33.81 33.8
Q2 29
.51 24.44 31.56 31.33 30.42 34.78 30.98 32.95 29.73 36.33 36.36 36.3
Q3 32
.08 25.47 32.99 33.5 32.91 36.67 33.52 34.73 31.73 37.82 37.83 37.83
Q4 34
.07 27.88 35.03 33.2 34.72 38.22 35.48 36.56 35.39 39.02 39.03 39.02
Q5 35
.89 30.73 36.26 36.79 36.34 39.66 36.94 38.77 37.9 40.16 40.17 40.16
Barbara Image
m/n
Q1 21
.18 20.1 21.31 22.85 21.34 24.34 22.33 26.9 23.13 29.48 31.14 31.01
Q2 24
.35 21.66 21.6 24.33 24.8 28.17 24.3 30.87 28.29 30.28 33.21 35.22
Q3 26
.96 23.61 24.79 23.92 27.73 31.65 23.35 34.26 31.79 37.3 37.3 37.32
Q4 29
.38 23.32 28.33 27.68 30.29 34.32 26.85 36.14 34.44 38.08 38.98 38.98
Q5 31
.73 26.62 31.08 30.15 32.82 36.63 28.02 32.36 36.23 40.3 40.01 40.01
Boat image
m/n
Q1 23
. 77 21 . 48 25 . 76 24 . 65 24 . 16 27 . 74 24 . 73 26 . 41 23 . 94 28 . 69 29 . 02 29 . 24
Q2 27
. 01 23 . 18 28 . 94 27 . 09 27 . 38 30 . 66 28 . 02 29 . 09 27 . 97 34 . 48 32 . 68 32 . 63
Q3 29
. 1 24 . 84 31 . 09 28 . 94 29 . 61 32 . 64 30 .
8 31
. 65 30 . 89 34 . 41 34 . 47 34 . 43
Q4 30
. 91 27 . 93 32 . 68 31 . 39 31 . 24 34 . 26 33 . 06 32 . 48 33 . 45 35 . 77 35 . 81 38 . 86
Q5 32
5452 5. CONCLUSION
This paper presented a CS image recovery algorithm based on Douglas-Rachford Splitting with nonlocal estimation. The proposed E-NDLR algorithm first used the iterative thesholding algorithm to obtain the intermediate image reconstruction result. Then a nonlocal estimation step was applied to the reconstructed image to improve the recovery performance. In the nonlocal estimation step, we reformulated the patches estimation as patch denoising problem using low-rank matrix approximation. We proposed a Douglas- Rachford splitting method to solve the CS recovery problem with the nonlocal estimation. Experimental results validated the performance of the proposed E-NDLR algorithm in both PSNR and visual perception on standard test images with both noiseless and noisy settings. E-NDLR outperformed the state-of-the-art CS recovery algorithms and showed it can be applied on top of existing recovery algorithms to further improve the recovery performance. Experiments on MRI data also demonstrated it is practical for real applications with competing results.
References
[1] Consolvo, S., McDonald, D., Toscos, T., Chen, M., Froehlich, J., Harrison, B., Klasnja, P., LaMarca, A., LeGrand, L., Libby, R., et al. (2008). Activity sensing in the wild: a field trial of ubifit garden. In Proceedings of the twenty-sixth annual SIGCHI conference on Human factors in computing systems, pages 1797–1806. ACM. 2, 16
[2] Dabov, K., Foi, A., Katkovnik, V., and Egiazarian, K. (2007). Image denoising by sparse 3-d transform-domain collaborative filtering. Image Processing, IEEE Transactions on, 16(8):2080–2095. 66
[3] Dahl, J., Hansen, P. C., Jensen, S. H., and Jensen, T. L. (2010). Algorithms and software for total variation image reconstruction via first-order methods. Numerical Algorithms, 53(1):67–92. 55
[4] Dai, W. and Milenkovic, O. (2009). Subspace pursuit for compressive sensing signal reconstruction. Information Theory, IEEE Transactions on, 55(5):2230–2249. 11
[5] Das, T., Mohan, P., Padmanabhan, V. N., Ramjee, R., and Sharma, A. (2010). Prism: platform for remote sensing using
smartphones. In Proceedings of the 8th international conference on Mobile systems, applications, and services, pages 63–76. ACM. 3
[6] Daubechies, I., Defrise, M., and De Mol, C. (2004). An iterative thresholding algorithm for linear inverse problems with a sparsity constraint. Communications on pure and applied mathematics, 57(11):1413–1457. [7] Daubechies, I., Fornasier, M., and Loris, I.
(2008). Accelerated projected gradient method for linear inverse problems with sparsity constraints. Journal of Fourier Analysis and Applications, 14(5-6):764– 792.
[8] Davenport, M. A., Duarte, M. F., Eldar, Y. C., and Kutyniok, G. (2011). Introduction to compressed sensing. Preprint
5453
Table 2: Showing The Noisy CS Recovery Results And Is Tested For 20% Measurement With E-NLDR
SNR IST TV TVAL3 BCS-SPL D IST+BM3 NLCS TVNLR NLRCS NLTV Lena Image
5 36.24 21.27 25.94 30.5 28.82 28.14 32.45 32.55 30.32
10
36.2 9
21.6
3 27.66 30.51 28.93 28.43 33.13 32.65 30.31
15 36.29 22.19 28.34 30.52 30.94 29.23 33.44 32.76 30.31
25 36.29 23.63 29.01 30.52 31.18 30.96 34.01 32.9 30.34
35 36.29 24.34 29.5 30.52 31.18 30.98 34.57 32.95 30.34 Noiseles
s
36.3 3
24.4
4 29.73 31.37 31.56 30.98 34.78 32.95 30.42 Barbara Image
5 35.15 19.03 25.11 24.4 19.45 23.22 27.73 30.39 24.74
10 35.16 19.34 25.94 24.44 19.8 23.56 27.86 30.5 24.75
15
35.1 6
19.8
7 26.37 24.45 19.94 24.17 28.02 30.76 24.77
25 35.21 21.05 27.35 24.45 20.03 24.04 27.94 30.87 24.77
35 35.27 21.32 28.02 24.46 20.87 24.28 28.01 30.87 24.8 Noiseles
s 35.28 21.66 28.29 24.33 21.6 24.3 28.17 30.87 24.8 Boat Image
5
32.3 9
20.1
5 25.46 27 27.65 27.14 28.33 28.67 27.29
10 32.44 20.44 25.63 27.01 27.78 27.45 28.97 28.75 27.32
15 32.44 21.21 26.29 27.02 28.08 27.93 29.25 28.97 27.32
25
32.4 4
21.9
9 26.99 27.02 28.21 28.02 29.76 29.05 27.32
35 32.44 22.78 27.68 27.02 28.57 28 30.49 29.05 27.34 Noiseles