ORIGINAL RESEARCH ARTICLE
GROWTH CHARTS AMONG A SELECTED SAMPLE OF LEBANESE
INFANTS FROM BIRTH UNTIL 2 YEARS OF AGE: ASSOCIATION
WITH BREASTFEEDING AND CHILD RANK IN THE FAMILY
*
Titsiana Maria Samir Mahayri
Registered Dietitian, M.Sc. Department of Nutrition, Faculty of Sciences II,
Lebanese University - Fanar, Lebanon
ARTICLE INFO ABSTRACT
Growth is a very important marker for child’s health, therefore monitoring it with growth charts is essential. The aim of this study is to develop specific growth charts for Lebanese children and to determine the influence of gender, breastfeeding duration and child’s rank in the family on children’s development and the corresponding growth charts. Thus, this retrospective study was performed in Lebanon on 400 infants from birth until 2 years of age. The data was collected from the files of four pediatricians, and analyzed on SPSS. The charts were established on Microsoft Excel. According to the results, the factor that improved infant growth is a breastfeeding duration of more than six months. After establishing the specific charts for Lebanese children, we can deduce that the growth of Lebanese children is similar to that of American children, for this reason the use of WHO charts may seem useful to evaluate the development and detect growth defects. Finally, further studies covering all the regions of Lebanon must be carried out to assess the growth of children and to ensure the accuracy of these results.
*Corresponding author
Copyright ©2017,Titsiana Maria Samir Mahayri.This is an open access article distributed under the Creative Commons Attribution License, which permits unrestricted use, distribution, and reproduction in any medium, provided the original work is properly cited.
INTRODUCTION
Children’s growth is an important marker of their well-being and their nutritional status, thus the monitoring of their development is crucial. Normal growth is defined as the progression of changes in weight, height and head circumference, it can reflect the overall health status of the
child (Boom et al., 2010). Poor growth is associated with
short-term and long-term effects, including increased rates of
infection in children (Ayatollahi et al., 2015). Several factors
can have a positive or negative effect on infant growth. Optimal growth can only be achieved when all the genetic, nutritional and environmental factors work in harmony (Delemarre-van de Waal, 1993). The main source of growth assessment includes growth charts, which cannot be applied to all countries due to cultural, economic, and genetic differences between them. Moreover, various studies have shown that the growth model is a function of time and space, that’s why the charts have to be updated periodically as the corresponding
data are modified over time (Heydari et al., 2009).
In Lebanon, growth charts are used for the evaluation of infants’ growth. However, doctors are often facing problems with identifying the appropriate growth curve for each child, as some of them are above or below the usual limits (outside the white zone, the area in which the child's growth is considered normal). This can lead to misinterpretation of the child's growth profile. Appropriate local measurement should be provided to monitor the growth of children in each region
(Heydari et al., 2009), because ethnic differences in body
composition and size are evident between populations (Lee et
al.,2014; Natale & Rajagopalan, 2014). Growth even differs
among populations and ethnic groups that live in close vicinity
within the same geographic area (Hermanussen et al., 2016).
For example, mean heights and weights of African and European children were greater than those of Indian and
Chinese children (Ashcroft et al., 1976). Consequently, the
recent trend is for many countries to produce their own local growth reference for use in their clinics, because pediatricians prefer the accuracy of their own locally produced references.
ISSN: 2230-9926
International Journal of Development Research
Vol. 07, Issue, 11, pp.16750-16755, November,2017
Article History:
Received 19th August 2017
Received in revised form 22nd September, 2017
Accepted 23rd October, 2017
Published online 29th November, 2017
Key Words:
Growth, Development, Growth Charts, Infant, Lebanon, WHO.
Citation: Titsiana Maria Samir Mahayri. 2017.“Growth charts among a selected sample of lebanese infants from birth until 2 years of age: association
with breastfeeding and child rank in the family”, International Journal of Development Research, 7, (11), 16750-16755.
It is also useful for studies concerning the change in stature
over generations (Karlberg et al., 2007). Since many countries
have created their own local growth charts (Ekhard et al.,
2010), it is important to develop national standards for the
growth of children in each population (Al-Amoud et al.,
2004). The aim of this study is to develop specific growth charts for Lebanese children and to determine the influence of gender, breastfeeding duration and child’s rank in the family on children’s development and the corresponding growth charts.
MATERIALS AND METHODS
Population and Setting
This retrospective longitudinal study was conducted in Lebanon among 400 healthy Lebanese infants (197 boys and 207 girls), from birth until 2 years of age. Demographic information including gender, age, child rank, breastfeeding duration, weight and height were collected from the medical records of four pediatricians at their private clinics in Keserwan and Matn districts. Infant growth depends on several other factors, but only those aforementioned factors were present in the medical records. Weight and height at birth were documented in the records. Measurements were recorded at different target ages (birth, monthly from 1 to 8 months, 10 months, 12 months, 14 months, 16 months, 18 months, 20 months, 22 months, and 24 months). The four clinics adopt standardized protocols for anthropometric measurements, using a recumbent measuring board for the height and digital scale for the weight.
Inclusion Criteria
Children must be from middle-class families, thus, the parent’s annual income is between $9,000 and $15,000. They must be the product of an essentially normal birth, because there is an increased risk of the child contracting diseases during cesarean
section delivery (Neu et al., 2011), and the children must be
healthy. Normal birth and the child’s good health were confirmed from the medical records and after the review of the charts.
Exclusion Criteria
Several exclusion criteria were noted. First of all, infants with very low birth weight (<1500 grams) were excluded from the study because their growth was obviously different from that
of infants with higher birth weight (Majlesi et al., 2001). Then,
children from families with low socioeconomic status were excluded because their growth might have been negatively affected. Moreover, children from families with high socioeconomic status were also excluded because they are at
risk of obesity (Zayed et al., 2016). Additionally, twins and
triplets were excluded because they have different growth
trajectory (Chaudhari et al., 1997). Finally, infants with
perinatal morbidity or health conditions known to affect growth have been excluded.
Statistical Analysis
All information was checked before entering the data on Microsoft Excel. A specific code for each piece of data was used.
The analysis of the data was carried out using the Statistical Package for Social Sciences software; SPSS Inc. Released 2009. PASW Statistics for Windows, Version 18.0. Chicago: SPSS Inc. Data were expressed as a percentage for all discrete variables and on average and standard deviation for continuous variables. The Independent Samples t Test was used for groups containing fewer than two variables; however, the ANOVA test was used for groups containing more than two variables to identify factors that may have some influence on the growth of children. The values were considered significant for p ≤ 0.05. The graphs were realized on Microsoft Excel, using the maximum value, the minimum value and the average taken from SPSS.
RESULTS
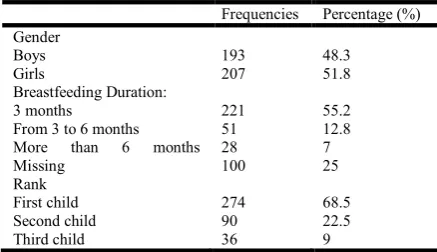
[image:2.595.323.542.491.617.2]Overall, 400 Lebanese infants, 193 boys (48.3%) and 207 girls (51.8%), were recruited from the files of four pediatricians, after excluding 93 infants according to the exclusion criteria. The characteristics of the study population are summarized in Table 1. Approximately half of the women exclusively breastfed their children for three months (55.3% versus 12.8% who exclusively breastfed their children for 3 to 6 months and 7% who exclusively breastfed their children for a duration of more than 6 months). In addition, more than half of the children are firstborns, (68.5% versus 22.5% who represent the second child and 9% represent the third child). As shown in Table 1, the breastfeeding duration was considered in three categories: 3 months, from 3 to 6 months, more than 6 months, and child’s rank categories in first child, second child, and third child. Gender has a highly significant effect on child growth (P = 0.000), and since boys have higher weights and heights than girls, these differences in growth are totally expected (Table 2).
Table 1. Demographic Characteristics of the Study Population (n=400)
Frequencies Percentage (%) Gender
Boys Girls
193 207
48.3 51.8 Breastfeeding Duration:
3 months
From 3 to 6 months More than 6 months Missing
221 51 28 100
55.2 12.8 7 25 Rank
First child Second child Third child
274 90 36
68.5 22.5 9
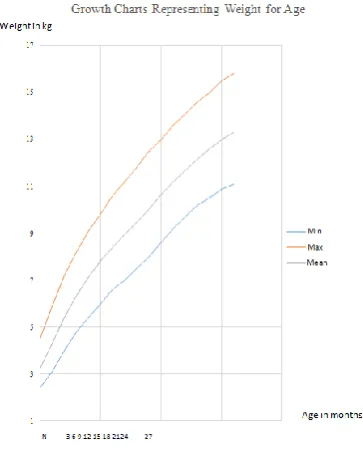
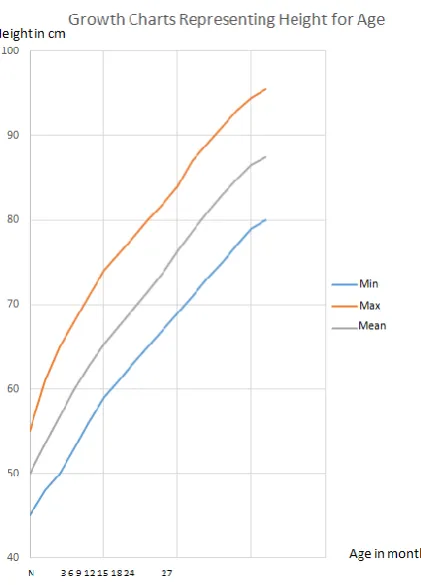
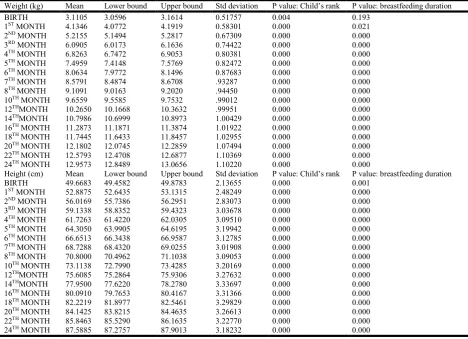
In addition, children's birth order had a significant effect on growth (P = 0.000), since the weight and height differ between the first, second and the third child. Indeed, children born first have lower weights and heights than their brothers. Breastfeeding duration also affects infant growth in the following months (P = 0.000). For example, children breastfed for more than six months have weights and heights greater than those that are breastfed for only three months (Table 3, 4 and 5). The growth charts for weight and height must be specific according to the gender of the children, so four curves have been established (Figures 1, 2, 3 and 4). These curves were established using the minimum, maximum and mean. The percentile method that eliminates the 5% of the extreme values was not used, since the exclusion criteria had already eliminated the extreme values.
Table 2: Mean of Weight and Height for Each Month According to Gender
Boys N = 193
Girls N = 207
P value
Significant for: p ≤ 0.05 Birth Weight (kg) Height (cm) 3.2464 50.0026 2.9837 49.3565 0.000
1st month
Weight (kg) Height (cm) 4.2907 53.5181 3.9889 52.2995 0.000
2nd month
Weight (kg) Height (cm) 5.4129 56.7552 5.0315 55.3285 0.000
3rd month
Weight (kg) Height (cm) 6.3455 59.9793 5.8527 58.3454 0.000
4th month
Weight (kg) Height (cm)) 7.1290 62.6425 6.5440 60.8720 0.000
5th month
Weight (kg) Height (cm) 7.8161 65.2927 7.1973 63.3841 0.000
6th month
Weight (kg) Height (cm) 8.4054 67.4404 7.7444 65.9155 0.000
7th month
Weight (kg) Height (cm) 8.9469 69.4637 8.2361 68.0435 0.000
8th month
Weight (kg) Height (cm) 9.4733 71.5337 8.7696 70.1159 0.000
10th month
Weight (kg) Height (cm) 10.0376 73.8782 9.9087 72.4010 0.000
12th month
Weight (kg) Height (cm) 10.6472 76.3653 9.9087 74.9029 0.000
14th month
Weight (kg) Height (cm) 11.1927 78.6425 10.4312 77.3043 0.000
16th month
Weight (kg) Height (cm) 11.6793 80.8078 10.9217 79.4227 0.000
18th month
Weight (kg) Height (cm) 12.1461 82.9845 11.3700 81.5109 0.000
20th month
Weight (kg) Height (cm) 12.5969 84.8679 11.7917 83.4662 0.000
22th month
Weight (kg) Height (cm) 12.9995 86.6140 12.1874 85.1304 0.000
24th month
Weight (kg) Height (cm) 13.4073 88.5078 12.5377 86.7314 0.000
According to the graphs, we note that in the first months, infant growth is rapid, then with time, the speed of growth of weight and height decreases. It is also noted that the weight and height of the boys are greater than the weight and height of the girls, which was totally expected.
DISCUSSION
In this study, gender affected children’s growth. We note that boys have a higher weight and height than girls. This is in
agreement with several studies, first, Hosseini et al., 2014;
Ayatollahi et al., 2015; Ong et al., 2002 and finally Lee et al.,
2015. The production of testosterone might be the cause of
increasing growth rate of males (Smith et al., 1976). In our
study, the child rank in the family had a significant effect on growth. This finding is in line with some previous studies done
by Hosseini et al., 2014, showing that children born first may
be smaller than their younger siblings. However, in the study
done by Ong et al., 2002, infants born first are smaller and
[image:3.595.40.289.85.548.2]thinner at birth, but show a catch-up, so that they compensate their early deficit, which leads to a risk of obesity.
[image:3.595.343.529.312.593.2]Figure 1. Weight-for-age, birth to 24 months Boys
Figure 2. Weight-for-age birth to 24 months Girls
Finally, several studies show no significant effect of child’s
rank on growth (Raum et al., 2011, Ayatollahi et al., 2015).
Breastfeeding duration is a very important factor that positively influences infant’s growth. Breastfeeding is associated with better cognitive development in children, because of the composition of breast milk, the behavior of mothers with their child, the socio-cultural level, or because the contribution of all these factors at the same time. This effect is further enhanced by exclusive and prolonged breastfeeding. In addition, it is noted that exclusive and prolonged breastfeeding of 4 to 6 months is recommended for the prevention of a large number of diseases in children, more or less in the long term: otitis, gastrointestinal infections, intestinal diseases, atopic diseases, and cardiovascular diseases
Figure 3. Height-for-age birth to 24 months Boys
Figure 4. Height-for-age birth to 24 months Girls
In this study, breastfeeding duration affects children, for example infants who were breastfed for a longer duration had a higher weight and height. This finding is in line with several
studies, first of all, Hosseini et al., 2014; confirms that infants
who are exclusively breastfed have a higher weight than others, up to 24 months. Thereafter, the other children have a higher mean weight.
This shows the dual role of breastfeeding: on the one hand it improves the growth of the infants during the first months of their life, and on the other hand it prevents obesity. Moreover,
Chantry et al., 2015 claims that exclusively breastfed infants
have a higher weight than others. A reverse association between breastfeeding duration and the risk of obesity was
revealed in a meta-analyses (Harder et al., 2005). However, a
non-significant relationship between breastfeeding duration
and overweight was shown in the study of Vafa et al., 2012.
For this reason, the WHO recommends exclusive
breastfeeding during the first six months before the introduction of complementary feeding. Then, comparing the growth charts of Lebanese children with those of American children, WHO 2006, we note that at birth the weights of Lebanese boys are between 2.5 kg and 4.5 kg which is roughly similar to that of American boys, weighing between 2.4 kg and 4.5 kg. After one year, the weights of Lebanese boys range from 7.4 kg to 11.9 kg, which is also similar to that of American boys, weighing between 7.6 kg and 12 kg. However, at two years old, the weights of Lebanese boys vary between 11.1 kg and 15.1 kg, which differs from those of American boys, weighing between 9.6 kg and 15.3 kg. Therefore, the two-year interval is larger in American boys, thus the weights of Lebanese boys remain within the normal and acceptable margin. As for girls, we note that at birth, the weights of Lebanese girls are between 2.3 kg and 4.2 kg, which is roughly similar to those of American girls, weighing between 2.4 kg and 4.4 kg. After one year, the weights of Lebanese girls vary between 6.8 kg and 11.4 kg, which is also similar to those of American girls, weighing between 7 kg and 11.4 kg. However, at two years old, the weights of Lebanese girls are between 10 kg and 15.1 kg, which differs slightly from those of American girls weighing between 9 kg and 14.8 kg.
As for height, it is noted that at birth the heights of the Lebanese boys are between 45 cm and 55 cm, which is approximately similar to those of the American boys, whose heights are between 46 cm and 54 cm. After one year, the heights of Lebanese boys vary between 66 cm and 80 cm, which differs somewhat from those of American boys whose heights vary between 71 cm and 81 cm. However, at two years old, the heights of Lebanese boys vary between 80 cm and 95 cm, which is similar to those of American boys, whose heights vary between 81 cm and 94 cm. In the case of girls, it should be noted that at birth the heights of Lebanese girls range from 44 cm to 53 cm, which is roughly similar to that of American girls whose heights range from 45 cm to 53 cm. After one year, the heights of the Lebanese girls vary between 63 cm and 77 cm, which is also similar to those of American girls, whose heights vary between 68 cm and 78 cm. Moreover, at two years old, the heights of the Lebanese girls are between 78 cm and 94 cm, which is similar to those of American girls, whose heights are between 80 cm and 93 cm.
Finally, it can be concluded that the growth of Lebanese children is similar to that of American children, so the WHO charts can be used to assess children's development in Lebanon and to detect anomalies and growth problems. Thus, the interpretation of the growth profile of the child will not be erroneous. The limitations of this study include the following: The sample is limited, with only 400 infants. Several important pieces of information were not available in the pediatrician's files. The sample may not be representative of the entire population.
[image:4.595.56.267.379.672.2]Table 3. Influence of Child Rank and Breastfeeding Duration on Child’s Growth
Weight (kg) Mean Lower bound Upper bound Std deviation P value: Child’s rank P value: breastfeeding duration
BIRTH 3.1105 3.0596 3.1614 0.51757 0.004 0.193
1ST MONTH 4.1346 4.0772 4.1919 0.58301 0.000 0.021
2ND MONTH 5.2155 5.1494 5.2817 0.67309 0.000 0.000
3RD MONTH 6.0905 6.0173 6.1636 0.74422 0.000 0.000
4TH MONTH 6.8263 6.7472 6.9053 0.80381 0.000 0.000
5TH MONTH 7.4959 7.4148 7.5769 0.82472 0.000 0.000
6TH MONTH 8.0634 7.9772 8.1496 0.87683 0.000 0.000
7TH MONTH 8.5791 8.4874 8.6708 .93287 0.000 0.000
8TH MONTH 9.1091 9.0163 9.2020 .94450 0.000 0.000
10TH MONTH 9.6559 9.5585 9.7532 .99012 0.000 0.000
12THMONTH 10.2650 10.1668 10.3632 .99951 0.000 0.000
14THMONTH 10.7986 10.6999 10.8973 1.00429 0.000 0.000
16TH MONTH 11.2873 11.1871 11.3874 1.01922 0.000 0.000
18TH MONTH 11.7445 11.6433 11.8457 1.02955 0.000 0.000
20TH MONTH 12.1802 12.0745 12.2859 1.07494 0.000 0.000
22TH MONTH 12.5793 12.4708 12.6877 1.10369 0.000 0.000 24TH MONTH 12.9573 12.8489 13.0656 1.10220 0.000 0.000
Height (cm) Mean Lower bound Upper bound Std deviation P value: Child’s rank P value: breastfeeding duration
BIRTH 49.6683 49.4582 49.8783 2.13655 0.000 0.001
1ST MONTH 52.8875 52.6435 53.1315 2.48249 0.000 0.000
2ND MONTH 56.0169 55.7386 56.2951 2.83073 0.000 0.000
3RD MONTH 59.1338 58.8352 59.4323 3.03678 0.000 0.000
4TH MONTH 61.7263 61.4220 62.0305 3.09510 0.000 0.000
5TH MONTH 64.3050 63.9905 64.6195 3.19942 0.000 0.000
6TH MONTH 66.6513 66.3438 66.9587 3.12785 0.000 0.000
7TH MONTH 68.7288 68.4320 69.0255 3.01908 0.000 0.000
8TH MONTH 70.8000 70.4962 71.1038 3.09053 0.000 0.000
10TH MONTH 73.1138 72.7990 73.4285 3.20169 0.000 0.000
12THMONTH 75.6085 75.2864 75.9306 3.27632 0.000 0.000
14THMONTH 77.9500 77.6220 78.2780 3.33697 0.000 0.000
16TH MONTH 80.0910 79.7653 80.4167 3.31366 0.000 0.000 18TH MONTH 82.2219 81.8977 82.5461 3.29829 0.000 0.000
20TH MONTH 84.1425 83.8215 84.4635 3.26613 0.000 0.000
22TH MONTH 85.8463 85.5290 86.1635 3.22770 0.000 0.000
[image:5.595.139.457.488.642.2]24TH MONTH 87.5885 87.2757 87.9013 3.18232 0.000 0.000
Table 4. Means for Weight and Height According to Child’s Rank and Breastfeeding Duration for the First Month
Variable F ERROR DF P value
INTERCEPT 3945.577 253.000 0.000
GENDER BOY GIRL
1.943 253.000 0.002
RANK 1ST CHILD
2ND CHILD
3RD CHILD
3.189 254.000 0.000
BREASTFEEDING DURATION 3 MONTHS
FROM 3 TO 6 MONTHS MORE THAN 6 MONTHS
1.258 254.000 0.005
RANK*BREASTFEEDING DURATION 1.562 254.000 0.030
RANK*GENDER 2.404 254.000 0.000
BREASTFEEDING DURATION*GENDER 1.155 254.000 0.134
Table 5. Influence of the Different Factors on Child’s Growth
Rank Weight Mean (kg) Height Mean (cm)
1ST CHILD 4.0627 52.3802
2ND CHILD 4.1883 53.7200
3RD CHILD 4.5472 54.8182
Breastfeeding duration WEIGHT MEAN (KG) HEIGHT MEAN (CM)
3 MONTHS 4.0900 52.622
FROM 3 TO 6 MONTHS 4.2380 53.8922
[image:5.595.133.461.684.765.2]Conclusion
Growth charts established specifically for the Lebanese population show a certain similarity with the WHO charts. However, the establishment of new charts specific for each nation is recommended. The factors influencing growth were child sex, birth order, and breastfeeding duration. Finally, further studies covering all the regions of Lebanon must be carried out to assess the growth of children and to ensure the accuracy of these results.
Acknowledgement
This research was supported by the department of nutrition in the Lebanese University, faculty of Sciences II, Fanar. The author is grateful to the pediatricians who generously permitted the use of their data. Author’s appreciation also goes to the staff of the dietetic department at Saint Georges Hospital for their contributions in checking the workand providing feedback. Finally the author would like to thank Dr. Antonios Dina for his assistance on this project and Ashley El-Jor for helping out in the proofreading of the manuscript.
Ethical approval and consent to participate
Ethical approval was obtained from the pediatricians. The information was received in a depersonalized form. The data was collected and handled anonymously.
REFERENCES
Al-Amoud, M. M., Al-Mazrou, Y. Y., El-Gizouli, S. E., Khoja, T. A. and Al-Turki, K. A. 2004. Clinical growth charts for pre-school children. Saudi Medical Journal, 25(11), 1679–1682.
Ashcroft, M. T. and Desai, P. 1976. Ethnic differences in growth potential of children of African, Indian, Chinese and European origin. Transactions of the Royal Society of Tropical Medicine and Hygiene, 70(5–6), 433–438. Ayatollahi, S. M. T., Sharafi, Z. and Haem, E. 2015. Child
Weight Growth Chart and Its Associated Factors in Birth Cohort of Maku Using a Growth Curve Model and LMS Method. Global Journal of Health Science, 7(6), 181–186. Boom A. J., (2010). Normal growth patterns in infants and
prepubertal children
Chantry, C. J., Eglash, A. and Labbok, M. 2015. ABM Position on Breastfeeding-Revised 2015. Breastfeeding Medicine: The Official Journal of the Academy of Breastfeeding Medicine, 10(9), 407–411.
Chaudhari, S., Bhalerao, M. R., Vaidya, U., Pandit, A. and Nene, U. 1997. Growth and development of twins compared with singletons at ages one and four years. Indian Pediatrics, 34(12), 1081–1086.
Delemarre-van de Waal, H. A. 1993. Environmental factors
influencing growth and pubertal development.
Environmental Health Perspectives, 101 Suppl 2, 39–44. Ekhard E. Ziegler, Steven E. Nelson 2010. Growth Charts
Compared. Importance of Growth for Health and Development vol 65, pp 197–212,
Harder, T., Bergmann, R., Kallischnigg, G. and Plagemann, A. 2005. Duration of breastfeeding and risk of overweight: a meta-analysis. Am J Epidemiol, 162(5), 397-403.
Hermanussen, M., Stec, K., Aßmann, C., Meigen, C. and Van Buuren, S. 2016. Synthetic growth reference charts: Synthetic Growth Reference Charts. American Journal of Human Biology, 28(1), 98–111.
Heydari, S.-T., Emamghoreishi, F. and Amini, M. 2009. Infants’ Growth Charts in Jahrom, Iran. Iranian Journal of Pediatrics, 19(1), 25–34.
Hosseini, S.-M., Maracy, M.-R., Sarrafzade, S. and Kelishadi, R. 2014. Child Weight Growth Trajectory and its Determinants in a Sample of Iranian Children from Birth until 2 Years of Age. International Journal of Preventive Medicine, 5(3), 348–355.
Karlberg, J., Cheung, Y. and Luo, Z. 2007. An update on the update of growth charts. Acta Paediatrica, 88(8), 797–802. Lee, S., Bountziouka, V., Lum, S., Stocks, J., Bonner, R., Naik, M., … Wells, J. C. K. 2014. Ethnic variability in body size, proportions and composition in children aged 5 to 11 years: is ethnic-specific calibration of bioelectrical impedance required? PloS One, 9(12), e113883.
Lee, G. and Ham, O. K. 2015. Factors Affecting Underweight and Obesity Among Elementary School Children in South Korea. Asian Nursing Research, 9(4), 298–304.
Majlesi, F. 2001. Growth Chart Study in Children Under 5 Years Old in Rural Area of Khoramabad Province. Iranian J. Publ. Health.
Natale, V. and Rajagopalan, A. 2014. Worldwide variation in human growth and the World Health Organization growth standards: a systematic review. BMJ Open, 4(1), e003735. Neu, J. and Rushing, J. 2011. Cesarean Versus Vaginal Delivery: Long-term Infant Outcomes and the Hygiene Hypothesis. Clinics in Perinatology, 38(2), 321–331. Ong, K. K. L., Preece, M. A., Emmett, P. M., Ahmed, M. L.,
Dunger, D. B. and ALSPAC Study Team. 2002. Size at birth and early childhood growth in relation to maternal smoking, parity and infant breast-feeding: longitudinal birth cohort study and analysis. Pediatric Research, 52(6), 863–867.
Raum E, Küpper-Nybelen J, Lamerz A, Hebebrand J, Herpertz-Dahlmann B, Brenner H. Tobacco smoke exposure before, during, and after pregnancy and risk of overweight at age 6. Obesity (Silver Spring) 2011;19:2411–7.
Smith, D. W., Truog, W., Rogers, J. E., Greitzer, L. J., Skinner, A. L., McCann, J. J. and Harvey, M. A. 1976. Shifting linear growth during infancy: illustration of genetic factors in growth from fetal life through infancy. J Pediatr, 89(2), 225-230.
Vafa, M., Moslehi, N., Afshari, S., Hossini, A. and Eshraghian, M. 2012. Relationship between breastfeeding and obesity in childhood. J Health Popul Nutr, 30(3), 303-310.
Zayed, A. A., Beano, A. M., Haddadin, F. I., Radwan, S. S., Allauzy, S. A., Alkhayyat, M. M., … Yousef, A.-M. F.
2016. Prevalence of short stature, underweight,
overweight, and obesity among school children in Jordan. BMC Public Health, 16(1), 1040.