IJPSR (2016), Vol. 7, Issue 8 (Research Article)
Received on 15 March, 2016; received in revised form, 19 July, 2016; accepted, 25 July, 2016; published 01 August, 2016
EVALUATION OF BINDING EFFECT OF PROSOPIS CINERARIA LEAF AND STEM BARK EXTRACTS WITH CALF THYMUS DNA
Stellaa Robertson* and N. Narayanan
Department of Pharmacognosy, Jaya College of Paramedical Sciences, College of Pharmacy, Thiruninravur - 602024, Tamil Nadu, India.
ABSTRACT: The present research aimed to evaluate the binding effect of hydroalcoholic extracts of leaf and Stem bark of Prosopis cineraria (PCL and PCB) with Calf Thymus (CT) DNA. The interaction of the PCL and PCB with Calf Thymus (CT) DNA has been studied using absorption spectra, viscosity measurements and cyclic voltammetry methods. It was observed that the PCL and PCB exhibited hypochromic and bathochromic shifts in the absorption spectra on binding to DNA which is a typical characteristic of DNA intercalation. In viscosity measurements, varying concentration of PCL and PCB causes a significant increase in viscosity of DNA. The variations of the cyclic voltammetric behavior of both extracts PCL and PCB was noted which demonstrate intercalative interaction between the PCL, PCB and the CT-DNA. In conclusion, both PCL and PCB possessed good DNA-binding abilities.
INTRODUCTION: The DNA binding assay forms a theoretic guide for the design of new anticancer drugs and chemical treatments of tumor and virus. They are also very valuable for probing the mechanism of the interaction between anticancer drugs and DNA and establish convenient methods to effectively choose specific anticancer drug. These associative interactions with the DNA molecules can cause dramatic changes in the physiological actions of DNA that might be responsible for the cytotoxic behaviour of the small molecules. Prosopis cineraria Linn is a large tree, which belongs to the family Mimosaceae.
QUICK RESPONSE CODE
DOI:
10.13040/IJPSR.0975-8232.7(8).3306-13
Article can be accessed online on:
www.ijpsr.com
DOI link: http://dx.doi.org/10.13040/IJPSR.0975-8232.7 (8).3306-13
The whole plant is used in the Indigenous System of Medicine as folklore remedy for various ailments like leprosy, dysentery, bronchitis, asthma, leucoderma, piles, muscular tremor and wandering of the mind. Water-soluble extract of the residue from methanol extract of the stem bark exhibits anti-inflammatory properties. Leaf paste of P. cineraria is applied on boils and blisters, including mouth ulcers in livestock and leaf infusion on open sores on the skin. The smoke of the leaves is considered good remedy for ailments of eye. The decoction of the bark in combination with the barks of Erythrina indica and Azadirachta indica is used in syphilis 1.
The literature survey reveals that the plant has been ascribed a variety of biological activity, viz.,
Antihyperglycemic, Antihyperlipidemic 2,
Antipyretic, Analgesic 3, Anticonvulsant 4, Antiatherosclerotic 5, Antidepressant, skeletal muscle relaxant effects 6, cytotoxic studies 7 and
Keywords:
Prosopis cineraria, Calf Thymus DNA, Stem bark, Leaf
Correspondence to Author: Dr. Stellaa Robertson
M.Pharm, Ph.D Professor and Head Dept. of Pharmacognosy,
Jaya College of Paramedical Sciences, College of Pharmacy, Thiruninravur – 602024, Tamil Nadu, India.
antitumor activity 8. The present study is designed to determine the binding effect of hydroalcoholic extracts of leaf and Stem bark of Prosopis cineraria (PCL and PCB) with Calf Thymus (CT) DNA.
MATERIALS AND METHOD: Plant material:
The plant specimens of P. cineraria were collected, identified and authenticated by Prof. P. Jayaraman, Director of Plant Anatomy Research Centre, West Tambaram, Chennai. A voucher specimen (No: A-43/PARC) has been deposited in the same Institution
Preparation of crude extract:
The leaves and stem bark were extracted separately with 50% alcohol by cold percolation process to yield the respective extracts. The hydroalcoholic extracts of leaf and stem bark of Prosopis cineraria (PCL and PCB) were reduced to a molten mass by using rotary vacuum evaporator. The residue was then stored in a desiccator.
Chemicals:
All reagents and chemicals were procured from Merck, Mumbai, India. The solvents used for electrochemical and spectroscopic studies were purified by standard procedures 9. DNA was purchased from Bangalore Genei (India). Agarose (molecular biology grade), ethidium bromide (EB) were obtained from Sigma, St.Louis (USA). Tris (hydroxymethyl) amino methane-HCl (Tris–HCl) buffer solution was prepared using deionized, sonicated triply distilled water.
Method:
All the experiments involving the interaction of PCL and PCB with CT DNA were carried out in Tris–HCl buffer (50mM Tris–HCl, pH 7.2) containing 5% ethanol at room temperature. A stock solution of CT DNA was prepared by dissolving the CT DNA in the Tris-HCl buffer. Solutions of CT DNA in the above buffer gave a ratio of UV absorbance at 260 and 280nm, A260/A280 of 1.87, indicating that the CT DNA was sufficiently free from protein. The CT DNA concentration per nucleotide was determined by absorption spectroscopy at 260nm using the molar absorption coefficient ε260 (6600M-1cm-1).
Absorption spectroscopic method:
The electronic absorption spectra were measured on a Shimadzu UV-1601 spectrophotometer in 5mM Tris-HCl buffer (pH 7.1) containing 50mM NaCl at room temperature. PCL and PCB were dissolved in absolute ethanol at a concentration of 5 × 10⁻³M. Working solutions were prepared by dilution of the PCL and PCB in the absolute ethanol in 5mM Tris-HCl buffer to concentration of 50μM.
Absorption titration experiments were performed by maintaining the extract concentration as constant at 50µM while varying the concentration of the CT DNA within 0 to 400µM. While measuring the absorption spectra, equal quantity of CT DNA was added to both the extract solution and the reference solution to eliminate the absorbance of CT DNA itself. From the absorption data, the intrinsic binding constant Kb was determined from the following equation (1):
[DNA]/(εa–εf) = [DNA]/(εb–εf) + [Kb(εb–εf)]–1 -- (1)
Where εa, εf, εb correspond to Aobsd /[extract], the extinction coefficient for the free extract, and the extinction coefficient for the extract in the fully bound form, respectively. A plot of [DNA]/ (εa–εf) versus [DNA], where [DNA] is the concentration of CT DNA in base pairs, gives Kb as the ratio of slope to intercept.
Viscosity measurements:
Viscosity experiments were carried on an Ostwald viscometer, immersed in a thermostated water-bath maintained at a constant temperature at 30.0 ± 0.1°C. DNA samples of approximately 0.5mM were prepared by sonicating in order minimize complexities arising from DNA flexibility. Flow time was measured with a digital stopwatch three times for each sample and an average flow time was calculated. Data were presented as (η/η0
)1/3 versus the concentration of the PCL and PCB, where η is the viscosity of DNA solution in the presence of complex, and η0
Electrochemical methods:
Cyclic voltammetric study was performed on a CHI 62˚C electrochemical analyzer with three electrode system of glassy carbon (GC) as the working electrode, a platinum wire as auxiliary electrode and Ag/AgCl as the reference electrode. All the voltammetric experiments were carried out in single-compartment cells of volume 5-15ml. Solutions were deoxygenated by purging with N2 prior to measurements. Increasing amounts of CT
DNA were added directly in to the cell containing the PCL and PCB solution (5 X 10⁻³M, 5mM Tris-HCl/50mM NaCl buffer, pH7.1). The concentration ranged from 0 to 400μM for CT DNA. The solution in the cuvette was thoroughly mixed before each scan. All the experiments were carried out at room temperature. The results of DNA binding experiment assay are tabulated in Table 1 to 3 and are shown in Fig.1 to 6.
TABLE 1: DATA SHOWING ABSORPTION SPECTRAL PROPERTIES OF PCL & PCB
S. no Extracts max
(nm)
H%=[(f–b)/f X100] Kb
(M-1)
Free Bound
1. PCL 276.5 273.0 3.5 25.4 4.6 х 106
[image:3.612.61.555.265.717.2]2. PCB 278.5 281.0 2.5 15.1 2.25 х 105
TABLE 2: DATA SHOWING ELECTROCHEMICAL PARAMETERS OF THE COMPOUND PCL
S.no R = [DNA]/
[PCL]
Ipc x 10-5 (A) Ipa x 10-5 (A) Epc (V) Epa (V) Ep (V) E1/2 (V)
1. 0 1.79 -3.16 -0.507 -0.58 0.073 0.543
2. 1 1.25 -3.42 -0.547 -0.573 0.026 0.560
3. 2 0.91 -3.63 -0.552 -0.567 0.015 0.560
4. 3 0.72 -3.62 -0.565 -0.552 0.013 0.558
R is the ratio of the concentration of the extract to that of DNA, (ΔEp)b = │Epa – Epc│ and (E
1/2)c = (Epa + Epc)/2
TABLE 3: DATA SHOWING ELECTROCHEMICAL PARAMETERS OF THE COMPOUND PCB
S.no R= [DNA]/[PCB] Ipc x 10-5 (A) Epc (V)
1. 0 9.6 -1.008
2. 1 9.4 -1.009
3. 2 9.2 -1.01
4. 3 8.7 -1.009
5. 4 8.1 -1.011
6. 5 7.4 -1.016
[image:3.612.129.496.496.720.2]R is the ratio of the concentration of the extract to that of DNA
FIG.2: ELECTRONIC ABSORPTION SPECTRA OF PCB IN THE ABSENCE (DASH LINE) AND PRESENCE (DARK LINE) OF INCREASING AMOUNTS OF DNA
FIG. 3: DATA SHOWING THE EFFECT OF PCL ON THE RELATIVE VISCOSITY OF CALF THYMUS DNA IN 5mM Tris– HCl/ 50mM NaCL BUFFER (pH7.1)
[image:4.612.127.484.286.486.2] [image:4.612.127.486.519.724.2]FIG.5: DATA SHOWING CYCLIC VOLTAMMOGRAM OF PCL
FIG.6: DATA SHOWING CYCLIC VOLTAMMOGRAM OF PCB
RESULTS AND DISCUSSION: In order to develop new antitumor drugs which specifically target DNA, it is necessary to understand the different binding modes a complex is capable of undertaking. Basically, plant extract interact with the double helix DNA in either a non-covalent or a covalent way. The former way includes three binding modes: intercalation, groove binding and external static electronic effects. Among these interactions, intercalation is one of the most important DNA binding modes as it invariably leads to cellular degradation. It was reported that the intercalating ability increases with the planarity of ligands 11. Valli et al demonstrated DNA cleavage studies by electrochemical methods and hydrogen peroxide out for the ethanol extract of
manjanathi fruits which possess DNA binding affinity 12. Mohanraj et al demonstrated the binding studyisolated compound of Murraya Koenigii with Calf thymus DNA 13.
Experiments with PCL and PCB showed analogous spectral changes. In all cases, a remarkable increasing in the absorbance around 260nm occurred. This can be indicative of classical intercalation of the extracts into DNA strands. Usually, upon DNA addition, the DNA band at 260nm shows a striking hyperchromism (increasing
absorbance) or hypochromism (decreasing
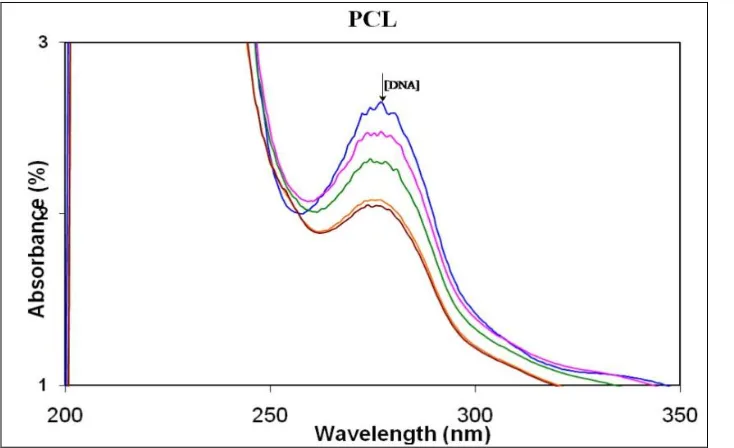
in presence of increasing amounts of CT DNA in 5mM Tris-HCl, 50mM NaCl, pH 7.2 buffers were observed. In the UV region, the intense absorption bands with maxima of 276.5nm and 273nm for PCL, whereas absorption bands 278.5 and 281nm for PCB, were attributed to intra ligand п - п* transition. On increasing the concentration of CT-DNA resulted in the hypochromism and red-shift in the UV-spectra of the PCL and PCB. These spectral characteristics suggested that the extract might bind to DNA by an intercalative mode due to strong stacking interaction between aromatic chromophore of PCL and PCB and base pairs of the DNA.
After intercalating the base pairs of DNA, the п* orbit of the intercalated PCL and PCB could couple with the п orbital of base pairs, thus decreasing the п – п* transition energy and further resulting in the blue-shift or red-shift. On the other hand, the coupling of п orbit was partially filled by electrons, thus decreasing the transition probabilities and concomitantly, resulting in the hypochromism.
In order to compare the binding strength of the complexes with CT DNA, the intrinsic binding constants Kb are obtained by monitoring the changes in the absorbance for the extracts with increasing concentration of DNA. Kb is obtained from the ratio of slope to the intercept from the plots of [DNA]/εa – εf) versus [DNA]. The Kb values are shown in Table 1.
The formation of a new adducts of PCL and PCB with DNA could be further confirmed by a spectroscopic experiment. The ultraviolet and visible absorption spectra of PCL and PCB in the absence and presence of DNA are shown (Fig.-1, 2). The PCL and PCB solution exhibited peculiar hypochromic and bathochromic shifts in the absorption spectra on binding to DNA, a typical characteristic of DNA intercalation.
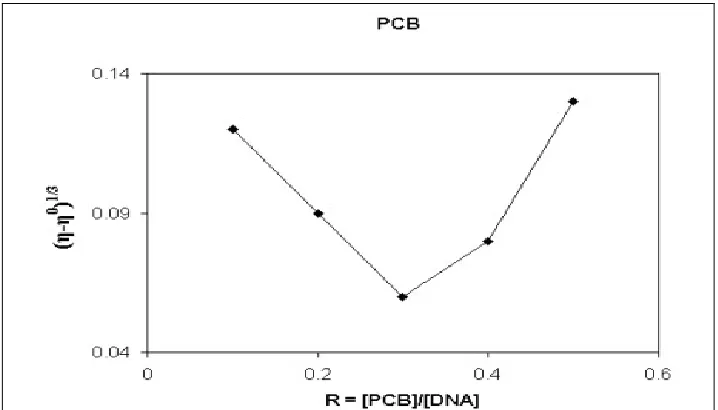
Spectroscopic data are necessary, but not sufficient to support a binding mode. As a means to further clarify the mode of binding of PCL and PCB to CT DNA, viscosity measurements were carried out by varying concentration of PCL and PCB. A classical intercalative mode causes a significant increase in viscosity of DNA due to an increase in separation
of base pairs at intercalation sites and hence an increase in overall DNA length. By contrast, PCL and PCB that bind exclusively in the DNA grooves by partial and/or non-classical intercalation, under the same condition, typically cause less positive or negative or no change in DNA solution viscosity.
Fig. 3, 4 shows as a slight increase in the flow time of DNA increasing concentration of PCL and PCB, which is not as pronounced as those observed for the classical intercalator ethidium bromide 14. This indicated that PCL and PCB preferred to engage in DNA groove binding or surface binding with its overall size resulting in an increase in DNA viscosity, rather than an intercalative DNA interaction.
Electrochemical methods have contributed
substantially to the understanding of anticancer agents and these have been used in cancer therapy in a variety of ways. Practical application of electrochemistry includes the determination of electrode reduction mechanisms. Due to the existing resemblance between electrochemical and biological reactions it has been assumed that the reduction mechanism staking place at the electrode and in the body share similar principles. On the other hand, analytical determination of drugs used in therapy is necessary in order to avoid toxic effects in treated patients. The development of new methods capable of determining minimal drug concentration, both in pharmacological compounds and in biological fluids, is important
In addition, it was found that DNA either the natural or denatured one (including thermal denaturation and sonic denaturation), almost has the same effect on the cyclic voltammetric behaviour of PCL and PCB. Cyclic voltammetric experiments were performed by maintaining the
concentration of BX while varying the
The incremental addition of CT DNA to the PCL causes a negative shift in E1/2 of 15mV and a decrease in Ep of 0.06 V. The ipc/ipa values also decrease in the presence of DNA. The decrease of the anodic and cathodic peak currents of the PCL in the presence of DNA is due to decrease in the apparent diffusion coefficient of the PCL binds with the DNA macromolecules. PCB show only the cathodic peak at -1.008 (Epc) and no reduction peak in the absence of DNA. Incremental addition of DNA on above extract shows a decrease in the current intensity and negative shift of the cathodic peak potential (Table 2). The resulting changes in the current and potential demonstrate interaction
between PCB and DNA (Table 3). The
electrochemical parameters of the PCL and PCB are shown in Fig.5, 6.
Since all the PCL and PCB are electroactive,
electrochemical methods such as cyclic
voltammetry can be used effectively to monitor their binding to DNA as a complement to the absorption spectral technique. In a typical cyclic voltammetric titration, a fixed concentration of the extracts was taken and DNA solution in buffer was added in different ratios as done in the absorption titration, and the voltammetric response was recorded. As observed in the UV experiments, an increase or decrease of the peak current was observed for extracts. The peak current increased initially and then decreased. The initial increase in the peak current is due to the absorption of the DNA bound complex onto the electrode surface 15.
The decrease in peak current on the addition of DNA to the complex is suggestive of an interaction between the complex and DNA 16, a decrease in the peak-to-peak separation was observed, which is consistent with non-coordinating intercalative binding of the complexes through the planar aromatic rings between the DNA base pairs 17. The formal potential Ef shift slightly towards the positive side and is attributed to characteristic behaviour of intercalation of the complexes into the DNA double-helix and suggests that extract bind to DNA at different rates 18.
The study reported that the variations of the cyclic voltammetric behaviour of PCL and PCB in an ethanol medium on addition of DNA can be used to
probe the interaction between these species and to electrochemically determine DNA. The results
reported that, rather straight forward
electrochemical methods can be used to
characterize the intercalative interaction between an anticancer drug or other electro active species and DNA and to calculate the binding constants and bindings it sizes.
The binding of the PCL and PCB to DNA likely induces a stiffening effect explaining the higher reduced dichroism value measured in the absorption band of the drug than in the DNA absorption band. This behaviour is typical of intercalating agents
CONCLUSION: DNA-binding properties of PCL and PCB have been investigated by various
methods such as electronic absorption,
fluorescence, and viscosity measurements. The binding of the PCL and PCB to DNA likely induces a stiffening effect explaining the higher reduced dichroism value measured in the absorption band of the drug than in the DNA absorption band. This behaviour is typical of intercalating agents. Therefore, it is concluded that PCL and PCB have been shown to possess good DNA-binding abilities.
ACKNOWLEDGEMENTS: The authors are highly thankful to Mr. Leo Robertson for providing the fund for the successful completion of the research work.
CONFLICT OF INTEREST: The authors declare no conflict of interest.
REFERNCES:
1. Stellaa R, Narayanan N, Deattu NR and Nargis R:
Comparative Anatomical Features of Prosopis cineraria
(L.) Druce and Prosopis juliflora (Sw.). International J. Green Pharmacy 2010; l4 (4): 275-280.
2. Sharma N, Garg V and Paul A: Antihyperglycemic,
Antihyperlipidemic and Antioxidative Potential of
Prosopis cineraria bark. Indian J Clin Biochem. 2010; 25 (2):193-200.
3. Joseph L, George M, Sharma A and Gopal N: Antipyretic
and analgesic effects of the aqueous extracts of Prosopis cineraria. Global J Pharmacol 2011; 5 (2): 73-77.
4. Velmurugan V, Arunachalam G and Ravichandran V:
Anticonvulsant Activity of Methanolic Extract of Prosopis
5. Purohit A, Ram H: Hypolipidemic and antiatherosclerotic
effects of Prosopis cineraria bark extract in
experimentally induced hyperlipidemic rabbits. Asian Journal of Pharmaceutical and Clinical Research 2012; 5 (3): 63- 76.
6. George M., Joseph L, Sharma A, Velmurugan V,
Arunachalam G and Ravichandran V: Antidepressant and skeletal muscle relaxant effects of the aqueous extract of the Prosopis cineraria. Brazialian J. Pharmaceutical Sciences 2012; 48: 578-581.
7. Stellaa Robertson, Narayanan N and Ravichandran V:
Investigation on the cytotoxic nature of leaf and stem bark extracts of Prosopis cineraria. Asian J Pharm Clin Res
2015; 8(2): 262-266
8. Stellaa Robertson, Narayanan N and Raj Kapoor:
Antitumor activity of Prosopis cineraria (L) Druce against
Ehrlich Ascites Carcinoma Induced Mice. Natural Product
Research 2011; 25(8): 1–7.
9. Perrin DD, Armarego WLF and Perrin DR: Purification of
Laboratory Chemicals, Pergamon Press, Oxford, England; 1980.
10. Chauhan M, Banerjee K and Arjmand F: DNA binding
studies of novel copper (II) complexes containing L-tryptophan as chiral auxiliary: In vitro antitumor activity of Cu-Sn2 complex in human neuroblastoma cells. Inorg.
Chem. 2007; 46(8): 3072–82
11. Xu H, Zheng KC, Deng H, Lin LJ, Zhang QL and Ji LN:
Effects of ligand planarity on the interaction of polypyridyl Ru (II) complexes with DNA. Dalton Trans. 2003; 3: 2260—2268.
12. Valli G, Murugalakshmi M and Mareeswari P: Evaluation
of antiinflammatory, analgesic and DNA binding studies of manjanathi fruit extract. International journal of research in pharmacy and chemistry 2014; 4(1): 61-66
13. Mohanraj V, Dhandapani M, Amirthaganesan G and Sekar
M: Extraction, Isolation, Characterization and DNA Binding Study of Carbazole Alkaloids from Murraya Koenigii (Curry Leaf). J. Environ. Nanotechnol. 2014; 3(1): 53-59
14. Wang XL, Chao H, Li H, Hong XL et al: DNA
interactions of cobalt (III) mixed-polypyridyl complexes containing asymmetric ligands. J Inorg Biochem. 2004; 98(6): 1143-50.
15. Yang ZS, Wang YL and Zhao GC: The Interaction of
copper-bipyridyl complex with DNA and cleavage to DNA. Anal. Sci. 2004; 20(8):1127-30
16. Annaraj J, Srinivasan S, Ponvel KM and Athappan P:
Mixed ligand copper (II) complexes of
phenanthroline/bipyridyl and curcumin diketimines as DNA intercalators and their electrochemical behavior under Nafion and clay modified electrodes. J. Inorg. Biochem. 2005; 99(3): 669-76
17. Lu X, Zhang M, Kang J, Wang X et al: Electrochemical studies of kanamycin immobilization on self-assembled monolayer and interaction with DNA. J. Inorg. Biochem. 2004; 98(4): 582-8
18. Vaidyanathan VG, Nair BU: Synthesis, characterization
and electrochemical studies of mixed ligand complexes of
ruthenium (II) with DNA. Dalton Trans 2005; 2842-8.
All © 2013 are reserved by International Journal of Pharmaceutical Sciences and Research. This Journal licensed under a Creative Commons Attribution-NonCommercial-ShareAlike 3.0 Unported License.
This article can be downloaded to ANDROID OS based mobile. Scan QR Code using Code/Bar Scanner from your mobile. (Scanners are available on Google Playstore)
How to cite this article:
Robertson S and Narayanan N:Evaluation of binding effect of Prosopis cineraria leaf and stem bark extracts with calf thymus DNA. Int J