ISSN: 1992-8645 www.jatit.org E-ISSN: 1817-3195
SINGLE CHANNEL SPEECH ENHANCEMENT USING IDEAL
BINARY MASK TECHNIQUE BASED ON
COMPUTATIONAL AUDITORY SCENE ANALYSIS
1ABRAR HUSSAIN, 2KALAIVANI CHELLAPPAN, 3SITI ZAMRATOL M
1
MSc. Student, Department of Electrical, Electronic and Systems Engineering, Faculty of Engineering and
Built Environment, Universiti Kebangsaan Malaysia
2
Senior Lecturer, Department of Electrical, Electronic and Systems Engineering, Faculty of Engineering
and Built Environment, Universiti Kebangsaan Malaysia
3
Professor, Institute of Ear, Hearing & Speech, Universiti Kebangsaan Malaysia
E-mail: [email protected], [email protected], [email protected]
ABSTRACT
Single channel speech enhancement is necessary where the multichannel speech enhancement is not feasible due to space constraints in the intended device and cost-effectiveness. However, the problem of having limited information from single channel sound signal mixtures or unavailability of the speech source signals makes it more difficult to separate the target speech from the background maskers in the acoustic environment of low signal to noise ratio, in various background noises and in less temporal duration of speech signals. To address these problems, computational auditory analysis became popular from the last decade as a new concept for speech enhancement. In this paper, ideal binary mask which is inspired by the computational auditory analysis is used to analyze and synthesize the input speech signals and masker signals in the time-frequency domain, where all the signals usually overlap. Synthesized signals are evaluated for speech quality measurement in terms of segmental signal-to-noise ratio. This study uses Malay language based speech as input speech signals. These input speech signals vary in duration due to their word structure. Large crowd babble speech and two talker competing speech are employed as masker signals. The input signal-to-noise ratio is varied from -5 dB to +15 dB in steps of 5 dB to vary the difficulty level of acoustic environment. Results show that ideal binary mask algorithm reconstructs the target speech signals efficiently from the degraded and noisy speech signals. This is signified by the high segmental signal-to-noise ratio even in the lowest input signal-to-noise ratio. This type of high noise reduction is necessary to lessen the burden of elderly listener’s listening effort in noisy environment.
Keywords:Speech Enhancement, Ideal Binary Mask, Time-Frequency Masking, Computational Auditory Scene Analysis, Speech Quality
1. INTRODUCTION
Human speech communication typically degrades in cocktail party environment [1] which consists of complex acoustic backgrounds with environmental sound sources, competing voices, and ambient noise. Thus a possible extension of this limitation is that signals become more intricate to separate as their duration decreases, as there is less of an opportunity to collect the statistics of signals involved [2]. To solve these problems in machine-to-man communication is a big challenge. Therefore, many single channel speech enhancement techniques have been developed in the
ISSN: 1992-8645 www.jatit.org E-ISSN: 1817-3195 using machine learning algorithms or techniques
[11]. CASA analysis ensures the monaural hearing with the signal to noise ratio (SNR) improvement in the best ear (BE) [12]. It further eases the spatial release from masking (SRM) [13]. By the same token, listeners who have problems of decreased temporal resolution and audibility in acoustic environment of low signal-to-noise-ratio [1] can get remediation from increased output SNR developed by CASA technique mostly for automatic speech recognition. In single channel speech enhancement, CASA generates time-frequency masks to weight the different time-frequency regions, emphasizing regions dominated by the target speech and suppressing regions dominated by noise. Under CASA models, T-F masking technique is based on time-frequency (T-F) representation of signals. CASA model utilizes the temporal and spectral properties of speech [14]. An important quality of T-F masking is the availability of a reference mask, which defines the maximum obtainable speech intelligibility for a given mixture [15]. T-F representation can be obtained either by a short-time Fourier transform (STFT) [16] or a windowed auditory filterbank in the form of a cochleagram [17-20]. T-F masking is applicable to source separation/ segregation using one microphone [21], [22] or more than one microphone [23], [24]. T-F separation methods apply a mask on top of the observed spectrogram to separate the desired (speech) signal from interference. T-F masking can also be applied as a binary mask by identifying and grouping spectro-temporal regions in the mixture belonging to the same source. The ideal binary mask (IBM) can be considered as the goal of CASA [25-28] and optimality of IBM can be found in terms of SNR [29] with the consideration of signal overlaps in T-F domain [30]. IBM is a binary classification technique for speech separation (masking or release from masking) and speech enhancement which is inspired by the auditory scene analysis and auditory masking [31] phenomenon. It has the advantage that only binary decision has to be made and runs in an iterative mood until all the sources are estimated. It is known from psychoacoustics that the ear perceives only the dominant signal within each frequency band and that weaker signals are masked by the strongest one. Thus it makes sense to attenuate time-frequency cells in which the SNR is so poor [14]. It does not require number of sources [32].
Ideal binary masking have been used for many research based on speech intelligibility varying SNR levels, masker types, and local criteria for forming the binary mask [33] in background noise
like cafeteria background [34], speech shaped noise (SSN) [19], speech babble, modulated SSN [35], modulated and unmodulated SSN, two-talker masker [35], competing speech, single competing talker using IBM. Babble noise is most difficult to separate from speech [37]. A study [36] on monaural speech separation with the aim of improving speech quality these experiments implicate the use of IBM in speech separation and hence speech enhancement [34].
Thresholding of local SNR criterion (LC), which is used to generate IBM, can be varied (0 dB ≥LC ≥-12 dB) depending on the application using 1–3 competing utterances of the same talker [19], wider plateaus of LC values (+5 dB ≥LC ≥-20 dB) [37]. The study [19] suggest that the choice of LC=−6 dB, which lies near the center of the performance plateau, may be better than the commonly used 0 dB LC for intelligibility improvement A condition of LC =0 dB has the optimal SNR gain among all the binary masks [25], [29]. As a separation technique, applying the IBM with LC=0 dB to the mixture input retains the T-F regions of the mixture where target energy is stronger than interference energy while removing the T-F regions where target energy is weaker than interference energy. Also the researches [38], [39] use classification method to separate speech for determined and underdetermined mixture. Experiments applying the ideal binary mask to noisy speech have documented a substantial improvement in intelligibility.
Computed binary masks may cause musical noise or cross-talk problems [40], which also lead to poorer speech perceptual quality. In [41], musical noise is reduced by employing finer frame shifts [11] when generating T-F representations, i.e., the overlap amount between successive time frames in a T-F representation is increased beyond the commonly used 50%. These methods reduce the effects of musical noise.
ISSN: 1992-8645 www.jatit.org E-ISSN: 1817-3195 terms of speech quality in this condition.
Additionally, SNR threshold is chosen as 0 dB to ensure optimal SNR gain in terms of speech quality improvement. SNR level of mixtures and type of maskers are varied for determining the speech quality of output speech signals.
2. IDEAL BINARY MASK
Particularly, within T-F unit u(t, f), let the s(t, f) denotes the target energy and n(t, f) denote masker energy, both in dB. The ideal binary mask (IBM) is defined as,
IBM (t,f) = 1 if s(t, f) − n(t, f) > LC (1)
0 otherwise
The threshold, LC (stands for local signal-to-noise ratio [SNR] criterion) in dB is usually chosen to be 0, producing a 0-dB SNR criterion. The IBM thus constructed gives the highest SNR gain of all the binary masks considering clean target as the signal [42], [22], [29]. With LC =0 dB, each T-F mask value is allocated to a single target only. The IBM is defined by comparing the signal-to-noise ratio within each T-F unit against a local criterion (LC) or threshold measured in units of decibels. Only the T-F units with local signal to noise ratio (SNR) goes over the LC, then are assigned 1 in the binary mask. An IBM segregated signal can be synthesized from the mixture by deriving a gain from the binary mask, and applying it to the mixture before recombination
3. SHORT-TIME FOURIER TRANSFORM
The non-stationary nature of speech prompts the analysis of speech signals in both the time and frequency domains concurrently. The classical Fourier analysis represents the frequency content of a signal, but it does not give information about the time of appearance of frequency components or sudden changes of energy. The statistics of speech signals vary with time, and their frequency content can only be considered stationary in short-time segments around 20 msec. In a time-frequency representation, the time-frequency domain only reflects the behavior of a short time segment of the signal. The most used time-frequency representations of speech signals are the short-time Fourier transform (STFT). STFT is used in speech
separation and machine listening [43-52]. This paper uses the STFT for T-F analysis of target speeches and maskers. To be added, for the synthesis part, this research uses binary masking using the STFT [36]. The binary mask is multiplied with the FFT magnitudes, and the inverse FFT is applied to the modified magnitudes using the phases from the unmodified input signal. Finally, the resulting short time segments from the inverse FFT are combined using the overlap-add-method (OLA). The choice of the window is important to obtain perfect reconstruction. Some widely used windows are the Hamming and Hanning windows [53], [54], which have into account frequency resolution and sidelobe behavior. In this research, gammatone filterbank is not used because perfect reconstruction of the signal is not possible [55].
4. METHODOLOGY
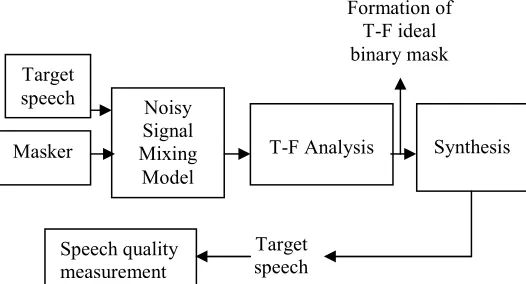
An overall block diagram for speech enhancement using time-frequency IBM is depicted in Figure 1.
[image:3.612.314.577.377.519.2]
Figure 1: Speech Enhancement Using IBM
From Figure 1 it is observed that target speech and masker signal in two different channels are first mixed according to linear mixing technique. The mixed signals are on one channel and pass to the separation algorithm to form the T-F ideal binary mask. This mask works on the mixed signals to synthesize it and to extract the target speech. After that target speech is further measured for speech quality.
4.1 Data Preparation
Recorded speech data are used for the simulation purpose. For the target speech to be
Target speech
Masker
Noisy Signal Mixing
Model
T-F Analysis Synthesis
Target speech Speech quality
measurement
ISSN: 1992-8645 www.jatit.org E-ISSN: 1817-3195 extracted, this speech is a Malay language based
sentence file consists of three words, four words, five words. The duration of samples vary with the number of words within each sentence file. These speech samples are based on Malay language which is culturally fit and semantically meaningful. The masker data is denoted as competing speech which is a two male-talker speech who speaks simultaneously. The other masker is large-crowd babble speech. Moreover, babble speech and competing speech are known as real world noises. In most audiology system for hearing test, these two noises are common to be used as distracters. These data sets are chosen because of the resemblance within the recordings and all of them are speech only without any dissimilar samples like music. Therefore, this reinforces the comparison among the datasets. All the sound files are in ‘.wav’ format and sampled at 44.1 kHz having 16 bit. All the mixtures are artificial as the recorded sound files are mixed digitally. All the sound files are level normalized between -26 dB to –27 dB to have the same average power. Table 1 describes the characteristics of data.
4.2 Noisy Signal Mixing Model
The noisy mixing model is the simplest model and it assumes that the signals received by the microphones are just a scaled version of the original signals (target speech and masker), and it is expressed as, M m t m t n mn t
m
a
s
n
x
N n ,..., 2 , 1 ), ( ) ( . ) ( 1 = + =∑
= (2)where amn are the scaling factors. In this case,
hmn(t) = amn . δK(t), where δK(t) is the Kronecker
delta function and nm(t) represents the noise at the
m-th sensor. The first part of the right hand side of equation (2) is the linear mixing of target speech and masker. Here, target speech is amplitude scaled. Additive noise distortion is assumed in the second part of the equation (2). Finally a noisy mixing model is formed.
Table 1: Speech Data
4.3 T-F Analysis
As IBM is considered, both the target speech and masker is available for mixing. Discrete-time STFT is performed on the noisy signal and clean target speech signal. In T-F analysis process, prior to STFT analysis, noisy and clean signals are gone through the transformation from vector to frames. It actually splits signal into overlapped frames using indexing. Windowing technique is applied to each frame and return frames as rows of the output matrix. Consequently, STFT analysis is performed on both noisy signal and clean signal.
4.4 Formation of Ideal Binary Mask and Synthesis of Ideal Binary Masked Signal
Formation of IBM is crucial part for improving speech quality. Speech quality is improved if IBM retains the most of the energy of the target speech. Formation of ideal binary mask is occurred as FFT based short-time spectral analysis-modification-synthesis, with frame duration of TW msec and frame shift of
TS msec. Spectral modification performed is
the application of an ideal binary mask to noise corrupted speech signal. According to equation (1), the ideal binary mask is computed from an oracle (true) signal-to-noise ratio (SNR) by thresholding with local SNR criterion specified in LC. In this case the threshold is fixed and does not change with the mixing SNR [56]. IBM is applied on the noisy mixture and modified complex spectrum is created. For synthesis part, inverse STFT is applied on IBM
Target Speech Type of speech signal
Number of samples POKOK BUNGA
CANTIK
3 word Sentence 74999
PROJEK PEMBERISHAN
LONKANG
3 word Sentence 80415
ABANG SUKA MANDI SUNGAI
4 word Sentence 88710
LUMPUR MEMENUHI JALAN
RAYA
4 word Sentence 109254
BANYAK HAIWAN MATI AKIBAT PEMBALAKAN
5 word Sentence 138855
PENCEMARAN TELAH MEMUSNAHKAN
HIDUPAN LAUT
ISSN: 1992-8645 www.jatit.org E-ISSN: 1817-3195 segregated signal. After that synthesized
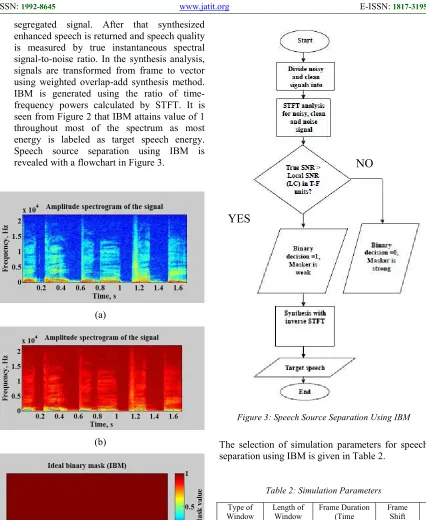
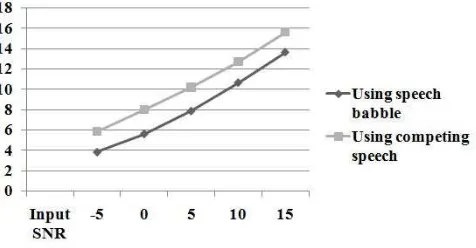
enhanced speech is returned and speech quality is measured by true instantaneous spectral signal-to-noise ratio. In the synthesis analysis, signals are transformed from frame to vector using weighted overlap-add synthesis method. IBM is generated using the ratio of time-frequency powers calculated by STFT. It is seen from Figure 2 that IBM attains value of 1 throughout most of the spectrum as most energy is labeled as target speech energy. Speech source separation using IBM is revealed with a flowchart in Figure 3.
(a)
(b)
(c)
[image:5.612.313.517.69.479.2]Figure 2: Formation of IBM (a) Target Speech (b) Masker Signal (c) IBM Signal
Figure 3: Speech Source Separation Using IBM
The selection of simulation parameters for speech separation using IBM is given in Table 2.
Table 2: Simulation Parameters
Type of Window and FFT Analysis Length
Length of Window
Frame Duration (Time Resolution)
(msec)
Frame Shift
(msec)
LC Value
(dB)
Frequ ency Resol ution
(Hz)
Hanning, 2048 samples
1024 samples
23.2 2.9 0 43
NO
[image:5.612.94.520.75.595.2]ISSN: 1992-8645 www.jatit.org E-ISSN: 1817-3195 In the analysis of speech signals, the window length
should guarantee stationarity (i.e around 20 ms), and that value depends on the sampling rate. For instance, if the sampling rate is 44100 Hz, a window of 1024 samples provides a time resolution of 23.2 msec. Frame shift is usually chosen as around half of the frame duration and hence 2.9 msec. With this frame shift overlap between the frames is set to 87.5%. This is set to avoid artifacts at the boundaries. LC value is chosen as 0dB to ensure good speech quality when synthesized. FFT length is chosen to 2048 samples. A high frequency resolution of 43 is chosen to obtain good performance in speech quality.
4.5 Measurement of Speech Quality
The measurement of speech quality using SNR generates a single number that benefit for evaluating the performance of a separation system compared to others, and it remains the most widely used performance metrics though there are still some shortcomings. In this paper, Segmental SNR is used because speech energy fluctuates over time, and so portions where the speech energy is large, and noise is relatively inaudible, should not be washed out by other portions where speech energy is small and noise can be heard over speech. Thus SNR is calculated in short frames and the averaged. Segmental SNR can be defined as,
∑ − +
=
− ∑
− +
= ∑
−
= =
1 2
)} ( ^ ) ( {
1 ) ( 2 1
0 10 log 10
L Lk
Lk n
n x n x L Lk
Lk n
n x P
k P
SNRseg (3)
Equation (3) has frame length of L and P is the number of frames in the signal (N=PL). Frame length is normally set between 15 msec and 20 msec. A typical value of SNRseg has upper and
lower ratio limit is 35 db and -10 dB [57].
5 RESULTS AND DISCUSSION
Figure 4 to Figure 9 show segmental SNR for target speech (sentences) which are mixed with speech babble and competing speech under different input SNR ranging from -5 dB to +15 dB. Input SNR value of -5 dB denotes the lowest SNR and +15 dB is the highest SNR for an acoustic environment. As such, -5 dB indicates worst acoustic environment and +15
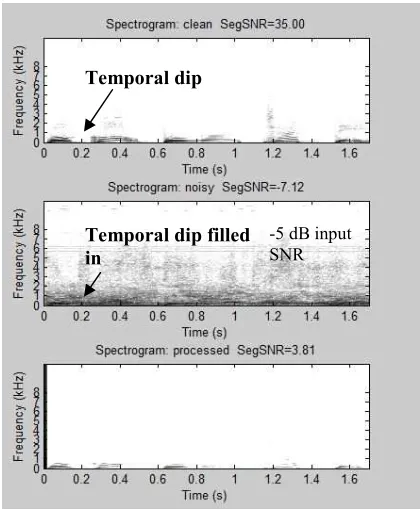
dB indicates best acoustic environment. This input SNR values are increased at steps of +5 dB. These values are chosen as in [58]. Generally, as the input SNR increases, speech quality increases which is confirmed by the high value of output segmental signal-to-noise ratio for all sentences. Segmental SNR finds it’s value high for competing speech when mixed with the target speech (words) compared to speech babble while mixed with target speech (sentences). This is true for all input SNR. This further implies that target speech is hard to separate from speech babble as spectral and temporal dips are filled in as the number of talker increases and hence energetic masking is introduced. This is shown in Figure 10 and in Figure 11. Comparing Figure 10 and Figure 11 it can be said that SNR has been improved of around 2 dB while target speech is recovered from competing speech. Additionally, as the input SNR increases, target speeches are separated from the two different types of masker with an ease of the gradual increase of segmental SNR values. To be more, as the duration of speech samples are increased, output segmental SNR is increased. Therefore, 5 word speech signals show better quality for both the babble speech and two-talker competing speech. This is true for all input SNR. The underlying reason is that temporal resolution of the speech signals increase with the increase of duration of speech signals.
[image:6.612.317.555.498.622.2]
ISSN: 1992-8645 www.jatit.org E-ISSN: 1817-3195
Figure 5: Measured Speech Quality for ‘PROJEK PEMBERISHAN LONKANG’ [image:7.612.95.569.69.212.2]
Figure 6: Measured Speech Quality for ‘ABANG SUKA MANDI SUNGAI’
Figure 7: Measured Speech Quality for ‘LUMPUR MEMENUHI JALAN RAYA’
Figure 8: Measured Speech Quality for ‘BANYAK HAIWAN MATI AKIBAT PEMBALAKAN’
[image:7.612.312.522.272.527.2]
Figure 9: Measured Speech Quality for ‘PENCEMARAN TELAH MEMUSNAHKAN HIDUPAN LAUT’
Figure 10: Recovering of Target Speech from Babble Speech
Temporal dip
Temporal dip filled in
[image:7.612.93.303.540.629.2]ISSN: 1992-8645 www.jatit.org E-ISSN: 1817-3195
Figure 11: Recovering of Target Speech from Competing Speech
6 CONCLUSION
The purpose of this research is to evaluate the speech quality in terms of segmental SNR which works as an objective measurement. In general, it is found that output segmental SNR is improved for the extraction of speech signals from the mixer containing speech and two-talker competing speech even though the input SNR is low enough. Nevertheless, speech signals mixed with babble speech are extracted with less SNR value. Moreover, musical noise is reduced by using smaller frame shift in the STFT process. Thus overall, good quality and good intelligibility of speech signals is obtained. The outcome from this study will be used as a parallel assessment that can be integrated in audiologist-patient response protocol in auditory training software, so that audiologist can control the pre-defined input SNR value of any range from their end. This can help them for identifying which input SNR yields best segmental SNR to ensure the best speech quality and to reduce speech artifacts like musical signals as well. The other implication is that listening effort or loudness will be much minimized as the output SNR is >15 dB for all speech materials in case of high input signal-to-noise ratio. This implication can
be used in speech in noise training and other audiology applications in hearing aid, cochlear implants.
ACKNOWLEDGEMENT
This research work is supported by Universiti Kebangsaan Malaysia LRGS grant (LRGS/BU/2012/UKM-UKM/K/02) sponsored by Ministry of Higher Education (MOHE), Malaysia.
REFERENCES
[1] Cherry EC. Some experiments on the recognition of speech, with one and with two ears. The Journal of the acoustical society of America. 1953 Sep 1;25(5):975-979.
[2] Hussain A, Chellappan K, Zamratol M. Evaluation of multichannel speech signal separation with beamforming techniques. InBiomedical Engineering and Sciences (IECBES), 2014 IEEE Conference on 2014 Dec 8 (pp. 766-771). IEEE.
[3] Boll SF. Suppression of acoustic noise in speech using spectral subtraction. Acoustics, Speech and Signal Processing, IEEE Transactions on. 1979 Apr;27(2):113-20.
[4] Berouti M, Schwartz R, Makhoul J. Enhancement of speech corrupted by acoustic noise. InAcoustics, Speech, and Signal Processing, IEEE International Conference on ICASSP'79. 1979 Apr (Vol. 4, pp. 208-211). IEEE.
[5] Virag N. Single channel speech enhancement based on masking properties of the human auditory system. Speech and Audio Processing, IEEE Transactions on. 1999 Mar;7(2):126-37.
[6] Hartley RV. The interpolation, extrapolation and smoothing of stationary time series. NDRC report, Wiley. 1949.
[7] Donoho DL, Johnstone JM. Ideal spatial adaptation by wavelet shrinkage. Biometrika. 1994 Sep 1;81(3):425-55.
[8] McAulay RJ, Malpass ML. Speech enhancement using a soft-decision noise suppression filter. Acoustics, Speech and Signal Processing, IEEE Transactions on. 1980 Apr;28(2):137-45.
[9] Lim JS, Oppenheim AV. Enhancement and bandwidth compression of noisy speech. Proceedings of the IEEE. 1979 Dec;67(12):1586-604.
Temporal dip
Temporal dip does not filled in
ISSN: 1992-8645 www.jatit.org E-ISSN: 1817-3195 [10] Cappé O. Elimination of the musical noise
phenomenon with the Ephraim and Malah noise suppressor. IEEE Transactions on Speech and Audio Processing. 1994 Apr 1;2(2):345-9.
[11] Alvarez DA, Zurera MR, Pita RG. Speech enhancement algorithms for audiological
applications (Doctoral dissertation, Ph. D
thesis).
[12] Hawley ML, Litovsky RY, Culling JF. The benefit of binaural hearing in a cocktail party: Effect of location and type of interferer. The Journal of the Acoustical Society of America. 2004 Feb 1;115(2):833-43.
[13] Bronkhorst AW. The cocktail party phenomenon: A review of research on speech intelligibility in multiple-talker conditions. Acta Acustica united with Acustica. 2000 Jan 1;86(1):117-28.
[14] Gonzalez S. Analysis of very low quality speech
for mask-based enhancement (Doctoral
dissertation, Imperial College London). [15] Boldt J, Kjems U, Pedersen MS, Lunner T,
Wang D. Estimation of the ideal binary mask using directional systems. InIWAENC 2008. International Workshop on Acoustic Echo and Noise Control 2008 Sep.
[16] Allen JB. Short term spectral analysis, synthesis, and modification by discrete Fourier transform. InIEEE Trans. on Acoust., Speech, and Sig. Proc. 1997 (Vol. 4, pp. 21-24).
[17] Wang D, Brown GJ. Computational auditory scene analysis: Principles, algorithms, and applications. Wiley-IEEE Press; 2006 Sep 1. [18] Brown GJ, Cooke M. Computational auditory
scene analysis. Computer Speech & Language. 1994 Oct 31;8(4):297-336.
[19] Brungart DS, Chang PS, Simpson BD, Wang D. Isolating the energetic component of speech-on-speech masking with ideal time-frequency segregation. The Journal of the Acoustical Society of America. 2006 Dec 1;120(6):4007-18.
[20] Anzalone MC, Calandruccio L, Doherty KA, Carney LH. Determination of the potential benefit of time-frequency gain manipulation. Ear and hearing. 2006 Oct;27(5):480.
[21] Wang DL, Brown GJ. Separation of speech from interfering sounds based on oscillatory correlation. Neural Networks, IEEE Transactions on. 1999 May;10(3):684-97.
[22] Hu G, Wang D. Monaural speech segregation based on pitch tracking and amplitude modulation. Neural Networks, IEEE Transactions on. 2004 Sep;15(5):1135-50. [23] Roman N, Wang D, Brown GJ. Speech
segregation based on sound localization. The Journal of the Acoustical Society of America. 2003 Oct 1;114(4):2236-52.
[24] Yilmaz O, Rickard S. Blind separation of speech mixtures via time-frequency masking. Signal Processing, IEEE transactions on. 2004 Jul;52(7):1830-47.
[25] Wang D. On ideal binary mask as the computational goal of auditory scene analysis. InSpeech separation by humans and machines 2005 (pp. 181-197). Springer US.
[26] Hu G, Wang D. An auditory scene analysis approach to monaural speech segregation. Topics in acoustic echo and noise control. 2006 Aug 26:485-515.
[27] Hu G, Wang D. Segregation of unvoiced speech from nonspeech interference. The Journal of the Acoustical Society of America. 2008 Aug 1;124(2):1306-19.
[28] Hu G, Wang D. Speech segregation based on pitch tracking and amplitude modulation. InApplications of Signal Processing to Audio and Acoustics, 2001 IEEE Workshop on the 2001 (pp. 79-82). IEEE.
[29] Li Y, Wang D. On the optimality of ideal binary
time–frequency masks. Speech
Communication. 2009 Mar 31;51(3):230-9. [30] Pedersen MS, Wang D, Larsen J, Kjems U.
Overcomplete blind source separation by combining ICA and binary time-frequency masking. In2005 IEEE International Workshop on Machine Learning for Signal Processing 2005 Sep 28 (pp. 15-20).
[31] Moore BC. An introduction to the psychology of hearing (Academic, San Diego). and. 1997;313:159-67.
[32] Anandkumar AJ, Ghosh TA, Damodaram BT, Sumam DS. Underdetermined blind source separation using binary time-frequency masking with variable frequency resolution. InTENCON 2008-2008 IEEE Region 10 Conference 2008 Nov 19 (pp. 1-6). IEEE. [33] Kjems U, Boldt JB, Pedersen MS, Lunner T,
ISSN: 1992-8645 www.jatit.org E-ISSN: 1817-3195 [34] Wang D, Kjems U, Pedersen MS, Boldt JB,
Lunner T. Speech intelligibility in background noise with ideal binary time-frequency masking. The Journal of the Acoustical Society of America. 2009 Apr 1;125(4):2336-47.
[35] Li N, Loizou PC. Factors influencing intelligibility of ideal binary-masked speech: Implications for noise reduction. The Journal of the Acoustical Society of America. 2008 Mar 1;123(3):1673-82.
[36] Li P, Guan Y, Xu B, Liu W. Monaural speech separation based on computational auditory scene analysis and objective quality assessment of speech. Audio, Speech, and Language Processing, IEEE Transactions on. 2006 Nov;14(6):2014-23.
[37] Jiang Y, Zhou H, Feng Z. Performance analysis of ideal binary masks in speech enhancement. InImage and Signal Processing (CISP), 2011 4th International Congress on 2011 Oct 15 (Vol. 5, pp. 2422-2425). IEEE.
[38] Dubnov S, Tabrikian J, Arnon-Targan M. Speech source separation in convolutive environments using space-time-frequency analysis. EURASIP Journal on Applied Signal Processing. 2006 Jan 1;2006:172-.172. [39] Harding S, Barker J, Brown GJ. Mask
estimation for missing data speech recognition based on statistics of binaural interaction. Audio, Speech, and Language Processing, IEEE Transactions on. 2006 Jan;14(1):58-67.
[40] Madhu N, Breithaupt C, Martin R. Temporal smoothing of spectral masks in the cepstral domain for speech separation. InAcoustics, Speech and Signal Processing, 2008. ICASSP 2008. IEEE International Conference on 2008 Mar 31 (pp. 45-48). IEEE.
[41] Araki, S., Makino, S., Sawada, H., and Mukai, R. (2005). “Reducing musical noise by a fine-shift overlap-add method applied to source separation using a time-frequency mask,” in Proceedings of ICASSP, Vol. 3, pp. 81–84. [42] Ellis, D. (2006). Model-based scene analysis. In
D. L. Wang & G. J. Brown (Eds.),Computational auditory scene
analysis: Principles, algorithms, and
applications (pp.115-146). Hoboken, NJ:
Wiley/IEEE Press.
[43] Grais E, Sen M, Erdogan H (2014) “Deep neural networks for single channel source separation”, in Acoustics, Speech and Signal Processing (ICASSP), 2014 IEEE Int. Conf. on, pp. 3734-3738.
[44] Huang PS, Kim M, Hasegawa-Johnson M, Smaragdis P, “Deep learning for monaural speech separation”, in Acoustics, Speech and Signal Processing (ICASSP), 2014 IEEE Int. Conf. on., pp. 1562-1566.
[45] Simpson AJR (2015) “Probabilistic Binary-Mask Cocktail-Party Source Separation in a Convolutional Deep Neural Network”, arxiv.org abs/1503.06962.
[46] Simpson AJR, Roma G, Plumbley MD (2015) “Deep Karaoke: Extracting Vocals using a Convolutional Deep Neural Network”, arxiv.org abs/1504.04658.
[47] Abrard F, Deville Y (2005) “A time–frequency blind signal separation method applicable to underdetermined mixtures of dependent sources”, Signal Processing 85: 1389-1403. [48] Ryynanen M, Virtanen T, Paulus J, Klapuri A
(2008) “Accompaniment separation and karaoke application based on automatic melody transcription”, In Multimedia and Expo, 2008 IEEE International Conference on, pp. 1417-1420.
[49] Raphael C (2010) “Music plus one and machine learning”, In Proc. 27th Int. Conf. on Machine Learning (ICML-10), pp. 21-28.
[50] Grais EM, Erdogan H (2011) “Single channel speech music separation using nonnegative matrix factorization and spectral masks”, In Digital Signal Processing (DSP), 2011 17th International Conference on, pp. 1-6, IEEE. [51] Lee DD, Seung HS (2001) “Algorithms for
non-negative matrix factorization”, In Advances in neural information processing systems, pp. 556-562.
[52] Simpson AJR (2015) “Deep Transform: Cocktail Party Source Separation via Complex Convolution in a Deep Neural Network”, arXiv:1504.02945
[53] Harris FJ. On the use of windows for harmonic analysis with the discrete Fourier transform. Proceedings of the IEEE. 1978 Jan;66(1):51-83.
[54] Nuttall AH. Some windows with very good sidelobe behavior. Acoustics, Speech and Signal Processing, IEEE Transactions on. 1981 Feb;29(1):84-91.
[55] Hohmann V. Frequency analysis and synthesis using a Gammatone filterbank. Acta Acustica united with Acustica. 2002 May 1;88(3):433-42.
ISSN: 1992-8645 www.jatit.org E-ISSN: 1817-3195 single channel noise reduction systems:
Application to auditory prostheses. Audio, Speech, and Language Processing, IEEE Transactions on. 2013 Jan;21(1):63-72. [57] Hansen JH, Pellom BL. An effective quality
evaluation protocol for speech enhancement algorithms. InICSLP 1998 Dec (Vol. 7, pp. 2819-2822).