Full Length Research Article
OPTIMIZATION OF CHEESE WHEY BASED MEDIA COMPONENTS FOR LACTIC ACID PRODUCTION
BY LACTOBACILLUS CASEI USING RESPONSE SURFACE METHODOLOGY
*1
Bijal Patel and
2Dr. Vinayak Patel
1
Smt Kamlaben P. Patel College of Home Science, Anand Pepole’s Medicare Society, Anand
2Department of Home Science, (Laboratory of Food Bitechnology), Sardar Patel University,
Vallabh Vidyanager, Gujarat
ARTICLE INFO ABSTRACT
The present study was carried out to optimize cheese whey media composition for maximum lactic acid production by Lactobacillus casei using Response Surface Methodology. Four media components i.e. CSL, K2HPO4, MgSO4, and Sodium acetate were subjected for optimization Response surface methodology (RSM) a central composite design to determine the optimal concentration of these components for lactic acid production by Lactobacillus casei. A satisfactory fit of the model was realized. Lactic acid production was significantly affected by interaction of CSL, K2HPO4, MgSO4, and Sodium acetate. Very close correlationship between experimental and predicted value was observed. The expected yield of lactic acid under this optimal condition (CSL 0.10%, K2HPO4 0.36%, MgSO4 0.42%, and Sodium acetate 0.32%) was 15.43 g/L and actual yield under this condition was 15.85 g/L. The subsequent validation experiment confirmed the validity of the statistical model. From the results obtained, it is concluded that Lactobacillus casei showed the maximum production of lactic acid 24.90 g/L after 48 hours of fermentation in static mode. In the present study found approximately 50% efficiency for lactic acid production in cheese whey based media. Cheese whey can be used as cheap carbon source for lactic acid production and it also gives further potential for industrial production of lactic acid.
Copyright © 2016 Bijal Patel and Dr. Vinayak Patel. This is an open access article distributed under the Creative Commons Attribution License, which permits unrestricted use, distribution, and reproduction in any medium, provided the original work is properly cited.
INTRODUCTION
Whey is a major by-product of dairy industry and contains approx. 60 to 65 % (m/V) lactose as well as moieties of protein, fat and mineral salts. The increased demandfor cheese on the market has led to a rise in whey production. Due to the low nutrient concentration, whey was discarded in the environment for a number of years without causing harm, but has become an environmental problem due to the volume produced and biochemical oxygen demand (BOD, 30 000 to 50 000 mg/L). Lactose is the main component responsible for high BOD values, as there is a BOD reduction of only 1000 mg/L when removing protein from cheese whey. The use of lactose in biotechnological processes reduces the BOD of cheese whey by as much as 75 % (Mawson, 1994). In order to reduce the BOD level and acquire useful compounds, the whey can be used as a cheap carbohydrate source for the production of lactic acid by bacteria (Büyükkileci2010;
*Corresponding author: Bijal Patel
Smt Kamlaben P.Patel College of Home Science, Anand Pepole’s Medicare Society, Anand
Kisaalita et al, 1990). However, lactic acid bacteria have complex nutrient requirements, as they have a limited capacity to synthesize vitamin B and amino acids (Van Niel et al.,
2002). A number of studies have shown that the lactic acid production of most lactobacilli is significantly improved by the addition of yeast extract, amino acids, protein concentrates, hydrolysates, vitamins and inorganic compounds such as (NH4)2SO4 and (NH4)2HPO4 (Amrane et al.,1998, Demirci et
al.,1998,Champagne et al., 1992, Cheng et al., 1991). Other studies have demonstrated the need to supplement cheese whey with commercially available growth supplements, such as corn steep liquor, yeast extract, casamino acids, peptone, neopeptone, molasses and trypticase (Cheng et al., 1991, Gupta et al., 1995, Roy et al., 1986). Corn steep liquor is a by-product of the corn milling industry and has been used as an inexpensive nutrient source for fermentation. It is an excellent source of nitrogen for most microorganisms, as it has high content of amino acids and polypeptides, with considerable amounts of B-complex vitamins (Cardinal et al., 1984). Lactic acid is a natural organic acid, which has many applications in pharmaceutical, food and chemical industries. These include:
ISSN: 2230-9926
International Journal of Development Research
Vol. 6, Issue, 02, pp. 6884-6890, February,2016
DEVELOPMENT RESEARCH
Article History:
Received 28th November, 2015 Received in revised form 19th December, 2015 Accepted 02ed January, 2016 Published online 29th February, 2016
Key Words:
Lactic acid,
uses as an acidulant, preservative and in recent years as a substrate for the production of biodegradable plastics. These plastics besides its application in food and cosmetic industry (Tashiro et al., 2011) are applied as drug-carriers (Lipinsky, 1986) and for biodegradable packaging (Hashitani, 2002).
Lactic acid is produced by chemical synthesis and microbial fermentation. Chemical synthesis results in racemic mixture of lactic acid whereas specific stereo isomeric form can be obtained by microbial fermentation (Naveena et al., 2005). The fermentative production of lactic acid is interesting due to the prospect of using cheap raw materials. The most attractive method for lactic acid production is fermentation of lactose in whey, a typical effluent from dairies. Hence, two problems could be solved at the same time wastewater treatment due to its high biochemical oxygen demand (BOD) 30000-50000 ppm (Tango, 1999) and useful product recovery. There are many reports on the lactic acid fermentation potential of Lactobacillus bacteria using lactose as substrate (Kisaalita et
al, 1990, Rao et al, 2006). Lactic acid production from various
substrates like corn (Montgomery, 1997), sugarcane (Tsuji, 1991), cassava (Lee, 1997), beets (Champagne et al., 1992), paper sludge (Gupta et al.,1995), biodiesel (Yunet al., 2003) and green microalga, Hydrodictyon reticulum (Cardinal et al., 1984) has been studied to meet the increasing demands for lactic acid. In this article, lactic acid production from whey using Lactobacillus casei (NCDC 297) has been studied. The optimal conditions for the production of lactic acid were determined in flask culture. Response surface methodology has been successfully used to model and optimize biochemical and biotechnological processes related to food systems (Parajó
et al., 1995, Vázquez et al., 1998, Ramírez et al., 2000). This methodology could be employed to optimize media for lactic acid fermentation.Initial screening of the process variables affecting the yield of lactic acid by Lactobacillus casei was done by employing fractional factorial design. After choosing the important variables, optimization was carried out using response surface methodology. Response surface methodology (RSM) is a powerful technique to achieve global optimization. In this work, central composite design of experiments with 6 center points were carried out.
MATERIALS AND MEDTHODS
Microorganism
The lactic acid bacterium used was Lactobacillus casei (NCDC 297). The strain was stored in De Man, Rogosa and Sharpe (MRS) broth with 50 % (v/v) glycerol at – 18 °C till further use.
Inoculum Preparation
The inoculum was prepared by transferring 100 μl of glycerol stock to 100 ml of sterile lactobacillus MRS broth (pH 7.0; Hi-Media, India), in a 250-ml Erlenmeyer flask and incubated at 370C for 24 h. Cells were harvested in a sterile centrifuge tube by centrifugation at 9,000 rpm for 10min. The pellet obtained was resuspended in sterile distilled water to an optical density of 1.0 at 660 nm. One ml of thus prepared inoculum was transferred to 100 ml of production media.
Media and Culture Conditions
Cheese whey containing 50 % (w/v) lactose was obtained from Amul Dairy, Anand, INDIA. The inoculum was prepared by transferring glycerol stock culture (1 ml) to an Erlenmeyer flask containing 100 ml of MRS medium and incubated at 37°C. Experiments were performed in 250 ml Erlenmeyer flasks containing 100 ml of cheese whey production medium along with the significant components (CSL, K2HPO4,MgSO4 and sodium acetate). The medium was adjusted to pH 6.5 and sterilized by autoclaving at 1210C for 15 min. It was maintained by 5gm% of sterile CaCO3. After inoculation, the flasks were incubated at 370C under static condition. Samples were collected at 48 h. Cells were harvested by centrifugation at 9,000 rpm for 10 min, and clear supernatant was subjected to lactic acid estimation. The composition of modified MRS medium was (g/l) : Peptone 10, Beef extract 10, Yeast extract 5, Ammonium citrate 2,MnSO4 0.05, Dextrose 20, Polysorbate 80 1gm.CSL, K2HPO4,MgSO4 and Sodium acetate was added in varying concentration to each flask as per the design.
Analysis of Media Constituents and Estimation of Lactic Acid
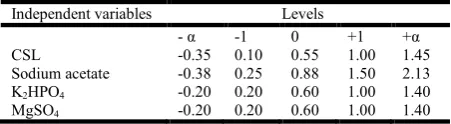
Factorial Design and Analysis of Results Design-Expert version 7.0 (State-Ease Inc., Minneapolis, U.S.A.) was used for experimental design (Central Composite Design, CCD), regression and graphical analysis of the data obtained. Four independent variables, including CSL, K2HPO4,MgSO4 and Sodium acetate were studied at five different levels (Table 1).Lactic acid estimation was carried out by a colorimetric method (Taylor,1996).
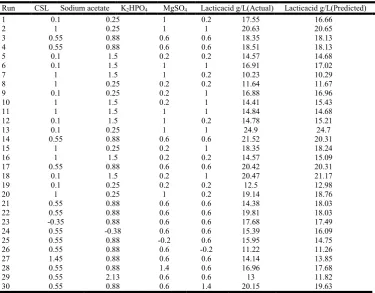
A set of 30 experiments was performed. The minimum and maximum ranges of variables were used, and the full experimental design with respect to their coded values is listed in (Table 2). The data on lactic acid production obtained from RSM were subjected to the analysis of variance (ANOVA). The results of RSM were used to fit a second-order polynomial [Eq. (1)].
Y = β0 +β1A +β2B +β3C +β4D +β1β2AB +β1β3AC +
β1β4AD +β2β3BC +β2β4BD +β3β4CD +β1β1A2 +
β2β2B2 +β3β3C2 +β4β4D2 (1)
[image:2.595.327.553.452.514.2]where Y is the response variable (dependent variable), β0 is the intercept (constant), β1, β2, β3, and β4 are linear coefficients β1β2, β1β3, β1β4, β2β3, β2β4, and β3β4 are interaction coefficients, β1β1, β2β2, β3β3, and β4β4 are squared coefficients, and A, B, C, D, AB, AC, AD, BC, BD, CD, A2, B2, C2, and D2 are levels of independent variables. Statistical significance of the above model equation was determined by Fisher’s test value, and the proportion of Table 1. Range of values for the response surface method
Independent variables Levels
- α -1 0 +1 +α
variance explained by the model was given by the multiple coefficient of determination, R squared (R2) value. Later, an experiment was run using the optimum values for variables given by response optimization to confirm the predicted value and the lactic acid production was confirmed.
RESULTS AND DISCUSSION
This experiment suggested four components, CSL, K2HPO4,MgSO4 and sodium acetate, as having significance of more than 95% confidence level. In the present study, these variables was selected for further optimization by CCD of response methodology. The results of the CCD experiments for studying the effect of independent variables are presented in Table 2. CCD is based on three basic points with respect to concentration of components; full factorial points 2k where k is the number of variables, center points η0 (η0>1) and two axial points for each variable (α=2k/4, =2 for k=4). The center points are usually replicated six times to give five degrees of freedom for purely experimental error. In the present study, we selected 6 center points in order to have a better idea of the experimental error. Thus, for the present study with four variables and 6 center points, total design points (experiments) would be N=2k+2k+η0=30 The results showed that, among the four variables tested, CSL, K2HPO4, MgSO4 and sodium acetate were highly significant for lactic acid production, whereas interaction among CSL and MgSO4 and Sodium acetate and MgSO4 are significant considering the p value. A 2D contour plot was generated for the response (lactic acid) at any two independent variables while keeping the others at their 0 level. Thus, six contour graphs were obtained by considering all the possible combinations (Fig. 1).
Both CSL and Sodium acetate at higher concentrations resulted in increased production of lactic acid (Figs. 1A, 1B). A similar effect was observed for MgSO4 (Fig. 1C). In all the above cases, the concentration of MgSO4 significant effect on lactic acid production, whereas higher lactic acid production was achieved at a lower concentration of CSL by increasing the centrations of sodium acetate, K2HPO4 and MgSO4.
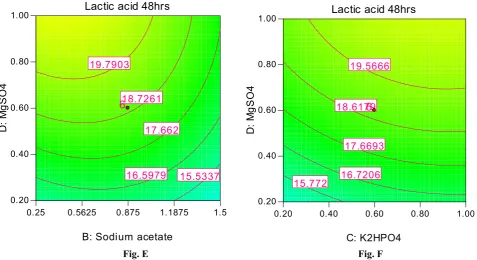
This can be attributed to the better utilization of Cheese whey sugar by the organism for lactic acid production in the presence of elevated levels of these nutrients. Increased concentration of sodium acetate have higher significant effect, K2HPO4 was present at concentration above 15.0 g/l (Fig. 1D). Elevated levels of sodium acetate along with increased concentration of MgSO4 resulted in no higher lactic acid production (Fig. 1E). The concentration of MgSO4 had no significant effect; however, it resulted in a higher production of lactic acid with increased concentration of K2HPO4 (Fig. 1F). By applying multiple regression analysis on the experimental results, a second-order polynomial model (Eq. 2) was derived explaining the role of each variable and their interaction in lactic acid production.
Lactic acid =+18.831 − 0.9095 A − 1.066B + 0.733 C +
2.094 D=−0.663 AB − 0.240 AC − 0.444 AD −
1.881 BC − 0.465 BD − 0.078 CD − 0.590 A2 −
1.019 B2 − 0.454 C2 − 0.647 D2 (2)
[image:3.595.113.489.144.437.2]where A is CSL, B is sodium acetate, C is K2HPO4, and D is MgSO4. ANOVA test (Table 3) showed that the coefficient of determination (R2) for production of lactic acid was 0.9154, implying that 91.54% variance can be explained by the model. The R2 value should be in between 0 and 1. The closer the R2 is to 1, the stronger the model and the better it predicts the
Table 2. CCD design with actual value and predicted value of lactic acid (response) produced
Run CSL Sodium acetate K2HPO4 MgSO4 Lacticacid g/L(Actual) Lacticacid g/L(Predicted)
1 0.1 0.25 1 0.2 17.55 16.66
2 1 0.25 1 1 20.63 20.65
3 0.55 0.88 0.6 0.6 18.35 18.13
4 0.55 0.88 0.6 0.6 18.51 18.13
5 0.1 1.5 0.2 0.2 14.57 14.68
6 0.1 1.5 1 1 16.91 17.02
7 1 1.5 1 0.2 10.23 10.29
8 1 0.25 0.2 0.2 11.64 11.67
9 0.1 0.25 0.2 1 16.88 16.96
10 1 1.5 0.2 1 14.41 15.43
11 1 1.5 1 1 14.84 14.68
12 0.1 1.5 1 0.2 14.78 15.21
13 0.1 0.25 1 1 24.9 24.7
14 0.55 0.88 0.6 0.6 21.52 20.31
15 1 0.25 0.2 1 18.35 18.24
16 1 1.5 0.2 0.2 14.57 15.09
17 0.55 0.88 0.6 0.6 20.42 20.31
18 0.1 1.5 0.2 1 20.47 21.17
19 0.1 0.25 0.2 0.2 12.5 12.98
20 1 0.25 1 0.2 19.14 18.76
21 0.55 0.88 0.6 0.6 14.38 18.03
22 0.55 0.88 0.6 0.6 19.81 18.03
23 -0.35 0.88 0.6 0.6 17.68 17.49
24 0.55 -0.38 0.6 0.6 15.39 16.09
25 0.55 0.88 -0.2 0.6 15.95 14.75
26 0.55 0.88 0.6 -0.2 11.22 11.26
27 1.45 0.88 0.6 0.6 14.14 13.85
28 0.55 0.88 1.4 0.6 16.96 17.68
29 0.55 2.13 0.6 0.6 13 11.82
response (Haaland, 1989). Adequate precision measures the signal-to-noise ratio. An adequate precision for lactic acid production was 13.63, and the predicted R2 of 0.6967 was in reasonable agreement with the adjusted R2 of 0.8244. This indicated a good agreement between the experimental and predicted values of lactic acid production. The model F-value of 10.05 and value of p of less than 0.0001 indicated that the model was highly significant. The lack of- fit value of 0.20 and p-value of 0.9771 implied that lack of fit was not significant: Lack of fit is the variation of the data around the fitted model. If the model does not fit the data well, this will be significant. Independent variables that are not significant were neglected considering their pvalue, and the model equation was modified to the reduced fitted model.
Lactic acid = +18.831 − 0.9095 A − 1.066B + 2.094 D=
−1.881 BC − 1.019 B2
(3)
This reduced fitted model is considerably simpler and fits the data as well as the model (Eq. 3) with all the terms. Hence, it can be used for further validation. Lactic acid bacteria are fastidious microorganisms and have complex nutrient requirements. Moreover, a considerable amount of expensive complex organic nitrogen sources, such as yeast extract, must be added to the medium (Chapin, 1993, Fitzpatrik et al.,
2001). If inorganic nitrogen sources have to be used in the medium, it must be supplemented with vitamins (Nancib et al., 2005) Sodium acetate is reported to enhance the cell growth, thereby indirectly increasing the product yield (Krishnan et al.,
1998, Peters et al., 1954). Inorganic phosphates have an effect on lactic acid production by Lactobacillus helveticus (Abdeltif, 2000). In the present study, we observed that CSL, sodium acetate, K2HPO4 and MgSO4 had significant effect on high production of lactic acid, when Cheese whey was used as a sugar source.
Fig. A. Fig. B.
Fig. C Fig. D
0.10 0.33 0.55 0.78 1.00
0.25 0.56 0.88 1.19
1.50 Lactic acid 48hrs
A: CSL
B
:
S
o
d
iu
m
a
ce
ta
te
16.146 16.9279 17.7099
18.4918
19.1217 19.2503
6
0.10 0.33 0.55 0.78 1.00
0.20 0.40 0.60 0.80
1.00 Lactic acid 48hrs
A: CSL
C
:
K
2
H
P
O
4
16.9311 17.4789 18.0267
18.5745 19.1223 19.5366
6
0.10 0.33 0.55 0.78 1.00
0.20 0.40 0.60 0.80
1.00 Lactic acid 48hrs
A: CSL
D
:
M
g
S
O
4
16.0351 17.0365
18.0379 19.0393 20.0407
6
0.25 0.5625 0.875 1.1875 1.5
0.20 0.40 0.60 0.80
1.00
Lactic acid 48hrs
B: Sodium acetate
C
:
K
2
H
P
O
4
17.1083
17.1083
18.091 19.0738
20.0565
Validation of the Model
Validation was carried out under conditions predicted by the model. Validation of the statistical model and regression equation was performed by running the optimization program with Design Expert within the experiment range investigated, and the following optimum values were obtained: CSL 0.10%; sodium acetate: 0.32% ; K2HPO4: 0.36%, and MgSO4: 0.42%. The predicted response for lactic acid production was 15.43 g/l. Hence, the parameters given by the response surface optimization were used for confirmation of the predicted response of 15.43 g/l lactic acid. The organism produced 15.85 g/l lactic acid, confirming the validity.
RSM has been employed for the production of lactic acid from wheat bran by using Lactobacillus amylophilus GV6 (Naveena
et al., 2005) It has also been applied for the production of various enzymes, such as cyclodextrin glucanotransferase (CGTase) (Gawande et al., 1999; Mahat et al., 2004), chitinase (Gohel et al., 2005), α-amylase (Rao et al., 2003) and pectinase (Nair et al., 1997), and vitamin riboflavin (Pujari et al., 2000) RSM can also be useful in optimizing the enzyme reaction conditions (Murthy et al., 2000). Response surface methodology can be used to determine optimum concentration of significant medium components. In the
[image:5.595.59.537.62.322.2]
Fig. E Fig. F
Fig. 1. Contour plots showing the effect of CSL and sodium acetate (A), CSL and K2HPO4 (B), CSL and MgSO4 (C),
sodium acetate and K2HPO4 (D), sodium acetate and MgSO4 (E) and K2HPO4 and MgSO4 (F)
with other independent variables at 0 level
Table 3. ANOVA for response surface design evaluation
Source Sum of Squares df Mean Square F value p-value
Model 277.63 14 19.83 10.05 <0.0001
A-CSL 19.85 1 19.85 10.06 0.0073
B-Sodium acetate 27.28 1 27.28 13.83 0.0026
C- K2HPO4 12.92 1 12.92 6.55 0.0238
D- MgSO4 105.29 1 105.29 53.38 <0.0001
AB 7.03 1 7.035 3.56 0.0815
AC 0.92 1 0.92 0.46 0.5052
AD 3.15 1 3.15 1.60 0.2279
BC 56.66 1 56.66 28.72 0.0001
BD 3.46 1 3.46 1.75 0.2076
CD 0.09 1 0.09 0.04 0.8274
A2 9.57 1 9.57 4.85 0.0462
B2 28.51 1 28.51 14.45 0.0022
C2 5.67 1 5.67 2.87 0.1138
D2 11.48 1 11.48 5.82 0.0313
Residual 25.64 13 1.97
Lack of Fit 10.28 10 1.02 0.20 0.9771
Pure Error 15.36 3 5.12
Cor Total 336.50 29
Adequate precision=13.63 R2= 0.9154
Adujsted R2=0.8244 Predicted R2=0.6967
0.25 0.5625 0.875 1.1875 1.5
0.20 0.40 0.60 0.80
1.00
Lactic acid 48hrs
B: Sodium acetate
D
:
M
g
S
O
4
15.5337 16.5979
17.662 18.7261 19.7903
6
0.20 0.40 0.60 0.80 1.00
0.20 0.40 0.60 0.80
1.00
Lactic acid 48hrs
C: K2HPO4
D
:
M
g
S
O
4
15.772 16.7206
17.6693 18.6179
19.5666
[image:5.595.142.456.397.589.2]present study, CSL, sodium acetate, K2HPO4, and MgSO4 were identified to be significant, and individual as well as interaction effects of these components were studied. Finally, a higher lactic acid production (50%) was achieved by using RSM.
REFERENCES
Abdeltif, A. 2000. Effect of inorganic phosphate on lactate production by Lactobacillus helveticus grown on supplemented whey permeate. J. Chem. Technol. Biotechnol. 75: 223-228. http://dx.doi.org/ 10.1002/(issn)1097-4660
Amrane, A. and Prigent, Y. 1998. Lactic acid production rates during different growth phases of Lactobacillus helveticus cultivated and whey supplemented with yeast extract,
Biotechnol. Lett. 20 379–383. http://dx.doi.org/10.1023/ A:1005331430943
Büyükkileci A.O. and Harsa S., 2010. Batch production of L(+) lactic acid from whey by Lactobacillus casei (NRRL B-441), J. Chem. Technol. Biotechnol. 79 (2004) 1036– 1040. 180
Cardinal, E.V. and Hedrick, L.R. 1984. Microbiological assay of corn steep liquor for amino acid content, J. Biol. Chem. 172 609–612. http://dx.doi.org/10.1074/jbc
Champagne, C.P., Morin, N., Couture, R., Gagnon, C., Jelen, P. and Lacroix, C. 1992. The potential of immobilized cell technology to produce freeze-dried, phage-protected cultures of Lactococcus lactis, Food Res. Int. 25 419–427. http://dx.doi.org/10.1016/0963-9969(92)90032-z
Chapin, A. 1993. Organization and regulation of genes for amino acid biosynthesis in lactic acid bacteria. FEMS Microbiol. Rev. 12: 21-38.
Cheng, P., Mueller, R.E., Jaeger, S. R. and Bajpai, Iannotti E.L. 1991. Lactic acid production from enzyme-thinned corn starch using Lactobacillus amylovorus, J. Ind. Microbiol. Biotechnol. 7 27–34.
Demirci A., Pometto A.L. III, Lee B. and Hinz P.N. 1998. Media evaluation of lactic acid in repeated batch-fermentation with Lactobacillus plantarum and Lactobacillus casei subsp. rhamnosus, J. Agric. Food Chem. 46 4771–4774. http://dx.doi.org/10.1021/jf980003j Fitzpatrik, J. J. and U. O’Keeffe. 2001. Influence of whey
protein hydrolysate addition to whey permeate batch fermentation for producing lactic acid. Process Biochem. 37: 183-186. http://dx.doi.org/10.1016/ j.procbio.2006.06.001
Gawande, B. N. and A. Y. Patkar. 1999. Application of factorial design for optimization of cyclodextrin glycosyltransferase production from Klebsiella pneumoniae AS-22. Biotechnol. Bioeng. 64: 168-172. http://dx.doi.org/ 10.1002/bit.25528
Gohel, V., Jiwan, D., Vyas, P. and Chatpar, H. S. 2005. Statistical optimization of chitinase production by Pantoea dispersa to enhance degradation of crustacean chitin waste.
J. Microbiol. Biotechnol. 15: 197-201. http://dx.doi.org/10.1111/ j.1365-2672.2008.03803.x Gupta, R. and Gandhi, D.N. 1995. Effect of supplementation
of some nutrients in whey on the production of lactic acid, Indian J. Dairy Sci. 48 636–641.
Haaland, P.D. 1989. Statistical problem solving, pp. 1-18. In Haaland, P. D. (ed.). Experimental Design in
Biotechnology. Marcel Dekker, Inc., New York and Basel. http://dx.doi.org/ 10.1007/s12088-007-0028-4
Hashitani, T., Yano, E. and Ando, Y. 2002. Biodegradable Packing Materials for LSIs. FUTJITSU Sci. Technol. J. 38, 112–118. http://dx.doi.org/10.13182/fst
Kisaalita, W.S., Lo K.V. and Pinder K.L. 1990. Influence of whey protein on continuous acidogenic degradation of lactose, Biotechnol. Bioeng. 36 642–646.
Krishnan, S., Prapulla, S. G., Rajalakshmi, D. Mishra, M. C.and Karanth, N. G. 1998. Screening and selection of media components for lactic acid production using Plackett- Burman design. Bioproc. Eng. 19: 61-65.
Lee, C.L. and Wang, W.L. 1997. Biological Statistics, Science Press, Beijing, PR China.
Lipinsky, E.S. and Sinclair, R.G. 1986. Is lactic acid a commodity chemical?. Chem. Eng. Prog. 82, 26 32. http://dx.doi.org/10.1007/978-3-642-61462-0_2
Mahat, M. K., R. M. Illias, R. A. Rahman, N. A. A. Rashid, N. A. N. Mahmood, O. Hassan, S. A. Aziz, and K. Kamaruddin. 2004. Production of cyclodextrin glucanotransferase (CGTase) from alkalophilic Bacillus sp. TSI-1: Media optimization using experimental design.
Enzyme Microb. Technol. 35: 467-473. http://dx.doi.org/ 10.1016/0141-0229(88)90125-1
Mawson, A.J. 1994. Bioconversions for whey utilization and waste abatement, Bioresour. Technol. 47 195–203. http://dx.doi.org/ 10.1016/0960-8524(94)90180-5
Montgomery, D.C. 1997. Response Surface Methods and Other Approaches to Process Optimization. In: Design and Analysis of Experiments, D.C. Montgomery (Ed.), John Wiley & Sons, New York, USA pp. 427–510. http://dx.doi.org/ 10.1016/j.cherd.2010.12.004
Murthy, M. S. R. C., Swaminathan, T., Rakshit, S. K. and Kosugi, Y. 2000. Statistical optimization of lipase catalyzed hydrolysis of methyl oleate by response surface methodology. Bioproc. Bioeng. 22: 35-39.
Nair, S. R. and Panda, T. 1997. Statistical optimization of medium components for improved synthesis of pectinase by Aspergillus niger. Bioproc. Bioeng. 16: 169-173. Nancib, A., Nancib, N., Meziane-Cherif, D., Boubendir, A.,
Fick, M. and Boudrant, J. 2005. Joint effect of nitrogen sources and B vitamin supplementation of date juice on lactic acid production by Lactobacillus casei subsp. rhamnosus. Biores. Technol. 96: 63-67. http://dx.doi.org/10.1016/ j.biortech.2010.04.002
Naveena, B. J., Md. Altaf, K. Bhadriah, and G. Reddy. 2005. Selection of medium components by Plackett-Burman design for production of L(+) lactic acid by Lactobacilus amylophilus GV-6 in SSF using wheat bran. Biores. Technol.96: 485-490. http://dx.doi.org/10.1016/ j.biortech.2010.04.002
Naveena, B.J., Altaf, M., Bhadrayya, K., Madhavendra, S.S. and Reddy, G 2005. Direct fermentation of starch to L (þ)- lactic acid in SSF by Lactobacillus amylophilus GV6 using wheat bran as support and substrate: medium optimization using RSM. Process Biochem. 40, 681- 690. http://dx.doi.org/ 10.1016/j.procbio.2006.06.001
Parajó, J.C., Santos, V., Domínguez, H. and Vázquez, M. 1995. NH4OH- -based pretreatment for improving the nutritional quality of single-cell protein (SCP), Appl.
Biochem. Biotechnol. 55 133–149.
Peters, V. J. and E. E. Snell. 1954. Peptides and bacterial growth. J. Bacteriol. 67: 69-76. http://dx.doi.org/10.5897/ jbr
Pujari, V. and T. S. Chandra. 2000. Statistical optimization of medium components for enhanced riboflavin production by a UV mutant of Eremothecium ashbyii. Process Biochem. 36: 31-37. http://dx.doi.org/10.1016/S0032-9592(00)00173-4
Ramírez, J.A., Santos, I.A., Morales, O.G., Morrissey, M. and Vázquez, M. 2000. Application of microbial transglutaminase to improve mechanical properties of surimi from silver carp, CyTA-J. Food, 3 21–28. http://dx.doi.org/ 10.1007/12393.1866-7929
Rao, J. L. U. M. and Satyanarayana, T. 2003. Statistical optimization of a high maltose-forming, hyper thermostable and Ca2+-independent α-amylase by an extreme thermophile Geobacillus thermoleovorans using response surface methodology. J. Appl. Microbiol. 95: 712-718. http://dx.doi.org/10.1111/j.1365 2672.2004.02395.x
Rao, Y.K., Lu, S.C., Liu, B.L. and Tzeng, Y.M. 2006. Enhanced production of an extracellular protease from Beauveria bassiana by optimization of cultivation processes, Biochem. Eng. J. 28 57–66. http://dx.doi.org/10.1016/ j.bej.2014.03.002
Roy, D., Goulet, J. and LeDuy, A. 1986. Batch fermentation of whey ultrafiltrate by Lactobacillus helveticus for lactic acid production, Appl. Microbiol. Biotechnol. 24 206–213. http://dx.doi.org/10.1007/bf00254636
Tango, M.S.A. and Ghaly, A.E. 1999. Amelioration of lactic acid production from cheese whey using microaeration.
Biomass bioenerg. 17, 3: 221 - 238. http://dx.doi.org/ 10.1016/j.biombioe.2011.02.049
Tashiro, Y., Kaneko, W., Sun, Y., Shibata, K., Inokuma, K., Zendo, T. and Sonomoto, K. 2011. Continuous D-lactic acid production by a novel thermotolerant Lactobacillus delbrueckii subsp. lactis QU 41. Appl Microbiol Biotechnol. 89(6):1741-50 http://dx.doi.org/ 10.1007/s00253-010-3011-7.
Taylor, K.A.C.C, 1996. A simple calorimetric assay for muramic acid and lactic acid Applied Microbiol. Biotechnol, 56, 49-58. http://dx.doi.org/10.1007/ BF02787869
Tsuji, H., Hyon, S.H. and Ikada, Y., 1991. Stereocomplex formation between enantiomeric poly(lactic acid)s. 3. Calorimetric studies on blend films cast from dilute solution, Macromolecules, 24 5651–5656. http://dx.doi.org/ 10.1021/ma00020a026
Van Niel, E.W.J., Hofvendahl, K. and Hahn-Hägerdal, B., 2002. Formation and conversion of oxygen metabolites by Lactococcus lactis subsp. lactis ATCC 19435 under different growth conditions,Appl. Environ. Microbiol. 68 4350–4356. http://dx.doi.org/10.1128/AEM.68.9.4350-4356.2002
Vázquez, M. and Martin, A.M. 1998. Optimization of Phaffia rhodozyma continuous culture through response surface methodology, Biotechnol. Bioeng. 57 314–320. http://dx.doi.org/10.1002/(issn)1097-0290
Yun, J.S., Wee, Y.J. and Ryu, H.W. 2003. Production of optically pure L (+)-lactic acid from various carbohydrates by batch fermentation of Enterococcus faecalis RKY1,
Enzyme Microb. Technol. 33 416–423. http://dx.doi.org/:10.1016/ 0141-0229(88)90125-1