INTRODUCTION
Effective tissue homeostasis requires a fine balance between the removal of dead cells and production of new ones. The gastrointestinal tract is dependent on constant self-renewal, as ingested food, pathogens and toxins can damage the epithelium. Adult intestinal stem cells (ISCs) give rise to all the mature cell types of the intestinal epithelium and any imbalance in this process can lead to diseases, such as cancer (Radtke and Clevers, 2005). In the adult mammalian small intestine, the ISC population is located near the base of the crypts of Lieberkühn. Each crypt gives rise to ~300 cells per day (Marshman et al., 2002). This process is supported by four to six ISCs per crypt (Bjerknes and Cheng, 1999) the progeny of which undergo transit-amplifying divisions as they migrate up the crypt before becoming the differentiated secretory and absorptive cells that occupy the intestinal villi. A number of signalling pathways, including Notch, BMP and Wnt, have been shown to play key roles in this proliferating population (Sancho et al., 2004). However, until recently, a lack of specific stem cell markers has made it difficult to precisely identify and study this population (Clevers, 2009; Crosnier et al., 2006).
The identification of a population of ISCs in the adult Drosophila posterior midgut provided a new model system in which to investigate ISC biology (Micchelli and Perrimon, 2006; Ohlstein and Spradling, 2006) (Fig. 1A). These basally located
ISCs can give rise to both enterocytes (ECs) and small secretory enteroendocrine (ee) cells, both of which undergo weekly turnover. ISCs can be identified by their small nuclear size and expression of the Notch ligand Delta (Dl). ISC self-renewal produces an identical daughter ISC along with an immature diploid daughter (progenitor) cell, termed the enteroblast (EB). ISCs and EBs both express the Snail/Slug family transcription factor escargot(esg+) (Micchelli and Perrimon, 2006; Ohlstein and Spradling, 2006). These two esg+cell populations are often found in pairs and can be distinguished based on expression of Dl in the ISC and Su(H)GBE-lacZ(a transcriptional reporter of Notch signalling) in the EB.
EBs undergo no transit divisions and can produce one of two cell types. Ninety percent of EBs become absorptive ECs, identifiable by their large endoreplicating nuclei and Pdm1 (Nubbin) expression (Lee et al., 2009; Micchelli and Perrimon, 2006; Ohlstein and Spradling, 2006). The remaining 10% are small, Prospero-positive (Pros+), ee cells. In contrast to the mammalian situation, where it favours proliferation of progenitors (Fre et al., 2005; van Es et al., 2005), Notch is required to drive cells into a post-mitotic state. In agreement with this notion, asymmetric Dl signalling from ISC to EB is functionally required for this process (Ohlstein and Spradling, 2007). In both Drosophilaand mammals, Notch activation favours absorptive differentiation at the expense of secretory cells (Bardin et al., 2010; Fre et al., 2005; Ohlstein and Spradling, 2007; van Es et al., 2005).
How adult ISCs respond to damage, switching from a homeostatic to a rapid proliferative state in order to regenerate damaged tissue, is not yet fully understood. The Drosophilamidgut responds to various forms of stress via activation of Jak/Stat signalling (Amcheslavsky et al., 2009; Biteau et al., 2008; Buchon et al., 2009a; Cronin et al., 2009; Jiang et al., 2009). Jak/Stat signalling has been implicated in the regulation of stem cells (SCs) in multiple tissues and is proposed to be a common regulator of SC proliferation, also promoting SC self-renewal efficiency in mouse embryonic SCs (Gregory et al., 2008). The DrosophilaJak/Stat Development 137, 4147-4158 (2010) doi:10.1242/dev.052506
© 2010. Published by The Company of Biologists Ltd
1Apoptosis and Proliferation Control Laboratory, Cancer Research UK, London Research Institute, 44 Lincoln’s Inn Fields, London, WC2A 3LY, UK. 2ZMBH-DKFZ Alliance, Im Neuenheimer Feld 282, D-69120 Heidelberg, Germany. 3Centre de Biologie du Développement, UMR5547, CNRS/Université Paul Sabatier Toulouse III, 118 route de Narbonne, 31062 Toulouse, France. 4Division of Basic Sciences, Fred Hutchinson Cancer Research Center, 1100 Fairview Ave. N., Seattle, WA 98109, USA.
*These authors contributed equally to this work †Author for correspondence (nicolas.tapon@cancer.org.uk)
Accepted 7 October 2010
SUMMARY
Intestinal stem cells (ISCs) in the adult Drosophilamidgut proliferate to self-renew and to produce differentiating daughter cells that replace those lost as part of normal gut function. Intestinal stress induces the activation of Upd/Jak/Stat signalling, which promotes intestinal regeneration by inducing rapid stem cell proliferation. We have investigated the role of the Hippo (Hpo) pathway in the Drosophilaintestine (midgut). Hpo pathway inactivation in either the ISCs or the differentiated enterocytes induces a phenotype similar to that observed under stress situations, including increased stem cell proliferation and expression of Jak/Stat pathway ligands. Hpo pathway targets are induced by stresses such as bacterial infection, suggesting that the Hpo pathway functions as a sensor of cellular stress in the differentiated cells of the midgut. In addition, Yki, the pro-growth
transcription factor target of the Hpo pathway, is required in ISCs to drive the proliferative response to stress. Our results suggest that the Hpo pathway is a mediator of the regenerative response in the Drosophilamidgut.
KEY WORDS: Hippo signalling, Jak/Stat, Intestinal stem cells, Drosophila
The Hippo pathway regulates intestinal stem cell
proliferation during
Drosophila
adult midgut regeneration
Rachael L. Shaw1,*, Alexander Kohlmaier2,*, Cédric Polesello1,3, Cornelia Veelken2, Bruce A. Edgar2,4and
Nicolas Tapon1,†
D
E
V
E
LO
P
M
E
N
pathway consists of Unpaired (Upd; Os – FlyBase) cytokines, which bind to the Domeless (Dome) receptor, thereby activating Hopscotch (Hop) and the fly Janus kinase (Jak), which in turn regulates gene transcription through Stat92E, a STAT3-like transcription factor (Arbouzova and Zeidler, 2006). In the midgut, Stat reporters are active in both ISCs and EBs, but not in terminally differentiated cells (Beebe et al., 2010; Jiang et al., 2009; Liu et al., 2010). Upd ligands are produced by ECs in response to a wide range of stress situations, such as apoptosis, JNK signalling or bacterial infection (Buchon et al., 2009b; Jiang et al., 2009). This leads to activation of Jak/Stat signalling in ISCs and EBs, promoting their division and differentiation, thereby accelerating midgut tissue renewal. Therefore the Jak/Stat pathway appears to regulate ISC proliferation, although its precise role in baseline homeostasis remains unclear (Beebe et al., 2010).
The highly conserved Salvador/Warts/Hippo signalling pathway is a key regulator of organ size (Harvey and Tapon, 2007). The pathway promotes both cell cycle exit and apoptosis and its deregulation can lead to cancer. Hippo (Hpo) signalling involves a kinase cascade. The upstream kinase Hpo activates the downstream kinase Warts (Wts), in concert with two scaffold proteins Salvador (Sav) and Mats (Harvey et al., 2003; Jia et al., 2003; Kango-Singh et al., 2002; Lai et al., 2005; Pantalacci et al., 2003; Tapon et al., 2002; Udan et al., 2003; Wu et al., 2003). Wts phosphorylates and inactivates Yorkie (Yki), a growth-promoting transcriptional co-activator (Huang et al., 2005). Yki modulates the expression of target genes including Diap1(Drosophilainhibitor of apoptosis protein 1; th – FlyBase) and Cyclin E(Dong et al., 2007; Huang et al., 2005). Hpo signalling has been little studied in adult homeostasis. In the mouse intestine, overexpression of YAP1 (Yes-associated protein 1), the mammalian orthologue of Yki, results in expansion of the progenitor cell compartment (Camargo et al., 2007). Until now, the function of Yki in theDrosophilamidgut has not been investigated. Here, we show that Hpo pathway inactivation or overexpression of Yki in the midgut induces a regenerative response involving Jak/Stat activation and increased ISC proliferation. Yki appears to function both in differentiated ECs, as a part of a stress response pathway, and in ISCs, as a driver of the proliferative response.
MATERIALS AND METHODS Drosophilastrains
w; MyoIAGal4; tubGal80ts UAS-GFP (MyoIAts), yw; esgGal4; tubGal80ts
UAS-GFP (esgts)and upd-lacZhave been described previously (Jiang et al., 2009). Su(H)Gbe-LacZ was a gift from S. Bray (University of Cambridge, UK) (Furriols and Bray, 2001). w;UAS-yki/TM3,Sb; Tub>y+>yki/TM6b;
FRT42D hpo42-47and FRT42DykiB5hpo42-47were kind gifts from D. Pan (Johns Hopkins University, MD, USA) (Huang et al., 2005). We thank G. Halder (MD Anderson Cancer Center, TX, USA) for providing us with FRT82B savshrp1lines; N. Perrimon (Harvard Medical School, MA, USA) for
the 10XStat-dGFP (Bach et al., 2007) and upd3Gal4,UAS-GFP lines
(Agaisse et al., 2003); and H. Jiang (UT Southwestern, TX, USA) for the MARCM42D and MARCM82B lines. UAS-upd/Cyowas a gift from R. Cagan (Mount Sinai Medical Center, NY, USA). FRT82b,wtslatsX1/Tm6b was as published (Xu et al., 1995). Other strains were obtained from the Bloomington Vienna DrosophilaRNAi Stock Centers. Flies were maintained on standard media, which was changed every 3 days. Only female flies were analysed in this study.
Genotypes Figure 1
(B,E,H,K,N,O) yw;esgGal4;tubGal80ts,UAS-GFP; (C)
yw;esgGal4/UAS-ykiGFP;tubGal80ts,UAS-GFP; (D,P) w;FRT42Dhpo42-47/y,w,hsFlp,
UASGFP-NLS;FRT42DTubGal80,TubGal4; (F)
yw;UAS-Notch-RNAi,esgGal4;tubGal80tsUAS-GFP; (I,L,N,O) yw;esgGal4;
tubGal80tsUAS-GFP,UAS-yki; (J,M,N,O)
yw;esgGal4,UAS-wtsRNAi;tubGal80ts,UAS-GFP; (P) w;P[ry+hs-neoR
FRT]42DP[mini-w+,hs-pmyc]45F/y,w,hsFlp,UASGFP-NLS;FRT42DTubGal80,TubGal4
y,w;eyFLP;FRT82Bsavshrp1/y,w,hsFlp,UAS-GFP-CD8;+;TubGal4,FRT82B,
tubGal80; (Q) y,w,hsFlp,UAS-GFP-CD8;+;TubGal4,FRT82B,tubGal80/
FRT82Bsavshrp1/y,w,hsFlp,UAS-GFP-CD8;+;TubGal4,FRT82BtubGal80/
FRT82B.
Figure 2
(A,D,E,E⬘) yw;esgGal4;tubGal80ts,UAS-GFP; (B,D,F,F⬘) yw;esgGal4;
tubGal80tsUAS-GFP,UAS-yki; (C,G-G⬙,D)
yw;esgGal4,UAS-wts-RNAi;tubGal80tsUAS-GFP; (H,I) y,w;eyFLP;FRT82Bsavshrp1/y,w,hsFlp,
UAS-GFP-CD8;+;TubGal4,FRT82B,tubGal80; (I)
y,w,hsFlp,UAS-GFP-CD8;+;TubGal4,FRT82B,tubGal80/FRT82Bsavshrp1
;y,w,hsFlp,UAS-GFP-CD8; +;TubGal4,FRT82B,tubGal80/FRT82B.
Figure 3
(A-A⬙,C,F,G,H) w;MyoIAGal4;tubGal80ts,UAS-GFP; (B-B⬙,D,F,G,H)
w;MyoIAGal4;tubGal80tsUAS-GFP,UAS-yki; (E-G)
w;MyoIAGal4,UAS-wtsRNAi;tubGal80tsUAS-GFP.
Figure 4
(A-A⬙) y,w,hsflp,Upd-LacZ;+;Act>CD2>Gal4,UAS-GFP; (B-B⬙) y,w, hsflp,Upd-LacZ;+;Act>CD2>Gal4,UAS-GFP/UAS-yki; (C-D⬘,F,G) y,w;
eyFLP;FRT82Bsavshrp1/y,w,hsFlp,UAS-GFP-CD8;+;TubGal4,FRT82B,
tubGal80; (E-G) y,w,hsFlp,UAS-GFP-CD8;+;TubGal4,FRT82B,
tubGal80/FRT82Bsavshrp1;y,w,hsFlp,UAS-GFP-CD8;+;TubGal4,FRT82B,
tubGal80/FRT82B.
Figure 5
(A-A⬙) Upd-lacZ;FRT42Dhpo42-47/y,w,hsFlp,UASGFP-NLS;
FRT42DTubGal80,tubGal4; (B-B⬙) Upd-lacZ;FRT42DykiB5,hpo42-47/
y,w,hsFlp,UASGFP-NLS;FRT42D TubGal80,TubGal4; (C-C⬙)
yw,hsf;upd3Gal4-UASGFPtub>y+>yki; (D,E,E⬘,G) w;MyoIAGal4/
10XStat-dGFP;tubGal80ts; (D,F,F⬘,G)
w;MyoIAGal4/10XStat-dGFPtubGal80ts/UAS-yki.
Figure 6
(A,E,Q) yw;esgGal4;tubGal80tsUAS-GFP; (B,F,Q) yw;esgGal4;
tubGal80tsUAS-GFP,UAS-yki; (C,G,R) yw;esgGal4,UAS-StatRNAi;
tubGal80tsUAS-GFP; (D,H,Q) yw;esgGal4,UAS-StatRNAi;
tubGal80tsUAS-GFP,UAS-yki; (I,M,R)
w;MyoIAGal4;tubGal80ts,UAS-GFP; (J,N,R) w;MyoIAGal4; tubGal80tsUAS-GFP,UAS-yki; (K,O,R)
w;MyoIAGal4, UAS-StatRNAi; tubGal80ts UAS-GFP; (L,P,R)
w;MyoIAGal4,UAS-StatRNAi;tubGal80tsUAS-GFP,UAS-yki.
Figure 7
(A) w1118; (B-C⬘) y,w;ex-LacZ/cyo; (D-E⬘)
w;esgGal4;tubGal80tsUAS-GFP; (F-G⬘)w; MyoIAGal4/UAS-ykiGFP;tubGal80tsUAS-GFP.
Figure 8
(A,C,E,G,M) w;esgGal4;tubGal80tsUAS-GFP; (B,D,F,H,M) w;esgGal4,
UAS-yki-RNAI;tubGal80tsUAS-GFP; (I,K,N) w;MyoIAGal4;
tubGal80tsUAS-GFP; (J,L,N)w;MyoIAGal4,UASy;tubGal80tsUAS-GFP.
Temperature shift experiments
Crosses were set up and maintained at 18°C, the permissive temperature, until adulthood. Adults were heat shocked at 37°C and shifted to 29°C routinely for 7 days for quantifying cellular markers and numbers, except for shorter times for time-courses (days indicated in figures). Yki was induced for only 4 days in order to measure immediate impacts on Stat-dGFP levels. For analysis of nuclear abundance, Yki-GFP expression was pulsed-in briefly for 1 day followed by continued induction during experimental exposure to paraquat for the indicated times.
Flipout clones
For adult flipout clones, crosses were set up and cultured at room temperature. Flies were heat-shocked for 30 minutes 5 days after eclosion and dissected 5 days later. For pucRNAianalysis, flies were analysed 0, 1 and 2 days after heat shock. For wing imaginal disc flipout clones, crosses were
D
E
V
E
LO
P
M
E
N
established at 25°C. Larvae were heat shocked for 10 minutes 72 hours after egg deposition (A.E.D.) and dissected 120 hours A.E.D. (Pignoni et al., 1997).
MARCM clones
MARCM clones were generated as previously described (Lee and Luo, 1999). Crosses were raised at room temperature, adult flies were heat shocked for 45 minutes 5 days after eclosion and dissected as indicated below. The analysis of cell number per savor control clone, BrdU+ cells per clone and Pdm1+ cells per clone was performed by simultaneous co-staining in flies fed BrdU for 10 hours on day 7 of clone growth (Fig. 1Q; Fig. 2H,H⬘; Fig. 4C-G). Epithelial architecture of hpo mutant clones was analyzed in 14-day-old clones to allow continued overproliferation (Fig. 1D-D⬘). Clones were analysed 7 days after induction for Fig. 1P. Clones were analysed 10 days after dissections for Figs S3A-B⬙, S5A-B⬙and S5C-D⬙in the supplementary material.
Histology Guts
Female adult flies were dissected in 1⫻PBS or Ringer’s solution. The gastrointestinal tract was removed and fixed in 0.5⫻or 1⫻PBS with 4% paraformaldehyde for 30 minutes. Samples were washed in 0.1% Triton X-100 (PBST), permeabilised for 30 minutes in 0.3% PBST and pre-blocked for 1 hour in 10% NGS and 2.5% BSA before incubation with primary antibody overnight at 4°C. Samples were again washed in PBST and pre-blocked for one hour before incubation with secondary antibody for 3-4 hours at room temperature. Samples were washed in PBST followed by PBS and mounted in Vectashield containing DAPI.
Wing imaginal discs
Discs were dissected in 1⫻PBS and then fixed in 4% paraformaldehyde for 22 minutes. All other steps were conducted as for guts except secondary antibody incubation (4 hours).
Gut sections
For cryosections, midguts were dissected, fixed and embedded in OCT Tissue-Tek (Sakura) medium according to standard procedures and subsequently processed for immunofluorescence staining as above. For optical sections, orthogonal representations of z-stacks spanning the midgut epithelium were presented using Nikon NIS-elements imaging software.
BrdU incorporation
Adult flies carrying 7-day-old MARCM clones were transferred on food containing BrdU (100 g/ml in PBS) mixed into the upper layer and were dissected 10 hours later.
Antisera
The following primary antibodies were used: mouse anti-prospero [Development Studies Hybridoma Bank (DSHB)], 1/20; mouse anti-Delta (DSHB), 1/100; rabbit anti-phospho-Histone H3 (Upstate Biotechnology), 1/1000; mouse anti--galactosidase (Promega), 1/500; rabbit anti- -galactosidase (Cappell), 1/2000; rabbit caspase 3 (Cell Signaling), 1/100; rabbit anti-Pdm1 (kind gift from W. Chia, Temasek Laboratories, Singapore), 1/100; rabbit anti-Yki (gift from K. Irvine, Rutgers University, NJ, USA), 1/500; and mouse anti-BrdU (BD Biosciences), 1/100. Rhodamine Phalloidin (Molecular Probes) was used at 1/200. Anti-rabbit and anti-mouse Rhodamine Red-X-conjugated secondary antibodies (Jackson ImmunoResearch) were used at 1/500.
RT-qPCR
RNA was isolated using Trizol (Invitrogen) and cleaned by column purification and on-column DNAse I treatment (Quiagen). RNA (1.5 g) was reverse transcribed (SuperScript III cDNA Synthesis Kit, Invitrogen) using random hexamers. RT-qPCR was performed on cDNA corresponding to 3.75 ng input RNA on a LightCycler 480 II using SYBR Green I (Roche). Experiments were performed in triplicate. Relative fold differences in expression levels of target genes were calculated as ratio to the mean of the three reference genes dp1, rp49and myo1Afor the analysis
of short-term effects of PE infection, and to the mean of dp1and rp49for the analysis of long-term Yki expression. Primer sequences are given in Table S1 in the supplementary material.
Bacterial infection and paraquat feeding
For gut infections crosses and infections were essentially performed as described previously (Jiang et al., 2009) with flies being starved for 2 hours prior to oral infection with Pseudomonas entomophila (P.e) in 5% sucrose/PBS mixed in fly food. P.e cultures used were grown in LB medium with selection on 100 g/ml rifampicin. For RNAi experiments, crosses were maintained at 18°C, adult flies were shifted to 29°C for 4-5 days before infection. For rescue experiments, P.e-infected flies were transferred to food lacking bacteria containing 100 U/ml penicillin and 100 g/ml streptomycin in PBS (Gibco). For paraquat feeding flies were starved for 2 hours prior to placing them on empty vials containing Whatman filter paper soaked in 2 mM paraquat.
Microscopy and imaging
Fluorescence images were acquired on a Zeiss LSM510, a Nikon A1Rsi or a Leica SP5 confocal microscope. Images were processed using ImageJ Fiji and Adobe Photoshop.
Quantification and statistical analysis
For MARCM clone analysis, number of cells per clone, BrdU-positive and Pdm1-positive cells per clone were obtained by manual counting after confocal imaging and 3D projection of confocal slices. Nuclear Yki intensities were measured with Fiji image processing software from single confocal planes as mean Yki fluorescence intensity after identifying nuclei with DAPI staining using background subtraction, thresholding and watershed function. Dl-positive cell numbers were quantified from square areas 115.2 m across. Statistical significance was examined using two-tailed Mann-Whitney tests.
RESULTS
Effects of Hippo pathway inactivation in ISCs To examine the effect of Hpo pathway inactivation in the midgut, we began by inducing Yki overexpression, which phenocopies hpo or wtsloss in imaginal discs (Huang et al., 2005). To ensure Yki overexpression was restricted to progenitor cells in the adult midgut, transgene expression was placed under the control of the ISC/EB driver esg-GAL4, and temporally restricted using temperature-sensitive GAL80 under the control of the tubulin promoter (esg-Gal4;tub-Gal80ts,UAS-GFP referred to as esgts)
(McGuire et al., 2003; Micchelli and Perrimon, 2006). Adult flies were shifted to the non-permissive temperature (29°C) in order to activate transgene expression (see Materials and methods).
esgts-driven expression of Yki led to an increase in the number
of ISCs and EBs compared with controls (Fig. 1B,C,E,G). Notch signalling has been shown to promote ISC differentiation (Micchelli and Perrimon, 2006; Ohlstein and Spradling, 2006). As expected, Notch depletion caused an increase in the number of small esg+cells (Fig. 1F). By contrast, Yki overexpression led to overproliferation and the formation of patches of esg+ cells containing a mixture of small nuclei typical of ISCs and EBs (Fig. 1G, arrowheads) and larger nuclei (Fig. 1G, arrow). Transverse cryosections through the midgut showed that esgts-driven
expression of Yki leads to increased numbers of progenitor cells, enhanced cell density of differentiated cell types (esg–) and increased epithelium thickness (Fig. 1B,C). This was also apparent in optical sections through MARCM clones mutant for the upstream kinase hpocompared with the surrounding non-mutant epithelium (Fig. 1D,D⬘). We characterised the development of this mutant phenotype in detail in different regions of the gut (see Fig.
S1 in the supplementary material).
D
E
V
E
LO
P
M
E
N
Dl is the best-characterised ISC-specific marker (Ohlstein and Spradling, 2007). In wild-type guts, Dl-expressing cells are not found immediately adjacent to one another but in regularly spaced ISC nests (Fig. 1H). Following Yki overexpression, we observed an increase in the number of cells expressing Dl (Fig. 1I,N), suggesting that more ISCs were present and some of these were increased in size (Fig. 1H-J). Expression of a wts-RNAi construct also resulted in the appearance of clusters of Dl+ cells (Fig. 1J).
Su(H)Gbe-LacZ is normally expressed by EBs as a result of Dl expression in ISCs (see Fig. S2A,A⬘in the supplementary material) (Micchelli and Perrimon, 2006; Ohlstein and Spradling, 2006; Ohlstein and Spradling, 2007). Yki overexpression resulted in increased numbers of Notch-positive cells, with diffuse Su(H)Gbe-LacZ levels throughout the esg+ area, presumably reflecting the increase in Dl+ cells (see Fig. S2B,B⬘in the supplementary material). Despite the increase in Dl+ and Su(H)Gbe-LacZ+cells, these markers remain expressed in separate cells, except in rare cases where cells expressing Su(H)Gbe-LacZalso had very low levels of Dl (see Fig. S2C-C in the supplementary material).
Hpo pathway inactivation promotes ISC proliferation
[image:4.612.56.379.59.479.2]Increased ISC number and thickening of the epithelium suggest an overproliferation phenotype. We addressed this issue using phospho-Histone H3 (PH3) staining, which marks dividing cells. In control guts, we observed low levels of PH3 (Fig. 1K,O). Hpo signalling disruption in progenitor cells (ISCs and EBs) caused a marked increase in PH3+ cell numbers (Fig. 1L,M,O). PH3 staining coincided with the increase in numbers of esg+cells but varied between individual guts, and according to position within the gut (see Fig. S1 in the supplementary material). Quantification of PH3 foci in populations of guts revealed a significant increase in the number of dividing cells upon Hpo pathway inactivation (Fig. 1O). As expected, the dividing (PH3+) cells in both control and mutant guts were always Dl+, suggesting they were indeed ISCs (see Fig. S2D in the supplementary material; n10 guts). Furthermore, no Su(H)Gbe-LacZ(Notch) positive EB re-entered mitosis (see Fig. S2A-B⬘in the supplementary material; n10 guts). Thus, Yki activation does not cause EB dedifferentiation or interfere with exit from the mitotic cycle in specified EBs. We used the MARCM
Fig. 1. Loss of Hpo signalling promotes ISC proliferation. (A)The adult midgut. (B,C)Orthogonal cryosections of the adult midgut epithelium showing thatesgts-driven expression of Yki-GFP (C) leads to increased nuclear density and the number of basally located esg+cells (arrows) compared with control (esgts>GFP) (B). Nuclei are stained with DAPI in all panels (blue), esg+cells are marked by GFP (green) and phalloidin staining is red. (D,D⬘) Orthogonal section of a 2-week-old MARCM hpoclone shows increased epithelial thickness (arrows) compared with surrounding GFP-negative control tissue. Progenitor cells are marked by armadillo (-catenin) staining (red). Confocal micrographs of adult posterior midguts. (E-G)esgts-driven expression of Yki (G) or Notch-RNAi (F) in ISCs and EBs induces an increase in
esg+ (green) cell number compared with control (E). Yki overexpression induces the appearance of esg+
cells with large nuclei (arrow), but smaller nuclei remain (arrowheads) (G, compare with E and F). Phalloidin is in red. (H-J)esgts-driven expression of Yki (I) or wts-RNAi (J) induces increased numbers of Dl+ cells compared with control (H). esg+cells are marked by GFP (green) and Dl is in red. (K-M)esgts-driven expression of Yki (L) or wts-RNAi (M) increases the number of PH3+ cells compared with control (K).
esg+cells are marked by GFP (green) and PH3 is in red. Scale bars: 10m in E-G; 20m in B-D⬘,H-M. (N)Quantification of Dl+ cells. esgts-driven expression of Yki significantly increases the total number of Dl+ cells in adult midguts compared with control.
P<0.001, n>10. (O)Quantification of PH3+ cells.
esgts-driven expression of Yki or wts-RNAi significantly increases the total number of PH3+ cells in adult midguts compared with control. In both cases,
P<0.0001, n>15. (P)hpo42-47or savshrp1mutant MARCM clones increased mitotic rates (PH3+ cells/gut) along the entire midgut compared with control clones. P<0.0001, n12. (Q)Increased cell number in 7-day-old savshrp1mutant MARCM clones (n46) compared with neutral MARCM clones (n74).
P<0.0001.
D
E
V
E
LO
P
M
E
N
approach to generate hpoor savmutant clones and assess their impact on global midgut proliferation. Although control MARCM clones generally led to elevated numbers of PH3+ cells in midgut tissue, loss of either hpoor sav significantly increased mitoses (Fig. 1P). Finally, we measured the size of sav and control MARCM clones after 7 days and observed a significant increase in mutant clone sizes when compared with controls (Fig. 1Q). Thus, Hpo pathway inactivation promotes ISC division.
Effect of Hpo pathway inactivation on midgut terminal differentiation
Next, we studied whether Hpo signalling affects terminal differentiation of midgut cells. Secretory ee cells represent ~10% of differentiated cells in the midgut and can be marked by Pros staining (Fig. 2A). We observed no apparent change in the number of ee cells upon Hpo pathway inactivation using esgts(Fig. 2B-D).
The class II POU domain transcription factor Pdm1 stains the large polyploid nuclei of ECs (Fig. 2E,E⬘) (Lee et al., 2009). Hpo pathway inactivation did not block EC differentiation (Fig. 2F,F⬘,G,G⬘). However, close study of Pdm1 expression in both UAS-ykiand wts-RNAi backgrounds revealed that some Pdm1+ cells retained esg expression (Fig. 2F,G). In addition, many Pdm1+ cells appeared to be larger than control ECs (compare Fig. 2F,F⬘
with 2E,E⬘). It is plausible that this increased cell size is due to increased endoreplication as a result of yki overexpression. Sustained esgGFPexpression in ECs has been suggested to be indicative of an increased differentiation rate upon gut regenerative growth, which would cause a perdurance of GFP expression in differentiated cells (Jiang et al., 2009). We generated both sav (Fig. 2H,H⬘) and wts(see Fig. S3 in the supplementary material) mutant MARCM clones and confirmed the presence of Pdm1+ cells. The percentage of Pdm1+ cells per clone was normal in savmutant clones (Fig. 2I). Thus, Hpo pathway inactivation leads to increased ISC proliferation, while still allowing terminal differentiation to proceed. This is in contrast to Notch inactivation, which prevents terminal differentiation (Ohlstein and Spradling, 2007).
Effect of Hpo pathway inactivation in ECs
Expression induced by the esgtsdriver is mostly restricted to ISCs
[image:5.612.322.547.59.340.2]and EBs, though some transcript and protein product is likely to persist in ECs, given that there are no transit-amplifying divisions in the ISC lineage. As Hpo pathway inactivation elicits a phenotype Fig. 2. Hpo pathway inactivation does not prevent
differentiation. (A-C)esgts-driven expression of Yki (B) or wts-RNAi (C) does not alter ee cell number compared with control (A). Nuclei are stained with DAPI (blue) in all panels; esg+cells are marked by GFP (green) and Pros is red. (D)Pros+ cell number in the indicated genotypes (n>15). (E-G⬘) esgts-driven expression of Yki (F,F⬘) or wts -RNAi (G,G⬘) increases EC nuclear size compared with control (E,E’).
esg+cells are marked by GFP (green) and Pdm1 marked ECs are red. (H,H’) Daughter cell differentiation to Pdm1+ ECs in sav MARCM clones after 2 weeks of clone growth (arrows). Mutant clones are marked by GFP (green) and Pdm1 is red. Scale bar: 20m.
[image:5.612.52.300.61.315.2](I)Percentage of Pdm1+ cells per clone in 1-week-old savshrp1mutant MARCM clones compared with neutral MARCM clones.
Fig. 3. Hpo pathway inactivation in ECs triggers Delta expression and proliferation of ISCs. (A-B⬙) MyoIAts-driven expression of Yki (B-B⬙) in ECs induces a marked increase in the number of Dl+ cells compared with control (A-A⬙). Nuclei are stained with DAPI (blue) in all panels, ECs are marked by GFP (green) and Dl is red. (C-E)MyoIAts -driven expression of Yki (D) or wts-RNAi (E) in ECs induces an increase in the number of PH3+ cells compared with control (C). ECs are marked by GFP (green) and PH3 is red. Scale bars: 20m. (F)Quantification of Dl+ cells in the indicated genotypes *P<0.0001, n>10.
(G)Quantification of PH3+ cells in the indicated genotypes *P<0.0001,
n>15 guts. (H)MyoIAts-driven expression of Yki significantly increases cellularity in the posterior midgut epithelium. Cell numbers were quantified by counting all nuclei in an epithelial sheet of given surface area in the posterior midgut region after z-projection and normalization to tissue size. Data shown as mean ± s.e.m. *P<0.01, n5 guts (>1500 nuclei).
D
E
V
E
LO
P
M
E
N
similar to that observed upon stress signalling activation in ECs, we examined the effects of Yki overexpression specifically in this cell population. MyoIAGal4is an enhancer trap inserted in the gut-specific brush border myosin IAgene (Morgan et al., 1994). The inducible Myo1AGal4, tubGal80tssystem (MyoIAts) drives UAS
expression in midgut ECs (Fig. 3A) (Jiang et al., 2009).
We used the MyoIAts system combined with UAS-GFP in
order to drive UAS-yki in the polyploid ECs. When restricted to the EC population, UAS-yki overexpression induced a strong increase in Dl and PH3 staining (Fig. 3A-G) along with clusters of small esg+cells and some perduring esg-lacZexpression in ECs (see Fig. S4C-F⬙in the supplementary material). Similar results were seen with wts-RNAi (see Fig. S4A-B⬘ in the supplementary material). Higher PH3+ cell numbers were apparent in MyoIAtsUAS-yki and MyoIAtswts-RNAi guts,
indicating that Hpo pathway inactivation in ECs can potently trigger proliferation in ISCs (Fig. 3D,E,G). In accordance with the increased proliferation, cell density was increased in MyoIAtsUAS-yki guts compared with controls (Fig. 3H).
Importantly, Yki overexpression in ECs did not induce widespread apoptosis in the posterior midgut (see Fig. S4G-H⬘ in the supplementary material), as shown by Caspase 3 (Cas3)
staining. Upd3 overexpression, which also triggers ISC proliferation, induced a mild increase in Cas3 staining (see Fig. S4I,I⬘ in the supplementary material). Thus, Hpo pathway inactivation in ECs, as well as in mutant SC clones, can induce non-autonomous proliferation of neighbouring ISCs.
Non cell-autonomous effects of Hpo pathway inactivation
To further investigate the non cell-autonomous effects of Hpo pathway repression, we examined Dl expression in a clonal context. The induction of Yki overexpressing Flipout clones revealed an increase in Dl expression both within clones and in the surrounding wild-type tissue (Fig. 4A-B⬙). Furthermore, wtsmutant MARCM clones led to the formation of large Dl+ cells in the surrounding region (see Fig. S5A-B⬙ in the supplementary material). We also assayed DNA synthesis rates by BrdU incorporation. We observed an increased frequency of replicating cells in savmutant clones (Fig. 4C-G). These data indicate higher DNA replication frequencies in ISCs and ECs. Again, these effects were not confined to cells within the mutant clones, confirming the non-autonomous effect of Hpo pathway inactivation (Fig. 4G). By contrast, known targets of the Hpo pathway such as expanded(ex) (Hamaratoglu et al., 2006) were only upregulated in the mutant clone areas as expected (see Fig. S5C-D⬙in the supplementary material).
Induction of Upd expression upon Hpo pathway inactivation
The strong non cell-autonomous effects of Yki overexpression in the ECs on ISC proliferation and the parallels between Yki-induced tissue overproliferation and damage-Yki-induced tissue growth led us to hypothesize that Yki activation may influence ISC behaviour via Jak/Stat signalling. Cytokines of the Unpaired (upd) family are upregulated upon intestinal stress (Buchon et al., 2009b). In turn, the upd ligands activate the Jak/Stat pathway, promoting ISC proliferation. Mutating hpoin MARCM clones revealed increased levels of upd-lacZ expression compared with the surrounding midgut tissue, though not all clones are equally affected (Fig. 5A-A⬙). Similar effects were confirmed in wts-mutant MARCM clones (see Fig. S6A-B⬙in the supplementary material). upd-lacZexpression was no longer observed in MARCM clones deficient for both hpo and its downstream target yki (Fig. 5B-B⬙). Upd3 has been reported to be the main mediator of the stress response to bacterial infection (Jiang et al., 2009). We used a tubulin Flipout transgenic to drive clonal Yki expression (Dong et al., 2007; Huang et al., 2005) in the gut, and monitored upd3expression with a UAS-GFP driven by a transgenic upd3-GAL4driver. Clonal overexpression of Yki induced a robust induction of upd3>GFPin ECs (Fig. 5C-C⬙). This suggests that Hpo pathway downregulation promotes midgut regeneration by inducing transcription of updgenes in a yki-dependent manner.
The transcriptional activity of Jak/Stat signalling can be monitored using a multimerised Stat92E reporter driving the expression of a destabilised GFP [10XStat-dGFP (Bach et al., 2007)]. Expression of Yki in ECs (Fig. 5D-F⬘) or esg+cells (see Fig. S6C-D⬘in the supplementary material) led to an increase in Jak/Stat reporter expression, both by immunofluorescence and reverse-transcription quantitative polymerase chain reaction (RT-qPCR). This increase was mainly apparent at the basal layer, where the ISCs and EBs are located (Fig. 5E-F⬘; see Fig. S6C-D⬘in the supplementary material; data not shown). Finally, we used RT-Fig. 4. Clonal Hpo pathway inactivation induces non
cell-autonomous effects. (A-B⬙) Flipout clones overexpressing Yki (B-B⬙) induce an increase in Dl compared with control (A-A⬙). Nuclei are stained with DAPI (blue); GFP is green and Dl is in red. (C-E⬘) Cell-autonomous and non cell-Cell-autonomous increases in DNA replication rates (BrdU incorporation) upon induction of savshrp1mutant GFP marked MARCM clones (C,C⬘) compared with neutral clones (E,E⬘). Higher magnification image of savshrp1mutant clones (D,D⬘). GFP is green and BrdU is red. (F)BrdU labelling rates were quantified as the percentage of BrdU-positive cells per MARCM clone (cell autonomy) in
savshrp1mutants compared with neutral clones after 3D confocal imaging of the entire clone and subsequent 3D projection. *P>0.0001. (G)Number of BrdU-positive nuclei within all midgut cells, including clone and non-clone tissue (non-cell autonomy). *P>0.01. Scale bars: 20m.
D
E
V
E
LO
P
M
E
N
[image:6.612.51.298.61.311.2]qPCR to quantitatively show that expression of all three updgenes and the endogenous Jak/Stat target Socs36ewere elevated when Yki was overexpressed in the ECs (Fig. 5G). Together, these results show that Hpo pathway disruption in the ECs leads to increased abundance of Jak/Stat ligands and an increase in Stat transcriptional activity.
Loss of Jak/Stat signalling in ISCs rescues the Yki overexpression phenotype
To test whether the Hpo pathway is indeed dependent on Jak/Stat signalling to induce ISC proliferation, we performed epistasis experiments (Fig. 6). Expression of a stat-RNAi construct was able to suppress the increased proliferation and Dl levels seen upon Yki overexpression in progenitor cells (Fig. 6A-H,Q). By contrast, stat -RNAi expression in ECs did not suppress the Yki induced non cell-autonomous regenerative response (Fig. 6I-P,R). This suggests that Yki-induced ISC proliferation requires Stat activity in the ISCs themselves, but not the ECs.
Yki activation by intestinal stress
Jak/Stat signalling plays a key role in midgut regeneration following various forms of stress (Buchon et al., 2009b; Jiang et al., 2009). We therefore tested whether Hpo signalling might play a role in sensing intestinal stress. Ingestion and enteric infection with Pseudomonas entomophila(P.e) was reported to kill ECs and activate JNK signalling (Vodovar et al., 2005). P.einfection leads to induction of Upd/Jak/Stat signalling, which drives ISC mitoses
and intestinal regeneration (Buchon et al., 2009b; Jiang et al., 2009). To monitor Hpo pathway activity during tissue damage, we first measured the expression of two well-characterised Yki targets, exand diap1, (Hamaratoglu et al., 2006; Huang et al., 2005) by RT-qPCR at various time points after P.e infection (Fig. 7A). Expression of both exand diap1was significantly and rapidly induced upon P.einfection, up to sixfold and 2.6-fold, respectively. Importantly, this activation preceded the induction of ISC division. As expected for a regenerative response, upd2, upd3, Socs36eand the JNK target puckered (puc) are also induced with the same kinetics. cyclin Elevels are elevated, presumably as part of the proliferative response. The induction of both exand diap1was prevented when the P.e-infected flies were treated with antibiotics (Fig. 7A, lower panel). The JNK pathway is also part of the regenerative response and its ectopic activation is sufficient to induce ISC proliferation (Amcheslavsky et al., 2009; Biteau et al., 2008; Buchon et al., 2009a; Cronin et al., 2009; Jiang et al., 2009). Interestingly, JNK activation by silencing of the JNK phosphatase Puc also induced a threefold increase in Yki target gene expression (see Fig. S7A in the supplementary material). These results suggest that Yki transcriptional activity is induced in response to different modes of intestinal stress.
To determine in which cells Yki activity responds to stress signals, we first examined ex expression using the ex-LacZ enhancer trap line (Hamaratoglu et al., 2006). P.e infection induced a rapid increase in exexpression in the large ECs (Fig. 7B-C⬘). We also examined expression of Yki itself using an
anti-Fig. 5. Hpo pathway inactivation induces Upd expression. (A-A⬙)upd-lacZexpression is increased in
hpo-mutant MARCM clones compared with surrounding midgut tissue. (B-B⬙)upd-lacZinduction is abolished in
hpo,ykidouble mutant MARCM clones. Nuclei are stained with DAPI (blue), mutant clones are marked by GFP (green) and -galactosidase is red. (C-C⬙) Clonal overexpression of Yki leads to increased upd3GFP
expression. upd3GFP is green and Yki is red. (D-F⬘) RT-qPCR and immunofluorescence analysis of adult midguts reveals increased Jak/Stat activity following Yki
overexpression in ECs using the 10⫻StatdGFP reporter (D). StatdGFP is green and PH3 is red. (G)Induction of all three Upd cytokines following MyoIAts-driven expression of Yki measured by RT-qPCR. Scale bars: 20m.
D
E
V
E
LO
P
M
E
N
[image:7.612.56.337.59.415.2]Yki antibody (Oh and Irvine, 2008). Yki expression was mainly cytoplasmic under standard conditions (Fig. 7D,D⬘). Twenty-four hours after P.einfection, we noted a strong increase in Yki levels in the esg+cells (ISCs/EBs) and some ECs (Fig. 7E,E⬘). In an independent test, we observed that Yki-GFP (Oh and Irvine, 2008) expressed in Myo1A+ ECs also accumulates in these cells upon treatment with the oxidative stressor paraquat (Fig. 7F-G⬘). Although we could not reliably detect increased endogenous Yki in all EC nuclei after oral P.einfection, we noted that Yki-GFP expressed in progenitors displayed increased cytoplasmic and nuclear abundance upon acute paraquat treatment (see Fig. S7B-C⬘ in the supplementary material). Second, together with increased endogenous Yki levels, we could detect increased nuclear Yki abundance upon derepression of JNK activity in the midgut by depleting Puc (see Fig. S7D,E in the supplementary material). These experiments suggest that Yki activity is triggered in both the EC and ISC/EB population by intestinal stress. This raises the possibility that Yki functions as a stress sensor, relaying information about the health of the epithelium to the ISCs.
Requirement for Yki in the proliferative response to P.einfection
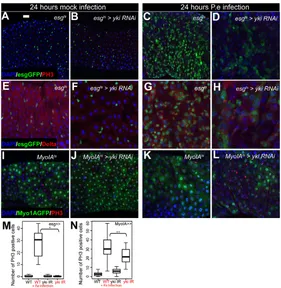
To test the function of Yki in the regenerative response, we suppressed Yki expression in ECs or ISC/EBs using RNAi, and measured P.e-induced proliferation using PH3 staining (Fig. 8). Interestingly, silencing Yki in the ISCs/EBs using esgts fully
suppressed the P.e-induced proliferative response (Fig. 8A-H,M).
Together with the stress-induced increase in Yki expression in ISCs and EBs shown in Fig. 7, this suggests that Yki is required in ISCs for stress-induced proliferation.
When we suppressed Yki expression with RNAi in the ECs using MyoIAts, we observed only a partial (though statistically
significant; P0.018) suppression of the P.e-induced proliferative response (Fig. 8I-L,N). This suggests that, though the Hpo pathway responds to intestinal stress (Fig. 7), it may not be absolutely required in ECs for triggering Jak/Stat-induced regeneration. A more trivial explanation is that suppressing Yki by RNAi in the dividing ISCs may be more effective than in the post-mitotic ECs, where ykitranscript and Yki protein are not diluted by cell division. Given that ECs are rapidly shed following infection and replaced by new preECs (which have elevated Yki protein levels due to the infection) it is probably difficult to fully deplete Yki in ECs before they are sloughed off.
DISCUSSION
Hippo pathway inactivation in ISCs or ECs elicits regenerative growth
We investigated the role of Hpo signalling in different cell types of the adult Drosophilamidgut. wtsloss or Yki overexpression led to increased numbers of proliferating ISCs, though terminal differentiation was not blocked (Figs 1-3). Given the well-documented role of Yki in proliferation, we were not surprised to find that expression of Yki in progenitors induced overproliferation. However, careful examination of the phenotype suggests that the effects of Yki expression are not merely restricted to a
cell-Fig. 6. Yki activity is upstream of Jak/Stat signalling in ISCs. (A-H)The esgts-Yki-induced overproliferation and increase in Dl+ cells (B,F) is prevented by co-expression of
Stat-RNAi (D,H). Nuclei are stained with DAPI (blue), esg+cells are marked by GFP (green); PH3 (A-D) and Dl (E-H) are red. (I-P)The MyoIAts-Yki-induced overproliferation and increase in Dl+ cells (J,N) is not rescued by co-expression of Stat-RNAi (L,P). ECs are marked by GFP (green); PH3 (I-L) and Dl (M-P) are red. Quantification of PH3+ cells per midgut. (Q)esgts -driven expression of Stat-RNAi significantly rescues Yki-induced proliferation (P<0.0001, n>20). (R)MyoIAts-driven expression of Stat-RNAi does not rescue Yki-induced proliferation in ECs (n>15). Scale bar: 20m.
D
E
V
E
LO
P
M
E
N
[image:8.612.52.329.60.410.2]autonomous induction of proliferation. Indeed, pathway silencing in terminally differentiated ECs non-autonomously induced strong ISC proliferation (Fig. 3). This finding led us to suspect a parallel between Hpo silencing and the regenerative response to intestinal stress, which elicits a very similar effect (Amcheslavsky et al., 2009; Beebe et al., 2010; Biteau et al., 2008; Buchon et al., 2009a; Buchon et al., 2009b; Cronin et al., 2009; Jiang et al., 2009; Liu et al., 2010). Bacterial infection, cell death or ageing, trigger the release of Upd cytokines by ECs or ISCs, which induces ISC proliferation and differentiation, allowing the replacement of cells eliminated by noxious stimuli. We found that Yki overexpression triggers increased levels of upd transcription and Stat reporter activity (Fig. 5). Perhaps because of this, Yki expression or wtsinactivation is sufficient to trigger regenerative growth in the fly intestine.
Is the transcriptional upregulation of Upd cytokines by Yki a general phenomenon? Clonal Yki overexpression in wing imaginal discs led to increased upd-LacZlevels (see arrowhead in Fig. S8A-B⬙ in the supplementary material). upd-lacZ upregulation was only seen close to the endogenous upd -expressing areas in the wing hinge (Bach et al., 2007). This could suggest either that Yki can promote updexpression only in certain cellular contexts or that Yki promotes sustained expression of Upd but is unable to initiate its transcription. Non-autonomous functions of Hpo signalling may prove broadly significant, as the Epidermal Growth Factor Receptor (EGFR) ligand Amphiregulin is a YAP/Yki target, as is Vein in the fly (Zhang et al., 2009).
Yki as a sensor of epithelial stress
Can Yki function as a stress sensor in ECs, triggering ISC proliferation in response to damage? This is a particularly interesting possibility as such sensors have not yet been identified. Consistent with this idea, our results suggest that Yki activity is elevated in ECs in response to bacterial infection (Fig. 7). Furthermore, silencing of Yki in ECs reduced the proliferative response of ISCs to P.einfection (Fig. 8). This effect was relatively small, however, suggesting that either we were unable to sufficiently silence Yki activity in ECs, or that Yki may play a redundant role in the stress response, possibly in concert with other pathways such as JNK signalling. A very recent study (Staley and Irvine, 2010) reports a non-autonomous function for the Hpo pathway in midgut regeneration consistent with our work. Interestingly, Staley and Irvine observed that the regenerative response elicited by the DNA damaging agent bleomycin was also partially reduced by Yki depletion. Similar to our study, this suggests a general role for Yki in the intestinal damage response. In contrast to our findings using both Yki overexpression and Wts depletion (Fig. 1), Staley and Irvine do not observe an effect on ISC proliferation upon expression of Yki-S168A:V5 in the progenitors. This probably reflects the relative strength of the Yki transgenes used.
[image:9.612.54.358.59.420.2]Interestingly, both our work and that of the Irvine laboratory show that increased JNK signalling can drive Yki activation (see Fig. S7 in the supplementary material) (Staley and Irvine, 2010), suggesting a link between the two pathways in mediating the Fig. 7. Intestinal stress results in increased Yki levels and induction of Hpo pathway targets. (A)RT-qPCR shows Yki target induction (expanded, diap1) immediately upon P.einfection (top panel) and reversal of Yki target mRNA abundance following antibiotic treatment (bottom panel). (B-C⬘) Increased ex-LacZactivity following 12 hours of P.einfection (C,C⬘) compared with mock-infected guts (B,B⬘). Nuclei are stained with DAPI (blue), -galactosidase is red. (D-E⬘) Twenty-four hour P.einfection leads to increased Yki levels in
esg+ progenitors and ECs (E-E⬘) compared with mock-infected guts (D,D⬘).esg+cells are marked by GFP (green), Yki is red. (F-G⬘) Increased Yki levels following treatment for 16 hours with paraquat (G,G⬘) compared with non stressed gut (F,F⬘). GFP is green and Yki is red. Scale bars: 20m.
D
E
V
E
LO
P
M
E
N
proliferative stress response. As JNK activity is required for the response to Erwinia carotovora (Buchon et al., 2009b) but not to P.e infection (Jiang et al., 2009), it will be important to study further the link between JNK and Hpo signalling in regeneration. Finally, although Yki activity clearly responds to stress, it is also possible that inactivation of the Hpo pathway itself causes stress in the ECs (possibly by blocking or delaying physiological cell death or driving inappropriate cell growth), and that this might lead to the upregulation of Upd signalling via a distinct sensor.
How does the Hpo pathway sense epithelial integrity? The transmembrane protein Crumbs, as well as several other apico-basal polarity determinants and apical scaffold proteins can modulate Hpo pathway activity (Baumgartner et al., 2010; Chen et al., 2010; Das Thakur et al., 2010; Genevet et al., 2010; Grusche et al., 2010; Grzeschik et al., 2010; Hamaratoglu et al., 2006; Ling et al., 2010; Robinson et al., 2010; Yu et al., 2010; Zhao et al., 2008). In addition, the mammalian Hpo pathway has been implicated in contact inhibition of growth in cultured cells (Zhao et al., 2007). EC cell loss might therefore inactivate the Hpo pathway owing to local changes in cellular density, mechanical environment and/or disruption of polarity determinants, leading to Yki de-repression and activation of the regenerative response. In this context, the Hpo pathway may therefore be a guardian of ‘epithelial health’, inducing a regenerative proliferative response following cellular damage.
A dual role for Yki in the intestinal regenerative response
Our data also point to a function for Yki in ISCs. First, Yki expression is increased in ISCs upon intestinal stress (Fig. 7). Second, silencing Yki in ISCs abolished the proliferative response to P.einfection (Fig. 8). This ‘cell-autonomous’ growth-promoting function is similar to the known role of Yki as a growth driver in Drosophilaimaginal discs and in mammalian tissues. Indeed, Yki
family proteins have been reported to promote progenitor cell proliferation in the mouse intestine and tissue regeneration both in the Cricket leg and mouse liver (Bando et al., 2009; Camargo et al., 2007; Dong et al., 2007).
How is Yki activated in ISCs? Our data (Fig. 7A,F-G⬘) suggest that at least part of the Yki accumulation occurs due to a post-transcriptional mechanism. However, whether this is mediated through canonical Hpo signalling remains to be established. Furthermore, the possible role of Yki in basal ISC proliferation, or ISC maintenance and survival, also warrants further investigation. We did not observe a strong loss of ISCs under baseline homeostatic conditions when Yki was depleted by RNAi (data not shown), suggesting it might only drive growth under regenerative conditions or upon loss of a tumour suppressor.
In summary, we have shown that, beyond a role as a classical tumour suppressor pathway, the Hpo pathway in the Drosophila midgut integrates environmental conditions and helps to promote tissue regeneration in response to damage. It will be very interesting to study whether this function is conserved in higher organisms and to test its relevance to tissue regeneration in different contexts and to cancer formation.
Acknowledgements
[image:10.612.50.331.59.347.2]We thank S. Bray, D. Pan, G. Halder, H. Jiang, K. Irvine and W. Chia for fly stocks and reagents. We also thank the Vienna DrosophilaRNAi Centre and the Bloomington DrosophilaStock Center for fly stocks. We are grateful to B. Thompson, D. Ish-Horowicz, P. Ribeiro, A. Genevet, M. Wehr, E. Chan and M. Zˇigman for comments on the manuscript, along with G. Kelly and S. Horswell for advice on statistical analysis. We thank T. Gilbank, S. Maloney and F. Earl for fly maintenance, and S. Kreger for excellent experimental support. We are grateful to the Nikon Imaging Center Heidelberg for providing the A1R confocal microscope, technical support and infrastructure. A.K. is supported by a Human Frontier Science Program Long-Term postdoctoral fellowship (LT00316/2008-L). Research in the Tapon Lab is supported by Cancer Research UK. Research in the Edgar Lab, FHCRC, is supported by NIH GM51186. Deposited in PMC for release after 12 months.
Fig. 8. Yki is required for the midgut regenerative response to bacterial infection.(A-H)P.einfection induces a proliferative response with increased numbers of esg+ cells, mitoses, Dl+ ISC-like cells and midgut size (A,C,E,G). esgts -driven expression of yki-RNAi (B,F) causes a reduction in the midgut regenerative response to infection (D,H). (I-L)MyoIAts -driven expression of yki-RNAi (J) partially prevents the midgut regenerative response to stress (L). Nuclei are stained with DAPI (blue); esg+cells (A-H) and ECs (I-L) are marked by GFP (green); PH3 (A-D, I-L) and Dl (E-H) are red. (M,N)Quantification of PH3+ cells upon bacterial infection.esgts-driven expression of a yki-RNAi construct prevents the regenerative response seen in wild-type midguts upon bacterial infection (M) (*P<0.001,
n>10). MyoIAts-driven expression of yki-RNAi partially rescues the midgut regenerative response following bacterial infection (N) (**P0.018, n>14). Scale bar: 20m.
D
E
V
E
LO
P
M
E
N
Competing interests statement
The authors declare no competing financial interests.
Supplementary material
Supplementary material for this article is available at
http://dev.biologists.org/lookup/suppl/doi:10.1242/dev.052506/-/DC1
References
Agaisse, H., Petersen, U. M., Boutros, M., Mathey-Prevot, B. and Perrimon, N.(2003). Signaling role of hemocytes in Drosophila JAK/STAT-dependent response to septic injury. Dev. Cell5, 441-450.
Amcheslavsky, A., Jiang, J. and Ip, Y.(2009). Tissue damage-induced intestinal stem cell division in drosophila. Cell Stem Cell4, 49-61.
Arbouzova, N. I. and Zeidler, M. P.(2006). JAK/STAT signalling in Drosophila: insights into conserved regulatory and cellular functions. Development133, 2605-2616.
Bach, E. A., Ekas, L. A., Ayala-Camargo, A., Flaherty, M. S., Lee, H., Perrimon, N. and Baeg, G. H.(2007). GFP reporters detect the activation of the Drosophila JAK/STAT pathway in vivo. Gene Expr. Patterns7, 323-331.
Bando, T., Mito, T., Maeda, Y., Nakamura, T., Ito, F., Watanabe, T., Ohuchi, H. and Noji, S.(2009). Regulation of leg size and shape by the Dachsous/Fat signalling pathway during regeneration. Development136, 2235-2245.
Bardin, A. J., Perdigoto, C. N., Southall, T. D., Brand, A. H. and Schweisguth, F.(2010). Transcriptional control of stem cell maintenance in the Drosophila intestine. Development137, 705-714.
Baumgartner, R., Poernbacher, I., Buser, N., Hafen, E. and Stocker, H.(2010). The WW domain protein Kibra acts upstream of Hippo in Drosophila. Dev. Cell
18, 309-316.
Beebe, K., Lee, W. C. and Micchelli, C. A.(2010). JAK/STAT signaling coordinates stem cell proliferation and multilineage differentiation in the Drosophila intestinal stem cell lineage. Dev. Biol. 338, 28-37.
Biteau, B., Hochmuth, C. E. and Jasper, H.(2008). JNK activity in somatic stem cells causes loss of tissue homeostasis in the aging Drosophila gut. Cell Stem Cell
3, 442-455.
Bjerknes, M. and Cheng, H.(1999). Clonal analysis of mouse intestinal epithelial progenitors. Gastroenterology116, 7-14.
Buchon, N., Broderick, N., Poidevin, M., Pradervand, S. and Lemaitre, B.
(2009a). Drosophila intestinal response to bacterial infection: activation of host defense and stem cell proliferation. Cell Host Microbe5, 200-211.
Buchon, N., Broderick, N. A., Chakrabarti, S. and Lemaitre, B.(2009b). Invasive and indigenous microbiota impact intestinal stem cell activity through multiple pathways in Drosophila. Genes Dev. 23, 2333-2344.
Camargo, F., Gokhale, S., Johnnidis, J., Fu, D., Bell, G., Jaenisch, R. and Brummelkamp, T.(2007). YAP1 increases organ size and expands undifferentiated progenitor cells. Curr. Biol.17, 2054-2060.
Chen, C. L., Gajewski, K. M., Hamaratoglu, F., Bossuyt, W., Sansores-Garcia, L., Tao, C. and Halder, G.(2010). The apical-basal cell polarity determinant Crumbs regulates Hippo signaling in Drosophila. Proc. Natl. Acad. Sci. USA107, 15810-15815.
Clevers, H.(2009). Searching for adult stem cells in the intestine. EMBO Mol. Med.1, 255-259.
Cronin, S. J., Nehme, N. T., Limmer, S., Liegeois, S., Pospisilik, J. A., Schramek, D., Leibbrandt, A., Simoes Rde, M., Gruber, S., Puc, U. et al.
(2009). Genome-wide RNAi screen identifies genes involved in intestinal pathogenic bacterial infection. Science325, 340-343.
Crosnier, C., Stamataki, D. and Lewis, J.(2006). Organizing cell renewal in the intestine: stem cells, signals and combinatorial control.Nat. Rev. Genet. 7, 349-359.
Das Thakur, M., Feng, Y., Jagannathan, R., Seppa, M. J., Skeath, J. B. and Longmore, G. D.(2010). Ajuba LIM proteins are negative regulators of the Hippo signaling pathway.Curr. Biol. 20, 657-662.
Dong, J., Feldmann, G., Huang, J., Wu, S., Zhang, N., Comerford, S. A., Gayyed, M. F., Anders, R. A., Maitra, A. and Pan, D.(2007). Elucidation of a universal size-control mechanism in Drosophila and mammals. Cell130, 1120-1133.
Fre, S., Huyghe, M., Mourikis, P., Robine, S., Louvard, D. and Artavanis-Tsakonas, S.(2005). Notch signals control the fate of immature progenitor cells in the intestine. Nature435, 964-968.
Furriols, M. and Bray, S.(2001). A model Notch response element detects Suppressor of Hairless-dependent molecular switch.Curr. Biol. 11, 60-64.
Genevet, A., Wehr, M. C., Brain, R., Thompson, B. J. and Tapon, N.(2010). Kibra is a regulator of the Salvador/Warts/Hippo signaling network. Dev. Cell18, 300-308.
Gregory, L., Came, P. J. and Brown, S.(2008). Stem cell regulation by JAK/STAT signaling in Drosophila. Semin. Cell Dev. Biol. 19, 407-413.
Grusche, F. A., Richardson, H. E. and Harvey, K. F.(2010). Upstream regulation of the hippo size control pathway.Curr. Biol. 20, R574-R582.
Grzeschik, N. A., Parsons, L. M., Allott, M. L., Harvey, K. F. and Richardson, H. E.(2010). Lgl, aPKC, and Crumbs regulate the Salvador/Warts/Hippo pathway through two distinct mechanisms.Curr. Biol. 20, 573-581.
Hamaratoglu, F., Willecke, M., Kango-Singh, M., Nolo, R., Hyun, E., Tao, C., Jafar-Nejad, H. and Halder, G.(2006). The tumour-suppressor genes NF2/Merlin and Expanded act through Hippo signalling to regulate cell proliferation and apoptosis. Nat. Cell Biol. 8, 27-36.
Harvey, K. and Tapon, N.(2007). The Salvador-Warts-Hippo pathway-an emerging tumour-suppressor network. Nat. Rev. Cancer7, 182-191.
Harvey, K. F., Pfleger, C. M. and Hariharan, I. K.(2003). The Drosophila Mst ortholog, hippo, restricts growth and cell proliferation and promotes apoptosis.
Cell114, 457-467.
Huang, J., Wu, S., Barrera, J., Matthews, K. and Pan, D.(2005). The Hippo signaling pathway coordinately regulates cell proliferation and apoptosis by inactivating Yorkie, the Drosophila Homolog of YAP. Cell122, 421-434.
Jia, J., Zhang, W., Wang, B., Trinko, R. and Jiang, J.(2003). The Drosophila Ste20 family kinase dMST functions as a tumor suppressor by restricting cell proliferation and promoting apoptosis. Genes Dev. 17, 2514-2519.
Jiang, H., Patel, P. H., Kohlmaier, A., Grenley, M. O., McEwen, D. G. and Edgar, B. A.(2009). Cytokine/Jak/Stat signaling mediates regeneration and homeostasis in the Drosophila midgut. Cell137, 1343-1355.
Kango-Singh, M., Nolo, R., Tao, C., Verstreken, P., Hiesinger, P. R., Bellen, H. J. and Halder, G.(2002). Shar-pei mediates cell proliferation arrest during imaginal disc growth in Drosophila. Development129, 5719-5730.
Lai, Z. C., Wei, X., Shimizu, T., Ramos, E., Rohrbaugh, M., Nikolaidis, N., Ho, L. L. and Li, Y.(2005). Control of cell proliferation and apoptosis by mob as tumor suppressor, mats. Cell120, 675-685.
Lee, T. and Luo, L.(1999). Mosaic analysis with a repressible cell marker for studies of gene function in neuronal morphogenesis. Neuron22, 451-461.
Lee, W. C., Beebe, K., Sudmeier, L. and Micchelli, C. A.(2009). Adenomatous polyposis coli regulates Drosophila intestinal stem cell proliferation. Development
136, 2255-2264.
Ling, C., Zheng, Y., Yin, F., Yu, J., Huang, J., Hong, Y., Wu, S. and Pan, D.
(2010). The apical transmembrane protein Crumbs functions as a tumor suppressor that regulates Hippo signaling by binding to Expanded. Proc. Natl. Acad. Sci. USA107, 10532-10537.
Liu, W., Singh, S. R. and Hou, S. X.(2010). JAK-STAT is restrained by Notch to control cell proliferation of the Drosophila intestinal stem cells.J. Cell. Biochem.
109, 992-999.
Marshman, E., Booth, C. and Potten, C. S.(2002). The intestinal epithelial stem cell. BioEssays 24, 91-98.
McGuire, S. E., Le, P. T., Osborn, A. J., Matsumoto, K. and Davis, R. L.(2003). Spatiotemporal rescue of memory dysfunction in Drosophila. Science302, 1765-1768.
Micchelli, C. A. and Perrimon, N.(2006). Evidence that stem cells reside in the adult Drosophila midgut epithelium. Nature439, 475-479.
Morgan, N. S., Skovronsky, D. M., Artavanis-Tsakonas, S. and Mooseker, M. S.(1994). The molecular cloning and characterization of Drosophila
melanogaster myosin-IA and myosin-IB. J. Mol. Biol. 239, 347-356.
Oh, H. and Irvine, K. D.(2008). In vivo regulation of Yorkie phosphorylation and localization. Development135, 1081-1088.
Ohlstein, B. and Spradling, A.(2006). The adult Drosophila posterior midgut is maintained by pluripotent stem cells. Nature439, 470-474.
Ohlstein, B. and Spradling, A.(2007). Multipotent Drosophila intestinal stem cells specify daughter cell fates by differential notch signaling. Science315, 988-992.
Pantalacci, S., Tapon, N. and Leopold, P.(2003). The Salvador partner Hippo promotes apoptosis and cell-cycle exit in Drosophila. Nat. Cell Biol. 5, 921-927.
Pignoni, F., Hu, B. and Zipursky, S. L.(1997). Identification of genes required for Drosophila eye development using a phenotypic enhancer-trap. Proc. Natl. Acad. Sci. USA94, 9220-9225.
Radtke, F. and Clevers, H.(2005). Self-renewal and cancer of the gut: two sides of a coin. Science307, 1904-1909.
Robinson, B. S., Huang, J., Hong, Y. and Moberg, K. H.(2010). Crumbs regulates Salvador/Warts/Hippo signaling in Drosophila via the FERM-domain protein Expanded.Curr. Biol. 20, 582-590.
Sancho, E., Batlle, E. and Clevers, H.(2004). Signaling pathways in intestinal development and cancer. Annu. Rev. Cell Dev. Biol. 20, 695-723.
Staley, B. K. and Irvine, K. D.(2010). Warts and Yorkie mediate intestinal regeneration by influencing stem cell proliferation.Curr. Biol. 20, 1580-1587.
Tapon, N., Harvey, K. F., Bell, D. W., Wahrer, D. C., Schiripo, T. A., Haber, D. A. and Hariharan, I. K.(2002). salvador Promotes both cell cycle exit and apoptosis in Drosophila and is mutated in human cancer cell lines. Cell110, 467-478.
Udan, R. S., Kango-Singh, M., Nolo, R., Tao, C. and Halder, G.(2003). Hippo promotes proliferation arrest and apoptosis in the Salvador/Warts pathway. Nat. Cell Biol. 5, 914-920.
van Es, J. H., van Gijn, M. E., Riccio, O., van den Born, M., Vooijs, M., Begthel, H., Cozijnsen, M., Robine, S., Winton, D. J., Radtke, F. et al.
(2005). Notch/gamma-secretase inhibition turns proliferative cells in intestinal
crypts and adenomas into goblet cells. Nature435, 959-963.
D
Vodovar, N., Vinals, M., Liehl, P., Basset, A., Degrouard, J., Spellman, P., Boccard, F. and Lemaitre, B.(2005). Drosophila host defense after oral infection by an entomopathogenic Pseudomonas species. Proc. Natl. Acad. Sci. USA102, 11414-11419.
Wu, S., Huang, J., Dong, J. and Pan, D.(2003). hippo encodes a Ste-20 family protein kinase that restricts cell proliferation and promotes apoptosis in conjunction with salvador and warts. Cell114, 445-456.
Xu, T., Wang, W., Zhang, S., Stewart, R. A. and Yu, W.(1995). Identifying tumor suppressors in genetic mosaics: the Drosophila lats gene encodes a putative protein kinase. Development121, 1053-1063.
Yu, J., Zheng, Y., Dong, J., Klusza, S., Deng, W. M. and Pan, D.(2010). Kibra functions as a tumor suppressor protein that regulates Hippo signaling in conjunction with Merlin and Expanded. Dev. Cell18, 288-299.
Zhang, J., Ji, J. Y., Yu, M., Overholtzer, M., Smolen, G. A., Wang, R., Brugge, J. S., Dyson, N. J. and Haber, D. A.(2009). YAP-dependent induction of amphiregulin identifies a non-cell-autonomous component of the Hippo pathway. Nat. Cell Biol. 11, 1444-1450.
Zhao, B., Wei, X., Li, W., Udan, R. S., Yang, Q., Kim, J., Xie, J., Ikenoue, T., Yu, J., Li, L. et al.(2007). Inactivation of YAP oncoprotein by the Hippo pathway is involved in cell contact inhibition and tissue growth control. Genes Dev. 21, 2747-2761.
Zhao, M., Szafranski, P., Hall, C. A. and Goode, S.(2008). Basolateral junctions utilize warts signaling to control epithelial-mesenchymal transition and proliferation crucial for migration and invasion of Drosophila ovarian epithelial cells. Genetics178, 1947-1971.