Content based Image Retrieval based on the Integration
of Color Histogram, Color Moment and Gabor Texture
S. Mangijao Singh
Dept. of computer Science, Assam University, Silchar India, Pin code – 788011
K. Hemachandran
Dept. of computer science, Assam University, Silchar India, Pin code - 788011
ABSTRACT
Content-Based Image Retrieval (CBIR) systems help users to retrieve relevant images based on their contents such as color and texture. In this paper, a new approach is proposed in which color histogram, color moment and Gabor texture descriptors are integrated. The color histogram has the advantages of rotation and translation invariance. The HSV (16, 4, 4) quantization scheme has been adopted for color histogram and an image is represented by a vector of 256-dimension. The color histogram has the disadvantages of lack of spatial information and to improve the discriminating power of color indexing techniques, a minimal amount of spatial information is encoded in the color index by dividing the image horizontally into three equal non-overlapping regions and extracts the three moments (mean, variance and skewness) from each region, for all the color channels. Thus, for a HSV color space, 27 floating point numbers per image are used for indexing. As its texture feature, Gabor texture descriptors are adopted. Weights are assigned to each feature respectively and calculate the similarity with combined features of color histogram, color moment and Gabor texture using Histogram intersection distance and Canberra distance as similarity measures. Experimental results show that the proposed method has higher retrieval accuracy in terms of precision than other conventional methods combining color histogram, color moment and Gabor texture based on global features approach.
Keywords
CBIR, color feature, color histogram, color moment, Gabor texture, Canberra distance.
1.
INTRODUCTION
Nowadays there is an exponential growth of image data and this has compelled the need for innovative tools which can easily manage, retrieve and visualize images from the large multimedia databases. Calvin Moores proposed Information Retrieval [1] in 1951. In this process, information was organized and stored according to a certain way, and in accordance with the needs of users to find the interrelated information. It is also called “Information Storage and Retrieval”. However, at that time, the retrieval was based on the text of the document. By age 70, database experts began to study how to manage data effectively. The main philosophy in text based image retrieval is to establish a relation between a Keyword or text description of the title as well as some additional information and the storage path of the image. However, with the growing storage capacity of databases, the text-based image retrieval technology lead to certain difficulties like: 1. it has become impossible to note each and every image in the database; 2. the subjectivity and non-precision of image annotation may lead to ambiguity in the retrieval process. In order to overcome these problems, Content based image retrieval (CBIR) was proposed in the 90’s.
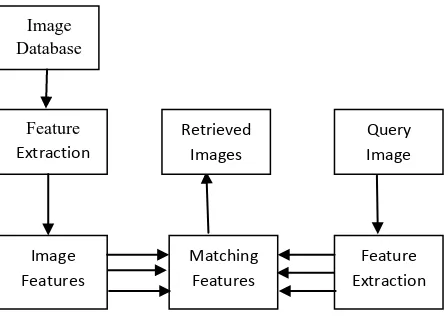
Because of the proliferation of video and image data in digital form, Content-based image retrieval (CBIR) [2] has become a prominent research topic. The increased bandwidth availability to access the internet in the near future will allow the users to search for and browse through video and image databases located at remote sites. Therefore, fast retrieval of images from large databases is an important problem that needs to be addressed. The desired characteristics of CBIR systems are High retrieval efficiency and less computational complexity. In content-based image retrieval (CBIR) system, images would be indexed by their visual content such as color, texture, shape etc. and the desired images are retrieved from a large collection, on the basis of features that can be automatically extracted from the images themselves [3]. Considerable research work has been done to extract these low level image features [4 and 5], evaluate distance metrics, and look for efficient searching schemes [6 and 7]. Basically, most CBIR systems work in the same way: A feature vector is extracted from each image in the database and the set of all feature vectors is organized as a database index. At query time, a feature vector is extracted from the query image and it is matched against the feature vectors in the index. The crucial difference between the various systems lies in the features that they extract and in the algorithms that are used to compare feature vectors. The block diagram of a basic CBIR system is shown in Fig. 1.
[image:1.595.320.544.569.730.2]In the whole retrieval process, feature extraction is crucial [8], it is closely related to all aspects of the future. The most commonly used features in image retrieval are the color, texture, shape and space. In recent years, many scholars began to study high-level semantic features of images. In practice, a feature or a combination of several features is often used to search for images and in this study the feature vectors based on color histogram, color moment and Gabor texture are integrated to search for images.
Fig. 1: Block diagram of CBIR Image
Database
Query Image Retrieved
Images Feature
Extraction
Feature Extraction Matching
Features Image
Color, texture, local shape and spatial information in a variety of forms are the most widely used features in such systems [9]–[12]. Because of high demand for searching image databases of ever-growing size, CBIR is becoming very popular. As speed and precision are important, it is needed to develop a system for retrieving images that is efficient. Compared with texture and shape information, the color features are the most widely used visual features in image retrieval because they are easier to extract. Typical characterization of color composition is done by color histograms. A color indexing method which identifies the object using color histogram indexing was proposed by Swain and Ballard [13] in 1991. Color histograms represent the distribution of colors in images where each histogram bin represents a color in a suitable color space (RGB etc.)[14]. A distance between query image histogram and a data image histogram can be used to define similarity match between the two distributions. To overcome problem with histogram, in 1995 Mehtre et. al.[15] proposed two new color matching methods: “Distance Method” and “Reference Color Table Method”, for image retrieval. They used a coarse comparison of the color histograms of the query and model images in the Distance method they proposed.
Most color histograms are very sparse and thus sensitive to noise. Cumulated color histogram was proposed by Stricker and Orengo [16] in 1995. Their results are better than the color histogram approach and they have also shown that moment based color distribution features can be matched more robustly than color histograms as histograms do not capture spatial relationship of color regions and thus, they have limited discriminating power. The system presented in [17] integrates mostly the algorithms introduced in [13] into a database environment. Reasonable results can be achieved using the above mentioned algorithms, but it is clear that the false positives which are retrieved is due to the lack of spatial information in the index. The simplest way to store spatial information in the index is to divide the image into sub-images and then extract the color features for each sub-image. Observing the fact that the color histograms lack information about how color is spatially distributed, in 1997 Rui and Huang [18] introduced a new color feature for image retrieval called color correlogram. This feature characterizedhow the spatial correlation of pairs of color changes with distance in an image. As the size of color correlogram is quite large, the color autocorrelogram is often used instead. These techniques perform better than traditional color histograms when used for content-based image retrieval. However, they require very expensive computation. Color moments have been successfully used in content based image retrieval systems. It has been shown [16] that characterizing one dimensional color distributions with the first three moments is more robust and runs faster than the histogram based methods.
Texture is an important characteristic that specifies the coarseness, smoothness, uniformity etc. of objects in an image. A variety of techniques have been developed for measuring texture similarity. Most techniques rely on comparing values of what are known as second-order statistics calculated from query and stored images [19]. These methods calculate measures of image texture such as the degree of contrast, coarseness, directionality and regularity [20 and 21]; or periodicity, directionality and randomness [22]. Alternative methods of texture analysis for image retrieval include the use of Gabor filters [4] and fractals [23].
Gabor filter (or Gabor wavelet) is widely adopted to extract
texture features from the images for image retrieval [ 4,24, 25, 26, 27, 28], and has been shown to be very efficient. Manjunath and Ma [4] have shown that image retrieval using Gabor features outperforms that using Pyramid-structured wavelet transform (PWT) features, tree-structured wavelet transform(TWT) features and multiresolution simultaneous autoregressive model (MR-SAR) features. Hence, in our proposed method, Gabor filter is used for extraction of texture features.
Shih and Chen [29] proposed a color retrieval method based on the primitives of color moments. After dividing an image into several blocks, the color moments of all blocks are extracted and clustered into several classes based on a fast non-iterative clustering algorithm. The mean vector of each class is considered as a primitive of the image and all primitives are used as feature vectors. Two test databases from Corel were used and compared the performances of the proposed method with other existing ones. The experimental results showed that the proposed method is usually better than others.
Choras et al. [30] proposed an integrated color, texture and shape feature extraction method in which Gabor filtration is used for determining the number of regions of interest (ROIs). They calculated texture and color features from the ROIs based on threshold Gabor features and histograms, color moments in YUV space, and shape features based on Zernike moments. The features presented proved to be efficient in determining similarity between images.
Xue and Wanjun [31] proposed a method in which the feature extraction methods of color histograms and color moments are integrated to extract the color feature. They reported that the recall and precision had been improved and the index sorting was better.
A method based on color and texture features is proposed in [32]. As color feature, they use color moments of the Hue, Saturation and Value (HSV) of the image and Gabor descriptors are adopted as texture features. They assigned weights to each feature and calculated the similarity with combined features of color and texture using normalized Euclidean distance. They reported that the proposed method has higher retrieval accuracy than the conventional method using color and texture features. The feature dimension is also lower than the conventional methods.
It normally requires complicated segmentation of the object from the background when users specify the query “content” or “objects” of their interest and only wish to retrieve images containing relevant objects, while ignoring irrelevant image areas ( such as the background ). Kumar et al. [33] proposed a model in which the user can select “object of user’s interest” of different shapes, non homogenous texture containing different colors, regardless of many objects present in the same image using varied tools like polygonal, rectangle, circle selector tools. A two state procedure is used to query the image from the image database. First, they integrate global color and texture feature vectors to narrow down the search space and in the next state they process using local features. As color and texture features, they used color moments and sub-band statistics of wavelet decomposition. They reported that objects with non uniform color and non homogenous regions can be found effectively.
segments and the color moments extracted from the segments are clustered into four classes. They consider the mean moments of each class as a primitive of the image. All primitives are used as features and each class mean is combined into a single class mean. The distance between query image mean with the corresponding database images are calculated by using Sum-of-Absolute-Differences (SAD). They reported that the proposed method based on color moments shows better performance than the local histogram method.
A multi feature model for the Content Based Image Retrieval System is proposed in [35] by combining the Color Histogram, color Moment, texture, and edge Histogram descriptor features. Users were given options to select the appropriate feature extraction method for best results. They report the results are quite good for most of the query images and it is possible to further improve by fine tuning the threshold and adding relevance feedback.
Maheshwari et al. [36] have proposed a method in which Color moment and Gabor filter are used to extract features for image dataset. K-means and hierarchical clustering algorithm is applied to group the image dataset into various clusters. Two methods of content based image retrieval using color and texture features have been implemented in [37]. In both the methods, feature extraction method is done using color moment while feature extraction of texture is done using wavelet texture features and Gabor texture features. Top images are retrieved using Euclidean distance and Chi-square distance and they have made comparative analysis.
The main contributions of the paper are as follows. A color and texture based approach for content based-image retrieval
is proposed in which color histograms, color moments and Gabor textures are integrated and to improve the
discriminating power of plain color indexing techniques and to minimize the disadvantages of global color indexing techniques, spatial information is encoded in the color index by dividing each image in the database into three equal non-overlapping horizontal regions as shown in Fig 2.(e). Experimentally it is found that out of the various image divisions, the retrieval based on color moment by dividing the image as shown in Fig. 2(e) gives the best retrieval performance. Each region is represented by a vector which consists of a total of 9 values i.e., average hue, variance of hue and skewness of hue, average saturation, variance of saturation and skewness of saturation, average of value, variance of value and skewness of value from each of the region. Thus each image in the database is stored as a vector of 27 floating point values (or 3 regions, each region being represented by a vector of 9 floating point values). The experimental results show that the moments extracted from
the image divided horizontally into 3 non-overlapping equal regions gives the best performance. Hence, in our
proposed method color moments are extracted from these 3 horizontal regions.
(a) (b) (c)
[image:3.595.318.538.76.231.2]
(d) (e)
Fig 2: Different image regions: (a) Whole image (b) Image divided vertically into two equal regions (c) Image divided vertically into three equal regions (d) Image divided horizontally into two equal regions (e) Image divided horizontally into three equal regions
The remainder of the paper is organized as follows: in section 2, color model and color quantization are presented. In section 3, color feature extraction and similarity measurements are given. In section 4, texture feature extraction and similarity measurements are given. Section 5 outlines the proposed method. Section 6 describes the experiments and results. Finally, conclusions are presented in section 7.
2.
COLOR MODEL AND COLOR
QUANTIZATION
2.1
Color Model
Color is one of the most important features that make possible the recognition of images by humans and color feature is one of the most commonly used visual features in image retrieval. Color is a property that depends on the reflection of light to the eye and the processing of that information in the brain. It is an important dimension of human visual perception that allows discrimination and recognition of visual information [38]. Color features are relatively easy to extract and match, and have been found to be effective for indexing and searching of color images in image databases.
One of the main aspects of color feature extraction is the choice of a color space. A color space is a multidimensional space in which the different dimensions represent the different components of color. An example of a color space is RGB, which assigns to each pixel a three element vector giving the color intensities of the three primary colors, red, green and blue. The space spanned by the R, G, and B values completely describes visible colors, which are represented as vectors in the 3D RGB color space. As a result, the RGB color space provides a useful starting point for representing color features of images. However, the RGB color space is not perceptually uniform. More specifically, equal distances in different intensity ranges and along different dimensions of the 3D RGB color space do not correspond to equal perception of color dissimilarity.
1 2
1 2 3
1
2
2
1
2
3
The HSV color space is widely used in the field of color vision. The chromatic components hue, saturation and value correspond closely with the categories of human color perception. The HSV values of a pixel can be transformed from its RGB representation according to the following formula:
-1
2
1
[ R-G +(R-B)] 2
H = cos
(R-G) +(R-B)(G-B)
3[min(R,G,B)] S=1 -
R+G+B R+G+B V=
3
2.2
Color Quantization
Color quantization is a process that reduces the number of distinct colors used in an image, usually with the intention that the new image should be as visually similar as possible to the original image. For a true color image, the number of the kind of colors are up to 224 = 16777216, so the direct extraction of color feature from true color will lead to a large computation. In order to reduce the computation, without a significant reduction in image quality, some representative color is extracted to represent the image, thereby reducing the storage space and enhancing the processing speed [39]. In the proposed method, the HSV (16, 4, 4) quantization scheme is adopted and a 256-dimensional feature vector represents the color histogram of an image.
3.
COLOR FEATURE EXTRACTION
3.1
Color Histogram
A color histogram represents the distribution of colors in an image, where each histogram bin corresponds to a color in the quantized color space. Color histograms are a set of bins where each bin represents a particular color of the color space being used. The number of bins depends on the number of colors there in the image. A color histogram for a given image is defined as a vector:
{ [0], [1], [2], [3]... [ ],... [ ]} (1)
H
H
H
H
H
H i
H n
Where i represents the color bin in the color histogram and H[i] represents the number of pixels of color i in the image, and n is the total number of bins used in the color histogram. Typically, each pixel in an image will be assigned to a bin of a color histogram of that image, and so for the color histogram of an image, the value of each bin is the number of pixels that has the same corresponding color. In order to compare images of different sizes, color histograms should be normalized. The normalized color histogram
H
'
is defined as:' { '[0],
'[1],
'[2],
'[3]... '[ ],... '[ ]} (2)
H
H
H
H
H
H i
H n
Where
H i
'[ ]
H i
[ ]
p
, p is the total number of pixels ofimage.
However, color histogram has its own drawbacks. If two images have exactly the same color proportion but the colors are scattered differently, then we can’t retrieve correct images.
3.2
Histogram Similarity Measure
We extract the color histogram of the image and we will get a 256-dimensional color feature vector:
HQ=(h0,h1,h2………..h255)
Histogram intersection method is used to measure the distance ‘S1’ between the query image Q and the image P in the image
database.
255 1
0
1
min(
Q[ ],
P[ ]) (3)
iS
H i H i
3.3 Color Moment
The goal of color indexing is to retrieve all the images whose color compositions are similar to the color composition of the query image. Histograms are useful because they are relatively insensitive to position and orientation changes and they are sufficiently accurate [13]. However, they do not capture spatial relationship of color regions and thus, they have limited discriminating power. These global distributions have limited discriminating ability because they are unable to capture local color information. Color correlogram and color coherence vector can combine the spatial correlation of color regions as well as the global distribution of local spatial correlation of colors. These techniques perform better than traditional color histograms when used for content-based image retrieval. But they require very expensive computation. Color moments have been successfully used in content based image retrieval systems. It has been shown [16] that characterizing one dimensional color distributions with the first three moments is more robust and runs faster than the histogram based methods.
In this paper, color moments are used and in order to improve the discriminating power of color indexing techniques, the image is divided horizontally into three equal non-overlapping regions and from each of the three regions, we extract from each color channel the first three moments of the color distribution and store the 27 floating point numbers in the index of the image. If the color distribution of an image is interpreted as a probability distribution, then the color distribution can be characterized by its moments [16]. If the value of the ith color channel at the jth image pixel is Iij and the number of pixels is N, then the index entries related to this color channel and the region ‘r’ are:
N
r,i ij
j=1
1
E =
I (4)
N
1 2 2
, ,
1 1
( ) (5)
N
r i ij r i j
I E
N
1
N 3
3 r, i ij r, i
j=1
1
s = (I -E ) (6)
N
The entries Er,i (1 <= i <=3) are the average color of the
region r. The entries σr,i and sr,i are the variance and the
skewness of each color channel in this region ‘r’. The index entry for one image consists of
Index size = number of regions x number of color Channels x 3 floating point numbers.
In this paper, the image is divided horizontally into three equal non overlapping regions and 27 floating point numbers are stored per image.
So, the feature vector
f
of length 27 is given by:
E , , s , E ,
1,1 1,1 1,1 1,2 1,2, s ,E ,
1,2 1,3 1,3, s . . . E , , s
1,3 r,i r,i r i,
f
(1 <= r,i <=3), r represents the region and i represents the color channel.
3.4
Color Moment Similarity Measure
Let H and I be two color images with c color channels. If the index entries of these images for their regions are Er1,i resp.
Fr2,i, σr1,i resp. ρr2,i and sr1,i resp. tr2,i , then the similarity of the
region r1 of H and the region r2 of I is defined as
c
r1,i r2,i r1,i r2,i r1,i r2,i r1,r2
i=1 r1,i r2,i r1,i r2,i r1,i r2,i
E
F
σ
ρ
s - t
d
(H,I)=
+
(7)
E
+ F
σ + ρ
s + t
where
(1 i
3)
and c is the number of channels. To compute the total similarity of the two images H and I, we define the total similarity asr=3 r1,r2 r1=r2=1
d (H,I)=
d (H, I) (8)
Where r is the total number of regions.
If
f
cQ
E , , s , E , , s ,E , , s . . . E , , s
1,1
1,1 1,1 1,2
1,2 1,2 1,3
1,3 1,3 r,i
r,i r i,
denote color feature vector of query image and
E ,
1,1 1,1, s , E ,
1,1 1,2 1,2, s ,E ,
1,2 1,3 1,3, s . . . E , , s
1,3 r,i r,i ,
T
c r i
f
denote color feature vector of database query image, then distance between them is given by:
1 1
(9)
Q T
d
c c
Q T
i c c
f f
d
f f
where d is the dimension of the vector.
The Canberra distance measure is used for similarity
comparison. It allows us the feature set to be in un-normalized form. The Canberra distance measure is given by :
1
( , )
(10)
di i
i i i
x
y
CanbDist x y
x
y
Where x and y are the feature vectors of query and database image respectively, of dimension d.
The following algorithm is proposed to determine the similarity between query image and an image in the image database using color moment:
Step 1. Input query image I
Step 2. Convert RGB color space image into HSV color space.
Step 3. Partition the image into three equal non-overlapping horizontal regions
Step 4. Calculate the moments
F , ρ
r2,i r2,iand t
r2,i for each color channel of each region to get 27 numbers from three regions of the query image I.Step 5. Apply Step 2 to Step 4 to the image Hj in the database, to calculate the moments
r1,i r1,i r1,i
E
, σ
and s
from the regions of Hj to get 27 numbers.Step 6. Calculate the Distance dj(Hj,I) between the two images using (8) and store in an array d.
r
j j r1,r2 j
r1=r2=1
d (H ,I)=
d
(H , I)
Where r is the number of regions.
Step 7. Increment j, repeat step 5 and 6 for all the images in the database.
Step 8. The array d is sorted in ascending order. The image corresponding to the first element of d is the most similar image compared with the query image I. The first 10 top most similar images are then displayed .
The color moment is beneficial due to the fact that moments are invariant of geometric transformation and as we are taking average combined moment of each and every pixel of an image, this feature is more precise than color histogram. Here, the problem faced in histogram is resolved but the approach of color moment is restricted to applications of images where the color is predefined like the color of sky is blue.
4.
TEXTURE REPRESENTATION
For a given image I(x,y) with size PXQ, its discrete Gabor wavelet transform is given by a convolution:
*
mn mn
s t
G (x,y) =
I(x-s,y-t) ψ (s,t) (11)
Where, s and t are the filter mask size variables, and
ψ
*mn is a complex conjugate ofψ
mnwhich is a class of self-similar functions generated from dilation and rotation of the following mother wavelet:2 2
mn 2 2
x y x y
1
1 x
y
ψ (x,y)=
exp[- (
+
)].exp(j2πWx) (12)
2πσ σ
2 σ
σ
Where W is called the modulation frequency. The self-similar Gabor wavelets are obtained through the generating function:
mn
ψ (x,y)= a ψ( , ) (13)
mx y
Where m and n specify the scale and orientation of the wavelet respectively, with m=0,1,……….M-1, n= 0,1,……….N-1, and
( cosθ+ysinθ)
(
sin θ+ycosθ)
mm
x
a
x
y
a
x
(14) Where a>1 and
θ
=nπ
/N.The variables in the above equation are defined as follows:
1 1
(
/
)
M,
h l
a
U
U
, m m n l
W
a U
(15)
, ,
(
1) 2
2
,
2
(
1)
x m n ml
a
In
a
a
U
, , 2
2
, ,
1
, (16)
1
2 tan(
)
(
)
2
2
2
2
y m nh
x m n
U
N
In
In the implementation, we used the following constants as commonly used in the literature:
U l =0.05, U h =0.4, s and t range from 0 to 60, i.e., filter mask size is 60x60.
4.1. Texture Extraction
After applying Gabor filters on the image with different orientation at different scale, we obtain an array of magnitudes:
E(m,n)=
mn( , ) , (17)
x yG
x y
m=0,1,……,M-1; n=0,1,………N-1.
These magnitudes represent the energy content at different scale and orientation of the image. The main purpose of texture-based retrieval is to find images or regions with similar texture. It is assumed that we are interested in images or regions that have homogenous texture, therefore the following mean
μ
mnand standard deviationσ
mnof the magnitude of the transformed coefficients are used to represent the homogenous texture feature of the region:( , )
(18)
mnE m n
PXQ
2
(
( , )
)
σ
(19)
mn mn
x y mn
G
x y
PXQ
A feature vector fg (texture representation) is created using
mn
μ
andσ
mnas the feature components [3]. Four scales and 6 orientations are used in common implementation and the feature vector of length 48 is given by :fg =
{
00,
00,
01,
01,...,
35,
35}
4.2. Texture Similarity Measure
The texture similarity measurement of a query image Q and a target image T in the database is defined by :
( , )
mn( , ) (20)
m nd Q T
d
Q T
Q T Q T
mn mn mn mn
mn Q T Q T
mn mn mn mn
where d
00 00 01 01 35 35
gQ
{
,
,
,
,...,
,
}
If f
denotetexture feature vector of query image and
00 00 01 01 35 35
{
,
,
,
,...,
,
}
Tg
f
denote texture feature vector of database image, then distance between them is given by:
2 1
(21)
Q T d g g Q Ti g g
f
f
d
f
f
The Canberra distance measure is used for similarity expression.
5.
PROPOSED METHOD
5.1
Color Histogram
By using the HSV (16, 4, 4) quantization scheme, a 256-dimensional feature vector is used to represent the color histogram of an image. Histogram intersection method is used to measure the distance ‘S1’ between the query image Q and
the image P in the image database.
5.2
Color Moment
The global distributions have limited discriminating ability because they are unable to capture local color information. In this paper, the color moments are used and to improve the discriminating power of color indexing, a minimal amount of spatial information is encoded in the index by dividing the image horizontally into three equal non-overlapping regions and extracting moments from these regions. Then color feature vector
f
of length 27 is calculated for query image and images in the image database and distance between them is computed using Canberra distance measure. The results of a query are displayed in decreasing similarity order.5.3
5.3 Texture Feature
In the case of low level texture feature, we apply Gabor filters on the image with 4 scales and 6 orientations and we obtain an array of magnitudes. The mean
μ
mnand standard deviationmn
σ
of the magnitudes are used to create a texture feature vectorf
gof length 48. Canberra distance measure is used for computing the distance and the results of a query are displayed in decreasing similarity order.5.4
Image Database
For evaluation of the proposed method, it has been implemented using Matlab 6.5 and Corel Image database with 1000 natural images in JPEG format of size 384 x 256 or 256 x 384 were used for testing the proposed CBIR system. In the experiment, 100 images were selected randomly; containing 10 images in each category and the images are resized to 256 x 384. Within this database, it is known whether any two images are of the same category. In particular, a retrieved image is considered a match if and only if it is in the same category as the query.
5.5
Combining the Features
The retrieval result using only single feature may be inefficient. It may either retrieve images not similar to query image or may fail to retrieve images similar to query image. Hence, to produce efficient results, color histogram, color moment and texture features are combined.
The similarity between the query image Q and the image in the database P is calculated as follows:
d1 = w1*S1 + w2*S2 (22)
Here, w1 is the weight of the color histogram features, w2 is the weight of the color moment features and S1 and S2 are the
distances calculated using color histogram and color moment and w1+w2=1, and here we take w1=w2=0.5.
The above result of color feature is again combined with the texture features. The total distance between the query image and the image in the database is calculated as follows: d= w3*d1+w4*d2 (23) Where, w3 is the weight of the color features ( color histogram + color moment), w4 is the weight of the texture features and d1 and d2 are the distances calculated using color histogram and color moment using (22) and texture features using (21). Experiments show that better retrieval performances are achieved when we set w3=0.80 and w4=0.20. The weight factor of color feature distance is higher than the weight factor of texture feature distance because our database consists of mostly natural images.
The above distance ‘d’ is calculated between the query image and all the images in the database and it is sorted in ascending order. The image corresponding to the first element of d is the most similar image compared with the query image. The first 10 top most similar images are then displayed.
6.
EXPERIMENTS AND RESULTS
The performance of a retrieval system can be measured in terms of its precision and recall. Precision measures the ability of the system to retrieve only models that are relevant, while Recall measures the ability of the system to retrieve all models that are relevant. They are defined as
Number of relevant images retrieved
A
Precision =
=
(24)
Total number of images retrieved
A+B
Number of relevant images retrieved
A
Recall =
=
(25)
Total number of relevant images
A+ C
Where A represents the number relevant images that are retrieved, B represents the number of irrelevant items and C the number of relevant items those were not retrieved. The experiment was carried out with the number of retrieved images set as 10 to compute the average precision P of each query image. In order to assess the discriminating power of the techniques proposed in this paper, experiments were carried out based on Color histogram (CH), color moment -based on whole image (CMW), color moment - image divided into 3 equal non overlapping horizontal regions (CMR), Gabor texture(GT), Color histogram + color moment - based on whole image + Gabor texture (CH+CMW+GT), and Color histogram + color moment - image divided into 3 equal non overlapping horizontal regions + Gabor texture (CH+CMR+GT).
It is also seen that the value of the average precisions (%) based on single features i.e. only Color histogram features or Color moments or Gabor textures are less than the average precisions (%) of combined features of Color histogram, color moments and Gabor textures as shown in Table 2. and Table 3. This also shows that there is increase in retrieval efficiency when Color histogram, color moment and Gabor texture are combined for CBIR.
Table 1. Precision of retrieval for top 10 images. Color histogram(CH); Color moment - whole image (CMW);Color moment - image divided into 3 equal non overlapping horizontal regions(CMR); Gabor texture(GT); Color histogram + Color moment - whole image + Gabor texture(CH+CMW+GT); Color histogram + Color moment - image divided into 3 equal non overlapping horizontal regions + GT (CH+CMR+GT)
Class
Average Precision
CH CMW CMR GT CH +CMW
+GT
CH +
CMR +GT
Africa 0.68 0.75 0.75 0.37 0.68 0.75 Beach 0.29 0.46 0.38 0.27 0.38 0.34 Building 0.29 0.25 0.35 0.33 0.36 0.35 Buses 0.73 0.67 0.78 0.35 0.51 0.66 Dinosaur 0.99 0.74 0.83 0.99 0.99 0.98 Elephant 0.55 0.60 0.45 0.39 0.53 0.45 Flowers 0.52 0.42 0.61 0.75 0.74 0.72 Horses 0.49 0.55 0.70 0.27 0.43 0.64
Food 0.67 0.67 0.62 0.44 0.67 0.72 Mountain 0.28 0.43 0.43 0.20 0.27 0.41
Average Precision (%)
54.9 55.4 59.0 43.6 55.6 60.2
Table 2. Average retrieval using features Color histogram (CH); Color moment - whole image (CMW); Gabor texture (GT); Color histogram + Color moment- whole image +Gabor texture (CH+CMW+GT)
CH CMW GT CH+CMW+GT
Average Precision (%)
54.9 55.4 43.6 55.6
Table 3. Color histogram (CH); Color moment- image divided into 3 equal non overlapping horizontal regions (CMR); Gabor texture (GT);Color histogram + Color moment - image divided into 3 equal non overlapping horizontal regions +Gabor texture (CH+CMR+GT)
CH CMR GT CH+CMR+GT
Average Precision (%)
54.9 59.0 43.6 60.2
(a)
(b)
(c)
[image:8.595.310.549.138.585.2] [image:8.595.47.299.280.575.2](c)
(e)
(f)
[image:9.595.76.240.72.441.2](g)
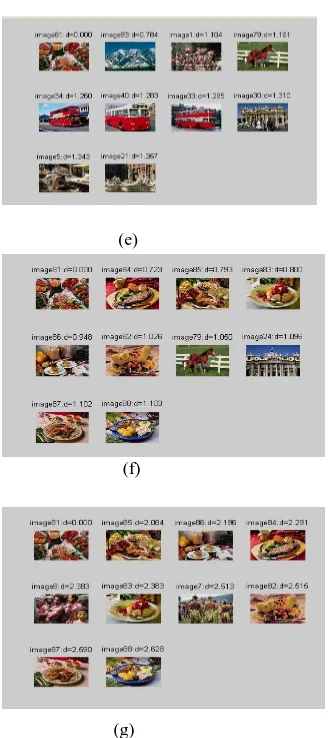
Fig 3: Different image retrieval results for the same query image: (a) query image (b) result based on Color histogram(c) result based on Color moment (whole image) (d) result based on Color moment (image divided into 3 equal non overlapping horizontal regions) (e) result based on Gabor texture (f) result based on Color histogram + Color moment (whole image) + Gabor texture (f) result based on Color histogram + Color moment (image divided into 3 equal non overlapping horizontal regions) + Gabor texture
7.
CONCLUSION
In this paper, an efficient image retrieval method is proposed in which color histogram, color moment and Gabor texture feature vectors are combined. For color histogram, the HSV (16, 4, 4) quantization scheme has been adopted and an image is represented by a vector of 256-dimension. For color moment, to improve the discriminating power of color indexing techniques, a minimal amount of spatial information is encoded in the index by extracting features from the regions of the image divided horizontally into three equal non overlapping regions. In this approach, from each region in the image, the first three moments of the color distribution are extracted from each color channel and store the 27 floating point numbers ( or 3 regions, each region being represented by a vector of 9 floating point numbers) of the image in the
index. As its texture feature, Gabor texture descriptors are adopted. The similarity with combined features of color histogram, color moment and Gabor texture is calculated using Histogram intersection and Canberra distance as similarity measures. The experimental results demonstrate that the proposed method has higher retrieval accuracy in terms of precision than other conventional methods combining color histogram, color moment and Gabor texture features based on global features approach. The experiment shows that there is considerable increase in retrieval efficiency when both color histogram, color moment and Gabor texture features are integrated.
8.
REFERENCES
[1] Xinjung, Z. 2006. "Research of Image retrieval based on color features”, Liaoning technical University, 9(2), pp. 42-50.
[2] Datta, R., Joshi, D., Li, J., Wang, J.Z. 2008. "Image retrieval: ideas, influences, and trends of the new age ", ACM Computing Surveys 40(2), pp 1-60.
[3] Gudivada, V.N. and Raghavan, V.V. 1995. "Content based image retrieval systems", IEEE Computer, Vol 28, No.9, pp.18-22.
[4] Manjunath, B.S. and Ma, W.Y. 1996. "Texture Features for browsing and retrieval of image data", IEEE Transactions on Pattern Analysis and Machine Intelligence, Vol.18, No.8, pp. 837-842.
[5] Rui, Y., Huang, T.S., Ortega, M. and Mehrotra, S. 1998. " Relevance feedback : a power tool for interactive content based image retrieval ",IEEE Circuits and Systems for Video Technology , Vol. 8, No. 5, pp. 644-655.
[6] Swets, D. and Weng, J. 1999. “Hierarchical discriminant analysis for image retrieval”, IEEE "PAMI, Vol. 21, No. 5, pp. 386-400.
[7] Zhang, H. and Zhong, D. 1995. “A scheme for visual feature based image retrieval”, Proc. SPIE storage and retrieval for image and video databases.
[8] Yu-guang, Ye. 2007. “Research of image Retrieval based on fusing with multi-character”, Hua Qiao University, pp. 14-16.
[9] Smeulders, A.M., Worring, M., Santini, S., Gupta, A. and Jain, R. . 2000. "Content-based image retrieval at the end of the early years”, IEEE Trans Pattern Anal Machine Intell 22: pp.1349-1380.
[10]Choras, R. 2003. “Content-based image retrieval using color, texture, and shape information”, In. Sanfeliu, Riuz-Shulcloper J. (eds) Progress in pattern recognition, speech and image analysis. Springer, Heidelberg. [11]Corners, R. and Harlow, C. 1980. ”A theoretical
comparison of texture algorithms”, IEEE Trans Pattern Anal Machine Intell 2: pp.204-222.
[12]Howarth, P. and Ruger, S. “Evaluation of texture features for content based image retrieval”, In: Enser P. et al. (eds) Image and video retrieval. Springer LNCS 3115:pp.326-334.
[14]Gonzalez, R.C. and Woods, R.C. 1992. Digital Image Processing, Addison-Weslel, Reading, MA.
[15]Mehtre, B.M., Kankanhalli, M.S., Narasimhalu, A.D. and Man, G.Ch. 1995. “Color matching for image retrieval”, PRL, 16, pp. 325-331.
[16]Stricker, M. and Orengo, M. 1995. “ Similarity of color images”, In SPIE Conference on Storage and Retrieval for Image and Video Databases , volume 2420, pp. 381-392, San Jose, USA.
[17]Ogle, V.E. and Stonebraker, M. 1995. “Chabot: Retrieval from a relational database of images”, Computer, pp. 40-48.
[18]Rui Y. and Huang, Th.S. 1999. “Image Retrieval: Current Techniques, Promising Directions and open Issues”, JVCIR, vol. 10, pp. 39-62.
[19]Eakins, J.P. and Graham, M.E. “ Content-based Image Retrieval: A report to the JISC Technology Applications Program”
http://www.unn.ac.uk/iidr/research/cbir/report.html [20]Tamura, H., Mori, S., Yamawaki, T. 1976. “Texture
features corresponding to visual perception”, IEEE Trans. On Systems, Man and Cybernetics. 6(4): 460-473 [21]Niblack, W. et. al. 1993. “The QBIC Project: Querying
Images by Content Using Color, Texture and Shape”. Proc. Of the Conference Storage and Retrieval for Image and Video Databases, SPIE vol. 1908, pp. 173-187. [22]Liu, F. and Picard, R.W. 1996. “Periodicity,
directionality and randomness: Wold features for image modelling and retrieval”, IEEE Transactions on Pattern Analysis and Machine Intelligence 18(7): 722-733. [23]Kaplan, L.M. et al. 1998. “Fast texture database retrieval
using extended fractal features” in Storage and Retrieval for Image and Video Databases VI(I.K. Sethi and R.C. Jain eds), Proc. SPIE 3312, 162-173.
[24]Smith, J.R. 1997. “Integrated Spatial and Feature Image System: Retrieval, Analysis and Compression”, Ph.D. thesis, Columbia University.
[25]Deng, Y. 1999. “A Region Representation for Image and Video Retrieval”, Ph.D. thesis, University of California, Santa Barbara.
[26]Ma, W.Y. 1997. “Netra: A Toolbox for Navigation Large Image Databases”, Ph.D. thesis, University of California, Santa Barbara.
[27]Jeanin (ed.), S. 2000 “ISO/IEC JTCI/SC29/WG11/N3321: MPEG-7 Visual Part eXperimentation Model Version 5.0”, Nordwijkerhout. [28]Dimai, A. 1999. “Rotation Invariant Texture Description
using General Moment Invariants and Gabor Filters”, In Proc. Of the 11th Scandinavian Conf. on Image Analysis. Vol I, pp. 391-398.
[29]Shih, J.L. and Chen, L.H. 2002. “Color image retrieval based on primitives of color moments”, IEEE Proceedings online no. 20020614.
[30]Choras, R.S., Andrysiak, T. and Choras, M. 2007. “Integrated color, texture and shape information for content-based image retrieval”, Pattern Anal Applic. 10: 333-343.
[31]Xue, B. and Wanjun, L. 2009. “Research of Image Retrieval Based on Color”, IEEE International Forum on Computer Science-Technology and Applications. [32]Huang, Z.C., Chan, P.P.K., Ng, W.W.Y., Yeung, D.S.
2010. “Content-based image retrieval using color moment and Gabor texture feature”, in Poceedings of the IEEE Ninth International Conference on Machine Learning and Cybernetics, Qingdao, pp. 719-724. [33]Kumar, D.K., Sree, E.V., Suneera, K. , Kumar, P.V.Ch.
2011. “Cotent Based Image Retrieval – Extraction by objects of user interest”, International Journal of Computer Science and Engineering (IJCSE), Vol.3, No.3., pp. 1068-1074.
[34]Saikrishna, T.V., Yesubabu, A. , Anandrao, A. and Rani, T.S. 2012. “A Novel Image Retrieval Method using Segmentation and Color Moments”, ACIJ, Advanced Computing:An International Journal, Vol.3,No.1, pp.75-80.
[35]Dubey, R.S., Choubey, R., Bhattacharga, J. 2010. “Multi Feature Content Based Image Retrieval”, (IJCSE) International Journal on Computer Science and Engineering, vol. 02, No. 06, pp. 2145-2149.
[36]Maheshwari, M. , Silakari, S. and Motwani, M. 2009. “Image Clustering using Color and Texture”, Computational Intelligence, Communication Systems and Networks, pp. 403-408.
[37]Buch, P.P., Vaghasia, M.V. and Machchchar, S.M. 2011. “Comparative analysis of content based image retrieval using both color and texture”, Engineering(NUiCONE), Nirma University Internatonal Conference, pp. 1-4. [38]Smith, J. 2002. ” Color for Image Retrieval”, Image
Databases: Search and Retrieval of Digital Imagery, John Wiley & Sons, New York, pp. 285-311.
[39]Hafner, J. and Sawhney, H.S. 1995. “Efficient color histogram indexing for quadratic form distance functions”, IEEE Transactions on Pattern Analysis and Machine Intelligence, 17(7), pp. 729-736.
[40]J. Zhang, G. Li, S. He, “Texture-Based Image Retrieval by Edge Detection Matching GLCM”, The 10th IEEE International Conference on High Performance Computing and Communications.
[41]Clause , D.A., Jerni, M. Ed., Gan, 2000. “Designing Gabor filters for optional texture separability”, Pattern Rcognition, 33, pp. 1835-1849.