Munich Personal RePEc Archive
Measuring the UK Economy
Freeman, Alan
The University of Greenwich
1999
Online at
https://mpra.ub.uni-muenchen.de/6894/
MEASURING THE UK ECONOMY
Alan Freeman, the University of Greenwich1
afreeman@iwgvt.org
Prepublication version of ‘Measuring the UK Economy’, in Dorling, D. and Simpson, S. (1999) Statistics
and Society, p361-369. London Arnold. ISBN 0 340 71994 X.
This article demonstrates that the System of National Accounts (SNA) implicitly specify a conception of
value. They divide all productive activities into those which create value (paid labour and capital, the
factors of production) and those which merely transmit pre-existing value such as the state, or which are
not treated as creative of value at all, such as unpaid labour. The measures of output derived from the
System of National Accounts are consequently not factually neutral or objective but arise from a specific
conception of value. As Anwar Shaikh and Ertugrul Tonak have shown, a different concept of value –
such as the idea that labour only is productive of value leads to a different set of measures of output arise,
both for the economy as a whole and for each sector.
The article shows how to transform the national accounts of the UK from their present form to one in
which only labour is considered productive of value.
Keywords: value, price, temporalism, TSSI, Marx, unproductive labour, national accounts, indicators
1 I would like to acknowledge the helpful comments of contributors to the OPE-L mailings list. Errors are of course my own
MEASURING THE UK ECONOMY
Alan Freeman, the University of Greenwich
THE EMPEROR’S TAILOR
Schumpeter (1994:7) offers an innocuous case for treating economics as a science:
A science is any field of knowledge in which there are people, so-called research workers or
scientists or scholars, who engage in the task of improving upon the existing stock of facts and
methods and who, in the process of doing so, acquire a command of both that differentiates them
from the ‘layman’ and eventually also from the mere ‘practitioner’.
Since economics uses techniques that are not in use among the general public, and since there
are economists to cultivate them, economics is obviously a science within our meaning of the
term
This remains the image which the economics profession presents to the public. However, it is not without
problems. It is not self-evident that the use of ‘techniques not in use among the general public’ by
‘so-called research workers’ qualifies something as a science. Any specialism has its own techniques, often
arcane – for example astrology. What distinguishes science from the merely esoteric is a means of
judging its results.
Of course economists check their own results, often rigorously. However, so did the Spanish Inquisition.
The common factor is that both qualify only their own specialists to administer the checks. In a nutshell,
economics judges its own results, and the idea that the uninitiated might judge for themselves is simply
not entertained, as testified by the breathtaking presumption of an Economist leader entitled, of all things,
the Failure of Economics (23 August 1997:11):
Crucial ideas about the role of prices and markets, the basic principles of microeconomics, are
uncontroversial among economists. These are the first ideas that politicians and the public need
to grasp if they are to think intelligently about public policy.
Perhaps the first idea the economists need to grasp, if they are to think intelligently about anything at all,
is that what they take to be uncontroversial might also be wrong.
The emperor’s tailor cannot judge the emperor’s suits. The medical profession is highly specialised, but
offers an independent test of its methods, namely whether they cure patients. Economics has never been
known to cure anything. In practice, when challenged, it seems to offer only three means of
demonstration: proof by expertise, proof by authority, and under duress, proof by obscurity.
This chapter seeks to restore the scientific principles of independent verification and transparency. Since
both computers and statistics are now easy to obtain, an average person can, with some hard work,
reconstruct the ‘plain facts’ of the economy, and so study – and judge – policies and their outcomes.
The problem seems daunting only because every economic seems to lurk in a maze of theory. This is
what I hope to redress: I hope to explain how the facts are constructed, and so clear the way to an
Measuring the UK economy
1999b (7a-radstats-4).doc 3 of 10 25/01/08 19:09
definitive authority, but to restore to the public the authority stolen from it, by providing it with the means
and the right to look at the data differently.
On the basis of the reconstruction suggested below – one among a number of different possible
presentations – a radically different insight into the structure of the UK economy emerges, as can be seen
from table 4 showing the distribution of national output and the allocation of property incomes in 1980
and 1994.
WHAT ARE NATIONAL INCOME STATISTICS ABOUT?
I deal exclusively with macroeconomic statistics from the National Income Accounts. These principal
measures of the economic state of the nation are published in the Blue Book2; its companion Sources and
Methods explains how these are calculated from raw data. The accounts adhere to an international
standard, the UN’s System of National Accounts.3
Economic statistics, like all others, are derived from raw data. The results are presented as absolute facts,
following in some self-evident way from the nature of the raw data. However the derivation expresses a
choice, as we can see by considering the most basic economic concept as it appears in the accounts:
output, or what the economy produces.
Example 1: domestic work is not treated as part of output. The accountants say it adds no value because it
isn’t paid a wage.
Example 2: however payment does not alone qualify something as a contribution to output. Pensioners are
not considered productive because they don't work. Their money is treated as a transfer from someone
else.
Example 3: but work isn't an essential qualification. Landlords, who arguably work no more than
pensioners, are considered to contribute to output by supplying a factor of production – a piece of land,
and their rent is said to measure the size of their contribution.
Example 4: nor is payment essential: two-thirds of all rent is not paid to anyone but is ‘imputed’4. If you
own your house, you are deemed to rent it from yourself: the bigger your house, the better off is the
nation.
These four choices, taken together, cannot be squared with any notion that the data itself informs us what
to do with it. Paid and unpaid labour are both included, as are both active and idle people. Nor are
practical problems the issue: for example, since what’s good enough for houses is good for housewives it
would be simplicity itself to impute the value of domestic labour – for example, as the charge made by a
typical firm selling the same services. This is not done because the accounts are based on a distinct,
2United Kingdom National Accounts, CSO. Unless otherwise stated, all references to series and tables relate to the 1995 version. 3 United Nations 1993
4
theoretical, classification external to the data, and this is what actually determines the accountants'
choices.
Is there any ‘correct’ choice of categories for the accounts? Personally, I think the choice of statistics
varies with purpose, so that while a full audit of our resources should include both nature and unpaid
labour, I would personally start with a study of our capitalists – who command these resources with
money – with the way they use this money to reproduce these resources. Since they can do so only by
hiring labour, the labour itself can reasonably be treated as their only universal productive resource.
However nothing is sacred about any version of the accounts. Economics bases a form of intellectual
terrorism, erecting a claim to unchallengeable 'hard science' status, on facts which it constructs out of the
very theory it sets out to test. Science tests theories against facts, but this calls for a level playing field: It
is illegitimate to appoint a player as referee. The public needs to confront the facts presented by each
theory with external evidence which the profession has not had the chance to tamper with. For this it
requires different versions of the facts, each corresponding to the theoretical perspective under scrutiny.
This is not pure relativism. Each theory results in a transformed version of the accounts but these
alternative transformations are not arbitrary. They are subordinate to over-arching accounting principles,
dictated by the logic of a money economy.
The most fundamental choice, as the examples suggest, is to determine what counts as output. This results
from a conceptual classification, either explicit or implicit, of all economic activities into those which add
value, and those which do not; into productive and unproductive activities or, in the language of
neoclassical theory, those which are factors of production, and those which are not. This is the decisive
accounting distinction which everyone must make, regardless of their theory.
A further subdivision is evident. Some activities, like domestic labour, are altogether absent from the
accounts. However there are unproductive activities like pensions, where money changes hands and must
be accounted for but which do not contribute to output. These are treated as transfers – they consume
income produced elsewhere. These choices are politically and ideologically sensitive, since a transfer
appears parasitical.
If output measures what people produce, what measures their consumption or income? Orthodox theory
preaches that treat income and value-added are identical. Thus rent is the just reward of the landlord,
profits of the property-owner, and wages of the worker,5 each in proportion to the value they add. The
5 The state occupies a contradictory position. Theory doesn't like calling it a factor of production: the record would then show it as
Measuring the UK economy
1999b (7a-radstats-4).doc 5 of 10 25/01/08 19:09
accounts, informed by this view, even designate their primary output table the 'factor income' accounts.6
A second 'expenditure' table7 records what these rewards are spent on – but not who spends it. The classes
of persons defined in the income accounts are amalgamated and treated alike as ‘consumers’. We can see
what wage-earners or property-owners add to output, but we can neither see their actual income, nor what
they do with it.
This conflicts with the treatment of tax, recorded as a deduction from income or transfer, introducing a
clear if sheepish distinction between the value which a factor adds, and its eventual or 'disposable'
income. The net tax calculation proposed by Shaikh and Tonak categorises all taxes to show from which
income they are deducted, and all benefits to the class that receives them, so exhibiting the transfers
which the state effects between different types of income.8
But the state is not the only agent that transfers incomes. In principle, as we have remarked, the very
concept of transfer depends on what is considered productive. If we deem any given revenue is not a
contribution to output, then we must treat it as a transfer: something which does not add to output but
moves it from one class of person to another.
Transfer or product? the strange case of interest payments
Sources and Methods (p88) explains a dilemma “which has always caused some difficulty in national
accounting statistics”: measuring what the banks do. Normally, a firm’s contribution to GDP is
measured by its ‘net output’ – the excess of its receipts from the sale of goods and services over
its operating expenditure on purchasing goods and services from other enterprises ... However
the application of this definition to financial companies and institutions produces a paradoxical
result.
Profits are normally defined as the excess of sales over costs. However, while bank costs are considerable
(marble, security, banquets, etc) their only sales are “bank charges and commissions received from
depositors.” Hence their output is small and their profits negative, because
banks derive much of their income by lending money at a higher rate of interest than they pay on
money deposited with them; and in the national accounts interest receipts and payments are
regarded as transfers and not as receipts and payments for a financial service.
In 1994 the banks recorded gross trading profits of –£10,839m but the non-bank (industrial and
commercial) sector recorded £102,028m. Total value-added by both sectors is £91,189m, being the
£102,028mless £10,839m transferred to the banks.9
Unfortunately, this partial outbreak of common-sense is applied inconsistently, or the accounts would
show all interest transfers, between consumers, each other, and the banks. We can get some indications
from the household accounts, which in 1994 show that consumers received £34bn in rent, dividends and
6 Table 1.4.
7 Tables 1.2, 1.3, and chapter 4.
interest and paid £30,480m.10 However, consumers do not pay interest to themselves but evidently fall
into two classes – those who pay interest and those who receive it. The monetary system thus transfers
around £30bn (8% of wages) from wage-earners to property-owners. This is the beginning of a true
income account, shown in table 1.
(All figures in £million)
Value added
Income
Value added by wage earners
£362,758
Value added by self-employed
£63,655
Interest transferred to property-owners
(£30,480)
Income of wage-earners
11£395,933
Value added by property owners
£157,048
Interest transferred from wage-earners
£30,480
Income of property-owners
£187,528
Totals
£583,461
£583,461
Table 1: income and value added for the personal sector with interest transfers12
But the story only starts here. If interest is a transfer, then why not profits? The accountants want on the
one hand to classify profits as the legitimate reward of 'capital'. But the interest on capital is treated as a
transfer. You can’t have it both ways: if interest is not a source of value-added, capital cannot be a factor
of production, the source of much discomfort.
There are two coherent solutions. The first, adopted in many countries and some UK tables, is to treat all
property income as a part of output, imputing a sale to the banks equal to their interest receipts and called
an ‘adjustment for financial services’. However, an equally coherent alternative is to say no property
income adds value. In that case, all value is added by wage-earners and all profit income is a transfer out
of this value. The accounts then read as in table 2:
10 Source: DJAO(Table 1.4), GITP, GIUG (table 4.9). The UK household accounts (Table 4.9), available only since 1984 though
backdated to 1975, show personal sector interest payments and receipts separately, instead of (as in the normal personal sector accounts), the net figure. These figures exclude private pensions and so represent true rentier income.
11 Including self-employed from now on unless otherwise stated.
12 Employment and self-employment income: DJAU, DJAO (Table 1.4), income from property calculated as sum of all other
Measuring the UK economy
1999b (7a-radstats-4).doc 7 of 10 25/01/08 19:09
(All figures in £million)
Value added
Income
Value added by wage earners
£583,461
Income transferred as interest
(£30,480)
Income transferred to property
(£157,048)
Income of wage-earners
£395,933
Value added by property owners
£000,000
Interest transferred from wage-earners
£30,480
Income received from workers
£157,048
Combined income of the property-owners
£187,528
[image:8.595.89.503.58.251.2]Totals
£583,461
£583,461
Table 2: income and value added for personal sector with transfers from all property income
We may then further break down the income of the property-owners to show how they divide this
parasitical income between investment, military activity, financial costs, and the indulgences of the
leisure classes, and what the actual priorities accorded to these social needs by their private requirements
and conduct.
Can we just eliminate property income altogether and define output to be £362,758, the income of the
wage-earners? No: and this highlights the existence of a real, scientifically significant constraint. The
intrinsic problem of national accounting is that there are two conflicting definitions of output which must
be reconciled. The reconciliation procedure is what forces the contradictions in the theory to the surface.
The output of an enterprise consists of the things it sells. If we add up all sales of new useful things, we
get an alternative measure of the nation’s output. Yet this commonsense definition does not appear in the
accounts, which throw away the cost of the materials and machinery – called 'intermediate inputs' in the
input-output accounts – used up in making the useful things.13 This remaining 'net output'14 is the total of
all personal incomes, since these arise from the difference between sales and intermediate input. If we
omit profits altogether, we could not say where all the receipts from sales had gone..
The most consistent way to define output is to add up the receipts from the sale of new useful things, in
which case value-added is that part of these payments which make up the income of persons. Because the
accounts record only this personal income, they classify a substantial part of the income transferred
between property-owners as an intermediate input, and promptly omit it. This leads to the paradoxical
result that when when we reclassify something as a transfer, our estimate of net output will increase.
13 The German and Spanish systems record this as ‘commodity flow’ data. Older UK accounts do not follow this practice but in
1992 the UK switched to input-output based accounting, and from that date this information is available.
14 National accounts often use the word ‘net’ to mean output net of depreciation. We mean net output in the census of production
Example 5: Company cars are often recorded as an expense of production. If we designate them as a perk
– a disguised part of wages – then this increases reported national output. Suppose a company previously
wrote its accounts (in condensed form) as in Table 3a. The bottom part is value-added and the top part is
cost. Our minor change in theoretical perspective leads to Table 3b:
Car trips
£20,000
Materials
£100,000
Other materials
£100,000
Total inputs
£120,000
Total inputs
£100,000
Wages
£30,000
Wages
In money
£30,000
In kind (cars)
£20,000
Profits
£10,000
Profits
£10,000
Value-added
£40,000
Value-added
£60,000
[image:9.595.89.508.130.317.2]Output
£160,000
Output
£160,000
Table 3a: Company cars as cost of production Table 3b: Company cars treated as perk
Although gross output is the same, net output has risen by £20,000. The sums of money which figure in
the accounts pay for a whole thing, and not just the value-added in it. If a company car is suddenly treated
as unproductive, then a previously-suppressed expense suddenly appears like the bottom half of an
iceberg.
Banks are like the company car. As the accountants observe, they produce no traded commodity but
merely circulate what is created elsewhere. But they certainly get paid. The accounts make a partial
concession by recording their interest receipts as a transfer, but their real cost is the whole of the money
they receive. If we determine that they add nothing to gross output, then we cannot treat their costs as an
intermediate input. Profits properly stated thus include the full cost of the financial sector since this is
what it actually costs the rest of society to support the activities of the banks.
Measuring the UK economy
1999b (7a-radstats-4).doc 9 of 10 25/01/08 19:09
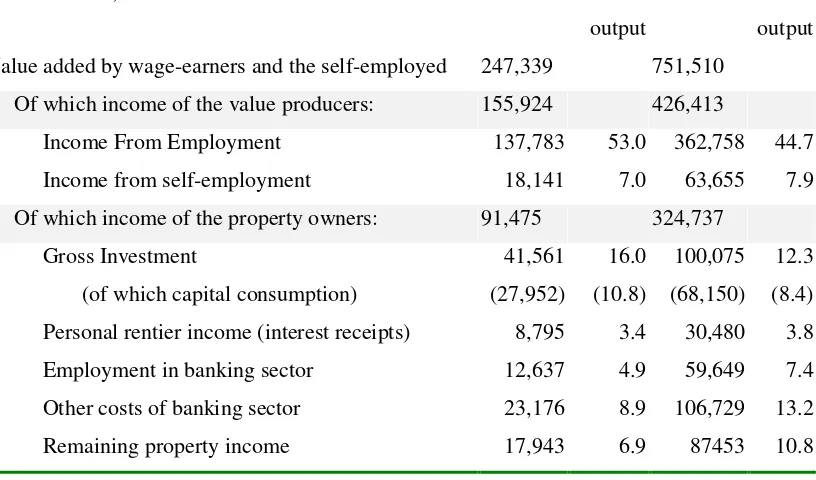
(Millions of £)
1980
% of
output
1994
% of
output
Value added by wage-earners and the self-employed
247,339
751,510
Of which income of the value producers:
155,924
426,413
Income From Employment
137,783
53.0
362,758
44.7
Income from self-employment
18,141
7.0
63,655
7.9
Of which income of the property owners:
91,475
324,737
Gross Investment
41,561
16.0
100,075
12.3
(of which capital consumption)
(27,952)
(10.8) (68,150)
(8.4)
Personal rentier income (interest receipts)
8,795
3.4
30,480
3.8
Employment in banking sector
12,637
4.9
59,649
7.4
Other costs of banking sector
23,176
8.9
106,729
13.2
[image:10.595.98.506.73.313.2]Remaining property income
17,943
6.9
87453
10.8
Table 4: distribution of the product of the UK, 1981 and 1994
An independent check of our calculations which affords further insight is given by the structure of
employment. The following figures16 show the number of people involved in various branches of
production over this period. In a dramatic structural shift, 4,361,000 people moved out of production in
the normal sense, and into financial or commercial services.17
16 Table 17.1
17 The category ‘other services’ here refers almost exclusively to financial services, although some caution is needed in general with
Employment in the UK
1980
1994
Agriculture
380
265
All mining and minerals
354
88
Manufacturing
7253
4330
Electricity, Gas and Water
368
223
Construction
1239
886
Trade
4257
4671
Transport and storage
1056
862
Post and Telecomms
423
366
Total Productive (generous to retail)
15330
11691
Finance
1647
2788
Other services
1584
2178
Total Unproductive
3231
4966
State services
4602
4800
Grand Total
23163
23451
Over these core years of the conservative government, employment income from this point of view fell by
15% from 53% of output to 44.7%. But this gain in income to the property-owning classes was not spent
on increasing the productive capacity of the nation; over the same period the proportion of investment in
output fell from 16.0% to 12.3%, that is by almost a quarter – and it should be remembered that 1980 was
a recession year. Yet at the same time rentier income rose from 3.4 to 3.8% and the cost of the banking
system from 8.9% to 13.2%. Without these drains on the economy, investment would actually have
increased by 1%.
These figures are every bit as factual as those retailed by the pundits – but the story they tell is altogether
different. When it comes to economic facts, never forget you have a choice.
REFERENCES
Schumpeter, J.A. (1994) History of Economic Analysis London: Routledge
Anderson, Victor (1989) Possible Reforms in National Income Accounting, Alternative Economic
Indicators Project. London: New Economic Foundation (mimeo)
Gough, Ian (1979) The Political Economy of the Welfare State, London:MacMillan
Fazeli, R(1996) The Economic Impact of The Welfare State and the Social Wage: the British experience.
Aldershot and Brookfield, USA: Avebury
Freeman, A (1991) ‘National Accounts in Value Terms: the Social Wage and Profit Rate in Britain
1950-1986’, in Dunne(ed) Quantitative Marxism, Cambridge: Polity Press
United Kingdom National Accounts, CSO 1995