© 2018, IRJET | Impact Factor value: 6.171 | ISO 9001:2008 Certified Journal | Page 2615
ANALYSIS OF CRITICAL GAP APPROACHES AT FOUR LEGGED MEDIAN
SEPARATED UNCONTROLLED INTERSECTION IN CASE OF
HETEROGENEOUS TRAFFIC CONDITION
Preet Amin
1,
P.N.Patel
2, A. A. Amin
31
Student of Final Year, M. Tech (Transportation System Engineering), B.V.M. Engineering College, Vallabh
Vidyanagar, Gujarat, India,
2,3
Assistant Professor, Civil Engineering Dept., B.V.M. Engineering College, Vallabh Vidyanagar, Gujarat, India,
---***---Abstract -
The gap acceptance study plays a vital role in thedetermination of capacity and delay at un-controlled intersection and critical gap is one of the important parameter associated with this study. Many studies on critical gap were carried out but they are carried out in context of developed countries where traffic is uniform and rules of priorities as well as lane disciplines are willingly followed, thus there is a need to carry such type of study in developing countries like India. Where, priority rules are less followed which consequently create more clashes on intersections and modelling of such behaviour becomes complex. This paper presents the study of gap acceptance behaviour of drivers on an uncontrolled intersection. In order to examine the gap acceptance behaviour of drivers, 4-legged uncontrolled intersection located in Ahmadabad was selected. Video recording technique was adopted for collection and avidemux video editing software is used for analysis of the data. Different conventional methods are used to calculate the critical gap for through from the minor road. Gaps are analyzed for three different vehicle types namely 2-Wh, car and 3-Wh. A comparison between different existing conventional methods of critical gap determination is carried out and their comparative analysis is presented in this study.
Key Words: Critical gap, Gap acceptance, Two Way Gap Acceptance, Unsignalised intersection, Heterogeneous condition
1. INTRODUCTION
The capacity of unsignalized intersection plays an important role in the estimation of road network capacity. In case of semi-urban and urban scenario, unsignalized intersections are the primary locations where haphazard condition occurs. However accounting of economic criteria it is not possible to install the signals at all unsignalized intersections to reduce the congestions, delay and traffic hazards. In case of India, traffic signals are installed only on major arterials. However, in developed countries, unsignalized intersections are usually controlled by stop and yield signs, which decide the priorities for movements on intersections. Efficient implementations of these signs have made it possible to cross the intersections with minimum conflicts. However, in India, the situation is contradictory. Majority of intersections do not have stops and yields signs. Even if they exist, no body follows it voluntary and enter in the intersections even
conflicting vehicle is about to collide. All these non-standard conditions create very chaotic and complex travel behaviour at unsignalized intersections. As majority of the movements on these non-standard intersections are not controlled, it can be labelled as uncontrolled intersections. Gap acceptance study is an essential study in the determination of capacity and delay of individual moment at uncontrolled intersection and critical gap is one of the important parameter associated with this study. This parameter is a stochastically distributed value and it cannot be measured directly on the field as it varies with driver, time, intersections, type of movement and traffic situations. The efficiency of the road network is elaborated in terms of safety of the driver, speed as well as the capacity of the particular stream. The capacity of two-way stop controlled (TWSC) intersection plays the prime role in the assessment of road network capacity. However the consideration of economic criteria it is not possible to install the signals at all unsignalized intersections to reduce the congestions, delay and traffic hazards. Therefore, in India traffic signals are installed only on major arterials. In developed countries, unsignalized intersections are usually controlled by signs which decide the priority of various movements. Efficient enforcement of priority rules has made it possible to cross the intersections with minimum conflicts. However in India, the situation is totally different. Majority of intersections do not have those signs. Even if they exist, drivers do not follow indicated signs and enter in the intersections even conflicting vehicle is about to collide. All these non-standard conditions create very complex travel behaviour at unsignalized intersections. So majority of the movements on these type of intersections are uncontrolled therefore we label these type of intersections in India as uncontrolled intersections. This paper eventually tries to incorporate and attempts to simplify the suitability for Indian condition.
© 2018, IRJET | Impact Factor value: 6.171 | ISO 9001:2008 Certified Journal | Page 2616 make a manoeuvre (HCM 2000, 2010). Most theories related
to gap acceptance behaviour of drivers supposed that drivers are consistent and uniform which are employed for TWSC intersections. A consistent driver is predictable to act the same manner at all moments and at all similar scenarios. The driver isn’t anticipated to discard a gap and then afterward accept a smaller gap. For a uniform population, all drivers are anticipated to act in exactly the similar way. It is, definitely, unreasonable to expect drivers to be consistent and uniform.
2. STUDY AREA
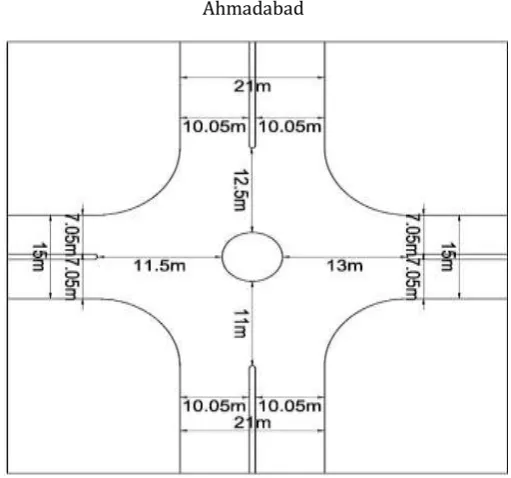
Present study includes the data collection at un-signalised 4-legged intersection of Ahmadabad city in state of Gujarat. The intersection selected for data collection has the following features:
It is a 4-legged intersection with minor road 15 meters wide divided and major road to be 21 meters wide divided (figure 1b)with even and uniform pavement condition respectively.
Intersection exhibit sizable quantum of traffic on each leg to capture sufficient number of accepted and rejected gaps.
Intersection has negligible proportion of non-motorized traffic (NMT) on all the four arms of the intersection.
3. DATA COLLECTION
[image:2.595.309.564.70.276.2]This paper presents a study of gap acceptance behaviour of the driver on uncontrolled intersection. In order to analyze the gap acceptance behaviour of the driver, the four-legged uncontrolled intersection located in Ahmadabad city in the state of Gujarat was selected. This intersection was located in plain terrain with satisfactory sight distances for each movement. There were no bus/taxi/rickshaw stands and parking space nearby this intersection. Incoming or outgoing vehicle behaviour was not affected by the upstream/downstream signals. The total traffic volume on major road varies 1400 to 2500 vehicles per hour and on minor stream it varies from 600 to 1200 vehicles per hour. Data were collected during the peak hours of a typical weekday (9 A.M to 12 A.M). For data collection, Video recording technique was adopted. The recorded tape was played on the big screen to extract and analyze the gap acceptance data with the help of the AVS video editor software. All minor road vehicles were divided into three categories (car, 2-wheeler & 3-wheeler) and the gap data were extracted for two types of movements namely through and right turn from minor road.
Figure 1-: Birds view of the selected site located at Ahmadabad
Figure 2-: Geometric design of intersection
4. ESTIMATION METHODS FOR CRITICAL GAP
4.1Raff Method
[image:2.595.307.563.301.540.2]© 2018, IRJET | Impact Factor value: 6.171 | ISO 9001:2008 Certified Journal | Page 2617 Where t is headway of major stream, Fa (t) is cumulative
probability of accepted gap. Fr (t) is cumulative probability of rejected gap. This method is in use widely in many countries owing to its simplicity and practicality.
4.2Wu’s Model (probability equilibrium method)
The theoretical background of Wu´s model (2006) is the probability equilibrium between the rejected and the accepted gaps. The primary benefit of this model is, it provides a true average of the critical gap, whereas MLM needed predefined distribution function as well as these assumptions. This method yields the empirical distribution of the critical gaps, which can be useful for microscopic simulation. Wu model produces analogous results for the mean critical gap as obtained from Troutbeck MLM when using maximum rejected gap instead of all rejected gaps and if considering all rejected gaps, mean critical gaps would be shorter than previous results. Still, it has a limitation: in the observation data, the minimum accepted gap should be lesser than the highest rejected gap. This can be happening only just in case of little sample size. The cumulative probabilities of the accepted (Fa) and rejected (Fr) gaps are calculated and used to calculate the probability distribution function of critical gaps using the equation,
4.3 Clearing Behavior Approach
This unique methodology is given by Ashalatha and Chandra (2011), and this is the merely approach which was developed for the situation relevant to Indian. They have taken clearing time to incorporate the clearing behavior of the driver and make it differs from other approaches. Clearing time is distinct as the time taken by minor stream vehicle from the instant it moves from its stopped position to the instant its tail-back end reach the end of the conflict area. They defined the term of the critical gap as the gap equivalent to the intersection point of cumulative curves of gap acceptance and clearing time. This intersection point provides a situation when clearing time and available gap to a driver are just equal. This is the utter least time required by driver to go through the intersection safely. Researchers have presented this new concept with strong theoretical backgrounds. However, still, this method has some limitations. A critical gap is the function of both accepted gaps & rejected gap and that is proved by empirical and practical researches. These phenomena will produce a higher estimation of the critical gap as compared to actual critical gap.
4.4 Logit Method
Legit model is a weighted linear regression model with a mathematical form as shown in equation below:
Where is the probability of accepting a gap of size i, and are regression coefficients. A fitted linear line is plotted on the chart to see the time that offers 0.5 probabilities of acceptance of a gap size. This technique is frequently adapted to authenticate the influence of different independent attributes in the critical headway, such as the waiting time, avg. speed, etc. In this formulation a driver who accepts a gap smaller than one previously rejected cannot be incorporated as “incoherent,” in view of the fact that the other independent variables will make a case for that behavior. Thus, all gaps must to be needed, not only the maximum rejected by each driver.
4.5 Greenshield
Macroscopic stream models represent how the behavior of one parameter of traffic flow changes with respect to another. Most important among them is the relation between speed and density. The first and most simple relation between them is proposed by Greenshield. The equation for this relationship is shown below.
Where v is the mean speed at density k; Vf is the free speed and Kj is the jam density. This equation often referred to as the Green shield’s model. It indicates that when density becomes zero, speed approaches free flow speed.
4.6 Harder’s Method
Harder has developed a method in 1968 and become most popular in Germany. This method is almost similar to the lag method but it takes only gaps while Lag method uses lags. Same type of assumption will be required as we discussed in Lag method for practical applications. This method does not have a strong mathematical background. Main drawback is the curve, which has real properties of cumulative distribution function of critical gap, generating from this method may not be steadily increasing over the time or it may be float. Therefore to correct these values floating average procedure has to conduct or large sample size should be required to avoid this effect.
4.7 Ashworth’s Method
© 2018, IRJET | Impact Factor value: 6.171 | ISO 9001:2008 Certified Journal | Page 2618 of accepted gaps as shown in Figure 6. By assuming normal
distributions for and, Ashworth found that the average critical gap can be evaluated from mean of accepted gap E(ta). If the mean and variance of this distribution are E(ta) and Var(ta), then Ashworth’s technique gives the critical gap as,
Where qp is the major stream flow in units of veh/sec and E(tc) denote the mean of critical gap. Main disadvantage of this method is that critical gap estimated by this method is highly correlated with volume of major stream traffic.
5. DISCUSSION OF RESULTS
The Seven approaches represented above were used to determine the critical gap for through movement from a minor road (two wheelers, three wheelers and cars) at four-legged uncontrolled intersection. This result shows several variations in the critical gap parameters estimated by different methods. The values are also quite low in the majority of cases. Though in mixed traffic condition, this parameter is likely to be on the lower side but not as like this. As a lack of firm lane discipline and with wide discrepancy in sizes of numerous types of vehicle, the vehicles are found to stand side by side. Smaller size vehicles can clutch through any offered gap between the large size vehicles and enter into the intersecting space in a random pattern. Vehicles are initiate to enter the conflicting space alongside each other and after passage the on-coming traffic they move as a single, even while accepting a gap. In extreme cases of chaotic behavior, small sized vehicle like a 2-wheeler from a minor street may be found moving opposite to the main traffic slowly and exiting traffic through a lesser gap presented upstream of the uncontrolled intersection space. These distinguishing and unusual features of mixed traffic make the gap acceptance quite assorted from what have been observed under homogeneous traffic conditions and this impact shows in Table 2 where a majority of methods are failing to represent the actual critical gap. Except clearing behavior approach, all other methodologies are established under the developed countries to analyze the homogeneous traffic behavior.
Thus, observations obtained by these approaches are erroneous and thus cannot apply under the conditions relevant to Indian. As compared to through movements from a minor road, right turning movements from a minor road were more hectic as majority of the vehicle was crossing the intersection area in a zigzag manner. In addition, cautious analysis of the field situation revealed that the most of the vehicles accepts the gap in two stages in India. In the majority of cases, drivers were not bothering about the gaps in the distant lane when they are exploring the gaps in the near lane.
Table 1 -: Comparisons of the critical gap (in seconds) estimated by seven important method
Once, they accept the gaps in the near lane and reach up to the median; they start searching the appropriate gaps in the distant lane. This condition creates more confusion at median separated uncontrolled intersection. However, this two stage gap acceptance process increases the entry capacity of an unsignalized intersection but only when there is adequate storage space for one or more vehicles at centre median.
6. CONCLUSION
© 2018, IRJET | Impact Factor value: 6.171 | ISO 9001:2008 Certified Journal | Page 2619 behaviour approach, all other methods are really failing to
interpret the most relevance value of critical gap at four legged uncontrolled intersections. Thus, this technique will help out as a simple tool of the working engineers and researchers in determining different strategies under heterogeneous traffic conditions.
The present study was done with the purpose of initiating research on uncontrolled intersections in India. Very limited concentrated efforts have been made earlier to analyze actual traffic flow at four leg uncontrolled intersection under mixed traffic situations. Future scope of research includes estimation of the impact of various parameters (like occupancy, age of the driver, sex of the driver, speed of on-coming traffic, size of on-on-coming vehicles, number of rejections etc.) on critical gap parameter, especially in the case of assorted traffic conditions.
REFERENCES
[1] Alexander, J., Barham, P., & Black, I. (2002). Factors influencing the probability of an incident at a junction: results from an interactive driving simulator. Accident Analysis & Prevention, 34(6), 779–792.
[2] Ashalatha, R., & Chandra, S. (2011). Critical gap through clearing behavior at unsignalized intersection. KSCE Journal of Civil Engineering, 15(8), 1424-1434.
[3] Brilon, W., Koenig, R., & Troutbeck, R. J. (1999). Useful estimation procedures for critical gaps. Transportation Research, 33(A), 161-186.
[4] Catchpole, E. A., & Plank, A. W. (1986). The Capacity of a Priority Intersection. Transportation Research Board, 20B (6), 441-456.
[5] DeLucia, P. R., Bleckley, M., Meyer, L. E., & Bush, J. M. (2003). Judgments about collision in younger and older drivers. Transp. Res. Part F: Traffic Psychol. Behavior, 6, 63-80.
[6] HCM. (1985, 1994, 2000, 2010). Highway Capacity Manual, SR 209. Transportation Research Board, National Research Council, Washington D.C.
[7] Laberge, J. C., Creaser, J. I., Rakauskas, M. E., & Ward, N. J. (2006). Design of an intersection decision support (IDS) interface to reduce crashes at rural stop-controlled intersection. Transp. Res. Part C: Emerg. Technology, 14, 36-56.
[8] Raff, M. S., & Hart, J. W. (1950). A volume warrent for urban stop signs. Eno. Foundation for Highway Traffic Control. Saugatuck, Connecticut.
[9] Troutbeck, R. J. (1988). Current and future Australian practices for the design of unsignalized intersections. In: Intersections without Traffic Signals, Springer Publications, Berlin.
[10]Wu, N. (2006). A new model for estimating critical gap and its distribution at unsignalised intersection based on the equilibrium of probabilities. Proceeding of the 5th International Symposium on Highway Capacity and Quality of Service. Yokohama, Japan.
[11]Hellon O. Ogallo and Manoj K. Jha, 2014, Methodology for Critical Gap Analysis at Intersections with Unprotected Opposing Left-Turn Movements, Journal of Transportation Engineering, ASCE, ISSN 0733-947X/04014045.
[12] Harsh J. Amin and A.K. Maurya, 2015, “A Review of Critical Gap Estimation Approaches at Uncontrolled Intersection in case of Heterogeneous Traffic Conditions”, Journal of Transport Literature (international transport planning society), vol.9(3).
[13] Jayant P. Sangolea, Gopal R. Patilb and Prasad S. Patarec, 2011, “Modeling Gap Acceptance Behavior of Two-Wheelers at Uncontrolled Intersection Using Neuro-Fuzzy”, Procedia Social and Behavioral Sciences 20 (2011) 927–941.
[14] Mithun Mohan and Satish Chandra, 2016, “Review and assessment of techniques for estimating critical gap at two-way stop controlled intersections”, Europeans transport issue no 61, ISSN 1825-3997.
[15] Mukti Advani, S. Velmurugan, P.V. Pradeep Kumar, E. Madhu, 2016, “Defining and Analyzing Forceful Gap Behavior at Unsignalised Intersections”, Transportation planning Division, CSIR-Central Road Research Institute, New Delhi.