Munich Personal RePEc Archive
The working poor: a comparative
analysis
Gundogan, Naci and Bicerli, Mustafa Kemal and Aydin,
Ufuk
Anadolu University
25 June 2005
Online at
https://mpra.ub.uni-muenchen.de/5096/
THE WORKING POOR: A COMPARATIVE ANALYSIS
Abstract
Recently, there is growing debate in developed countries on the issue of the working poor. Poverty is a phenomenon traditionally associated with economically inactive persons such as the homeless, the unemployed or the handicapped. The changing of work patterns and a growing polarisation in the labour market between low or unskilled work and high-skilled work have created new poverty risks amongst the employed population. As a result of this trend, the concept of the ‘working poor’, which gained ground in the United States in the 1970s, has become increasingly applicable to labour market realities in the world. Today, there are around 550 million person who can be classified as the working poor in the world. In other words, one in every five persons in labour force belongs to a poor household. While the problem of working poverty is broadly discussed in the USA, a limited number of studies exist on this issue in the EU and in Turkey. In this paper, this reality will be emphasized and the situation in the USA, in the EU and in Turkey will be compared.
Key words: poverty, the working poor, labour market
Dr. Naci Gündoğan [email protected]
Dr. M. Kemal Biçerli [email protected]
Dr. Ufuk Aydın [email protected]
THE WORKING POOR: A COMPARATIVE ANALYSIS
Contents
1. Introduction
2. Defining the Working Poor
3. The Size of the Working Poor in the World 4. The Profile of the Working Poor in the USA 5. The Profile of the Working Poor in the EU 6. The Profile of the Working Poor in Turkey 7. Conclusion
1. Introduction
There is a common belief that employment is the best way to tackle poverty. Today, not only the unemployed are the poor but also some people who work are live in poverty. Moreover, among the poor more people are employed than unemployed and majority of poor are living in working poor households. The changing of work patterns and a growing polarisation in the labour market between low or unskilled work and high-skilled work have created new poverty risks amongst the employed population. The title of the World Employment Report 2004-05 which is “employment, productivity and poverty reduction” shows the importance of this issue. This topic was chosen based on the strong conviction and emprical evidence that creating decent employment opportunities is the best way to take people to out of poverty.
2. Defining the Working Poor
Defining the working poor is not easy task. Despite an increasing level of attention there is as yet, however, no generally accepted definition of the “working poor”. Existing definitions of working poor in literature are varied.
The working poor are defined by the ILO as those who work and belong to poor households. This definition involves two statistical units: the individual and the household. The individual is the basis of establishing the “working” and not “working” classification. For employment the definition of the ILO, “worker” designates all who worked at least one hour in the week before the interview. The household is the basis for establishing the “poor” and “not poor” classification (Majid, 2001). There is a variety of poverty definitions. A person is poor if he or she lives on less than US$1 a day. It is important to note that, by definition, a person is counted as working poor only if that person is unable to lift himself or herself and his or her family above the poverty threshold. This means that somebody who earns only 50 cents a day would not be considered as working poor if somebody else in the family earns enough to make sure that each family member lives on more than US$1 a day. Conversely, somebody might earn as much as, for example, US$5 a day but with a family consisting of, say, 10 members (9 of them not working) each member would be living on less than US$1 a day. Such a person would still be counted as working poor. Finally, including the whole family in the concept of working poverty ensures that a rich young person in the developing world who has just started work life and works without remuneration in order to gain work experience is not considered to be working poor (ILO, 2004:26).
In some studies the definition of the working poor is extended to all household members who live in a poor household with at least one worker (Caritas-Schweiz, 1998).
Labour Statistics (BLS), a federal administration bureau that has the legal authority to establish norms. Working poor households have been studied since the 1960s in the US. To a certain extent, economists in the BLS have generated the category of working poor, which became effectively official in the USA in 1989. The working poor are defined “as persons who have devoted at least half of the year to labour market efforts, being either employed or in search of a job during that period, but who still lives in poor families” (Klein, 1989).
France the only EU Member State where some research on the working poor has adopted a similar definition of the working poor: The ‘working poor’ are individuals who spend at least six months in the labour force, working or looking for work, but whose household’s standard of living is below the poverty level (Ponthieux, 2000).
In Canada, the NCW (The National Council of Welfare) defines the working poor “as any economic family whose income is below Statistics Canada’s low income cut off and who earned more than half of that income from wages and salaries or from self employment (NCW, 2002).
The EU has not an official working poor definition. According to the generally accepted definition: “the working poor workers living in a household where at least one member works and where the overall income of the household (including social transfers and after taxation) remains below the poverty line (60% of median equivalised income)” (European Foundation, 2004).
3. The Size of the Working Poor in the World
There are no direct estimates of the working poor and we do not have statistics showing the joint distribution of poverty and employment. Thus we do not know whether there is a higher incidence of poverty among the employed than among the general population; or whether the poor are more or less likely to be unemployed or out of the labour force altogether. But some idea of the size of the working poor population maybe obtained by making assumptions about the labour market characteristics of the poor (Berger-Harasty, 2002).
[image:4.595.73.527.566.708.2]As working under such conditions is not at all what would be called a “decent job”, the ILO developed the concept of working poverty to cover those people who work but do not earn enough to lift themselves and their families above the US$1 or 2 a day poverty line. There is a very high likelihood that people who constitute the working poor work in the informal economy (whereas the reverse is not necessarily the case – people who work in the informal economy are not necessarily working poor). For this reason the estimate of working poor can be interpreted as a first approximation of people who work in the informal economy with very low earnings (ILO, 2004:24).
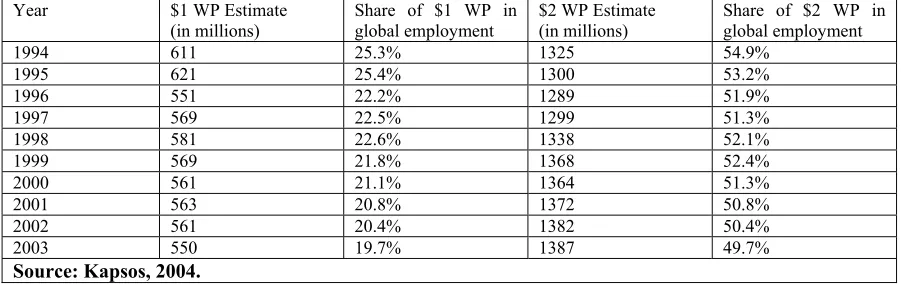
Table 1- Global Working Poverty 1994 to 2003
Year $1 WP Estimate
(in millions) Share of $1 WP in global employment $2 WP Estimate (in millions) Share of $2 WP in global employment 1994 611 25.3% 1325 54.9%
1995 621 25.4% 1300 53.2% 1996 551 22.2% 1289 51.9% 1997 569 22.5% 1299 51.3% 1998 581 22.6% 1338 52.1% 1999 569 21.8% 1368 52.4% 2000 561 21.1% 1364 51.3% 2001 563 20.8% 1372 50.8% 2002 561 20.4% 1382 50.4% 2003 550 19.7% 1387 49.7%
Source: Kapsos, 2004.
(and over 58.7 per cent of the developing world’s workers) are not earning enough to lift themselves and their families above the US$2 a day poverty line, and that 19.7 per cent of the employed persons in the world (and therefore over 23.3 per cent of the developing world’s workers) are currently living on less than US$1 a day (table 1). It is expected that the trends in total number and in shares will decrease in 2004 (ILO, 2004:24).
Table 2- US1$ A Day And Working Poverty Shares in Total Employment (world and regions, selected years, percentage)
US 1$ a day working poverty share US 2$ a day working poverty share
Region 1980 1990 2003a 2015b 1980 1990 2003a 2015b World 40.3 27.5 19.7 13.1 59.8 57.2 49.7 40.8 Latin America and the Caribbean 15.6 16.1 13.5 11.5 41.2 39.3 33.1 28.8 East Asia 71.1 35.9 17.0 6.5 92.0 79.1 49.2 25.8 South-East Asia 37.6 19.9 11.3 7.3 73.4 69.1 58.8 47.7 South Asia 64.7 53.0 38.1 19.3 95.5 93.1 87.5 77.4 Middle East &North Africa 5.0 3.9 2.9 2.3 40.3 33.9 30.4 24.9 Sub-Saharan Africa 53.4 55.8 55.8 54.0 85.5 89.1 89.0 87.6 Transition economies 1.6 1.7 5.2 2.1 1.7 5.0 23.6 9.8
aEstimates, bProjections
Source: Kapsos, 2004.
4. The Profile of the Working Poor in the USA
The definition of the working poor is different from the EU in the USA. According to BLS, “..the working poor are those who spent at least 27 weeks in labour force (working or looking for work) but whose income fell below the official poverty threshold”. The working poor rate in 2003 was 5,3%, 7.429.000 in numbers; unchanged from the rate reported in 2002. The reasons for being a working poor differs from state to state; demographic characteristics, education, occupation, family structure, personal situation and labour market problems may cause working poverty. According to BLS, all these factors more or less, have effects on working poverty, and so must be examined.
4.1.Demography
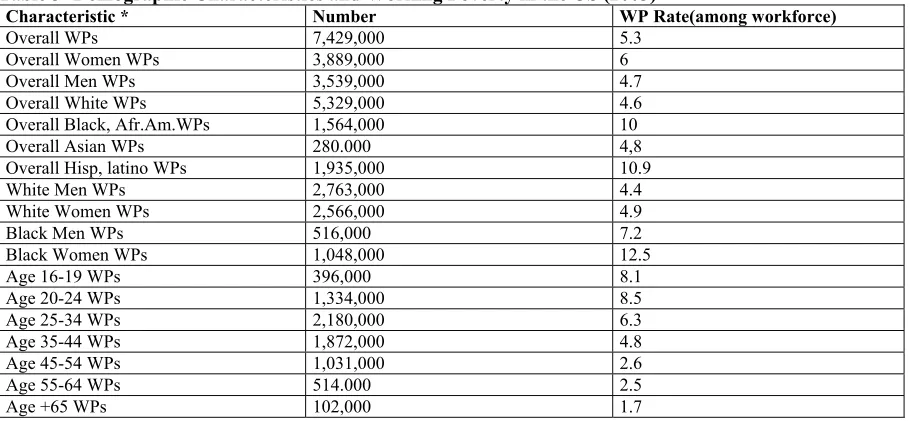
[image:5.595.72.527.538.749.2]Demographic factors have a great effect on poverty especially on working poverty in th US. In 2003, women were poorer than men; hispanic, latin and black workers were poorer than their white counterparts. As the working poverty rate were almost the same among white men and women; black working women were poorer than black working men. Due to their little education and work experience, younger workers were poorer than the older ones. The table below shows the numbers and the rates of the working poor according to demographic characteristics:
Table 3- Demographic Characteristics and Working Poverty in the US (2003)
Characteristic * Number WP Rate(among workforce)
Overall WPs 7,429,000 5.3 Overall Women WPs 3,889,000 6 Overall Men WPs 3,539,000 4.7 Overall White WPs 5,329,000 4.6 Overall Black, Afr.Am.WPs 1,564,000 10 Overall Asian WPs 280.000 4,8 Overall Hisp, latino WPs 1,935,000 10.9 White Men WPs 2,763,000 4.4 White Women WPs 2,566,000 4.9 Black Men WPs 516,000 7.2 Black Women WPs 1,048,000 12.5 Age 16-19 WPs 396,000 8.1 Age 20-24 WPs 1,334,000 8.5 Age 25-34 WPs 2,180,000 6.3 Age 35-44 WPs 1,872,000 4.8 Age 45-54 WPs 1,031,000 2.6 Age 55-64 WPs 514.000 2.5 Age +65 WPs 102,000 1.7
4.2. Education
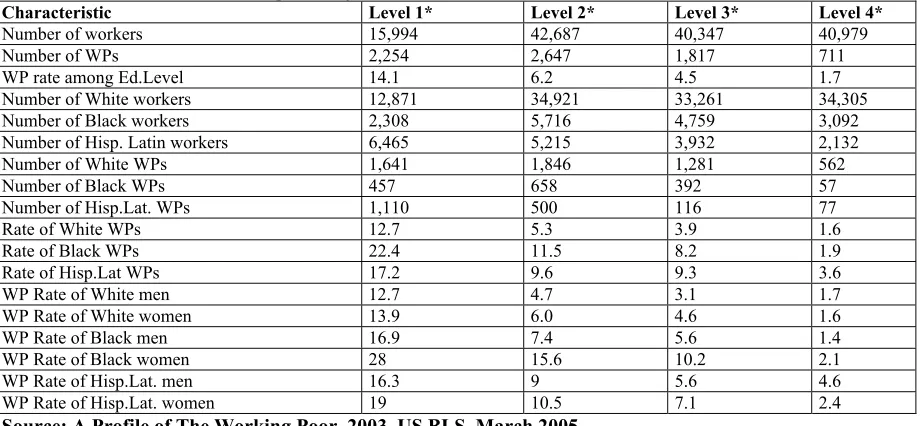
Education has also a major role on poverty. A brief examination can show the relation between education and poverty. The less educated the worker, the higher the risk to be a working poor. At the same educational levels, the working poor rate among black workers is higher. Unlike white workers, at the same educational levels, the risk to be a working poor is higher in black women compared with black men. These results are harmonious with the overall situation and working poverty rates. But it can be concluded from the data that, education is an important tool to combat working poverty.
[image:6.595.70.530.220.433.2]The table below shows the numbers and working poor rates according to educational levels in the US:
Table 4- Education and Working Poverty in the US (2003) (numbers are in 1000s)
Characteristic Level 1* Level 2* Level 3* Level 4*
Number of workers 15,994 42,687 40,347 40,979 Number of WPs 2,254 2,647 1,817 711 WP rate among Ed.Level 14.1 6.2 4.5 1.7 Number of White workers 12,871 34,921 33,261 34,305 Number of Black workers 2,308 5,716 4,759 3,092 Number of Hisp. Latin workers 6,465 5,215 3,932 2,132 Number of White WPs 1,641 1,846 1,281 562 Number of Black WPs 457 658 392 57 Number of Hisp.Lat. WPs 1,110 500 116 77 Rate of White WPs 12.7 5.3 3.9 1.6 Rate of Black WPs 22.4 11.5 8.2 1.9 Rate of Hisp.Lat WPs 17.2 9.6 9.3 3.6 WP Rate of White men 12.7 4.7 3.1 1.7 WP Rate of White women 13.9 6.0 4.6 1.6 WP Rate of Black men 16.9 7.4 5.6 1.4 WP Rate of Black women 28 15.6 10.2 2.1 WP Rate of Hisp.Lat. men 16.3 9 5.6 4.6 WP Rate of Hisp.Lat. women 19 10.5 7.1 2.4
Source: A Profile of The Working Poor, 2003, US BLS, March 2005.
* Level 1 Refers to “Less than a High School Diploma education”; Level 2 Refers to “High School Graduates – No College education”; Level 3 Refers to “Some College or Associate Degree education” and Level 4 Refers to “Bachelor or Higeher Degree education”.
4.3. Occupation
In the USA, jobs of the people give an idea about poverty. It can simply be said that, the likelihood of being among working poor varies widely by occupation. During 2003, 2/3 of working poors were employed in services; sales and office; or production, transportation and material moving. Workers in occupations which require higher educations and characterized by higher earnings are least likely to be among the working poor. Only 2% of the managers, professionals and related employees are classified as working poors. About 2,2 million individuals or 30.1% of the working poor hold service jobs which require less education.
The working poverty rate among service job workers is twice higher in all workers. The proportion of workers in natural resources, construction and maintanence who are classified as working poor is 6.5%; within this occupational group, working poverty rate of farmworkers is 14.6% and construction workers is 7.2%.
The Table below shows the working poverty rate according to occupations.
Table 5- Occupation and Working Poverty in the US (2003) (numbers are in 1000s)
Occupation Workers in numbers WPs in numbers WP rates%
Management Professionals- Rel. Occ. 47,379 931 2 Service Ocucpations 21,051 2,238 10.6 Sales and Office Occupations 34,529 1,571 4.5 Natural Res.-Construction-Maintanence 14,325 936 6.5 Production-Transportation-Mat.Moving 18,080 1,082 6
4.4. Family Matters
In 2003, 4.2 million families were classified as working poor despite having at least one member in the workforce for 27 weeks or more. The risk to become a working poor is higher in families maintained by a single woman (22.5%) than that of a single man (13.5%). Married couples had a lower risk of being among working poor (8.4%) but the rate is higher in families with children and having children raises the risk to be a working poor. Among married couple families with children, the working poverty rate was 5.8% in 2003, and it was higher than 2002 rate.
Interestingly, working wives in married couple families had the lowest likelihood of being among working poor (1.9%) compared with 3.6% of working husbands.
The table below shows vorrking poverty rates according to family matters.
Table 6- Family Matters and Working Poverty in the US (2003) (numbers are in 1000s)
Characteristic Total Families Families below poverty line WP Rate (%)
Total Primary Families 63,567 4,167 6.6
With related children 35,917 3,543 9.9 Without children 27,650 624 2.3 With one member in the workforce 26,893 3,519 13.1 With 2 or more in the workforce 36,674 648 1.8
Married couple Families 48,553 1,872 3.9
With related children 26,170 1,508 5.8 Without children 22,382 365 1.6 With one member in the workforce 16,357 1,380 8.4 With 2 or more in the workforce 32,196 492 1.5
Families maintained by women 10,897 1,915 17.6
With related children 7,563 1,740 23 Without children 3,334 175 5.3
Families maintained by men 4,117 380 9.2
With related children 2,183 295 13.5 Without children 1,194 84 4.3
Source: A Profile of The Working Poor, 2003, US BLS, March 2005.
4.5. Being An Unrelated Individual (UI)
Being an UI raises the risk of being a working poor. An UI refers to the person who lives by him/herself or with other not related to him/her. In 2003, nearly 30 millons UI were in the labour force in the US, and 2.5 million lived below poverty line. Within this group, teenagers, women and hispanic-latino-blacks were more likely to be a working poor than the adults, men and whites.
For the reason to share the living expenses and pooling of resources 61.2% or 2.5 million UI considered working poor live with others. Conversely, many of those who live alone have enough income to support themselves.
The table below shows information about the working poverty of UIs.
Table 7- Unrelated Individuals and Working Poverty in the US (2003) (numbers are in 1000s)
Poverty Status and Work Activity Total Persons Unrelated Individuals
All people 222,509 48,076 People with 27 weeks or more labour force act. 140,007 29,898 People with no labour force act. 69,061 16,010
Characteristic Total Persons Below Poverty Level WP Rate
Total UI 28,898 2,472 8.3
4,650 893 19.2 - 16-24 years old
- 25-64 years old 23,786 1,534 6.4 16,414 1,233 7.5 - Men
- Women 13,484 1,239 9.2 24,429 1,889 7.7 3,751 418 11.1 966 80 8.3 - White
- Black-African American - Asian
- Hispanic-Latino 3,321 420 12.6 16,095 958 6 - Living Alone
- Living with others 13,803 1,513 11
4.6. Labour Market Problems
Workers who have experienced involuntary part-time employment, unemployment or low earnings are likely to be a working poor. On the other hand, only 3.4% of workers who participated in the labour force for 27 weeks or more and usually worked in full-time wage and salary jobs lived in poverty or below poverty level in the USA in 2003.
In the same year, in 2003; 80% of the working poor who usually worked full-time experienced at least one of the labour market problems stated above. Low earnings were the most common reason for the working poverty. Only 3.7% of the working poor experienced all three problems in the USA in 2003. Some 736,000 or 1 in every 5 working poor did not experience any of the labour market problems. The reasons for the working poverty of this group may be the short term employment, family structure or voluntary part-time employment.
The table below shows the relation between labour market problems and the working poverty.
Table 8- Labour Market Problems and Working Poverty in the US (2003) (numbers are in 1000s)
Poverty Status and LM Problems Total Numbers Below Poverty Level WP Rate
Total full-time wage and salary workers 108,621 3,695 3.4 6,609 518 7.8 2,389 59 2.5 - Unemployment only
- Involuntary part-time empl. only
- Low earnings (270 dollars per week or less) only 6,323 1,407 22.3 Unemplmoyment, inv. part-time empl., low earnings 333 136 40.8
Source: A Profile of The Working Poor, 2003, US BLS, March 2005.
5. The Profile of the Working Poor in the EU
Despite the differences in the definitions, working poverty is also a problem in the EU like the US. According to the Eurofund Seminar Report on Working Poverty in the EU, “workers living in a household where at least one member works and where the overall income of the household (includes social transfers and after taxation) remain below the poverty line (60%of median equivalized income) are defined as working poor”. According to the same Report, 17% of the self-employed and 6% of the employed in the EU15 could be classified as poor; and the rate might become higher when the new 10 members (EU25) join the EU.
As working poverty is an hybrid concept related with labour market- employment and poverty-social exclusion, there is not enough research and sufficient data in the EU. Although the Lisbon Strategy and European Employment Strategy offer some solutions against working poverty, the EU doesn’t have a specific policy to combat working poverty. The Lisbon Strategy aims to make the EU, the most competitive and dynamic economy in the world with more and better jobs and greater social cohesion. Meanwhile, the European Employment Strategy deals directly or indirectly with the issue of working poverty with its guidelines such as promoting development of human capital, promoting integration and combatting discrimination, making work pay through incentives to enhance work attractiveness. But instead of interpretation and finding solutions against working poverty, the EU needs to have a special and a direct strategy which will be more essential when EU15 becomes EU25.
In this study, instead of dealing such strategy, the profile and the factors causing working poverty in the EU will be examined.
5.1. Demography
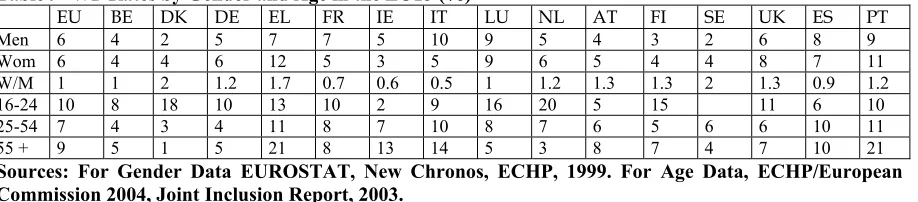
Unlike the situation in the US, working poverty rate among the old is higher than the rate among the employed (25-54 years of age) in the EU15. But, young workers (16-24 years of age) have the highest working poverty rate just like in the US.
The table below shows the relation between demographic factors and working poverty in the EU15.
Table 9- WP Rates by Gender and Age in the EU15 (%)
EU BE DK DE EL FR IE IT LU NL AT FI SE UK ES PT
Men 6 4 2 5 7 7 5 10 9 5 4 3 2 6 8 9 Wom 6 4 4 6 12 5 3 5 9 6 5 4 4 8 7 11 W/M 1 1 2 1.2 1.7 0.7 0.6 0.5 1 1.2 1.3 1.3 2 1.3 0.9 1.2 16-24 10 8 18 10 13 10 2 9 16 20 5 15 11 6 10 25-54 7 4 3 4 11 8 7 10 8 7 6 5 6 6 10 11 55 + 9 5 1 5 21 8 13 14 5 3 8 7 4 7 10 21
Sources: For Gender Data EUROSTAT, New Chronos, ECHP, 1999. For Age Data, ECHP/European Commission 2004, Joint Inclusion Report, 2003.
5.2. Education
Education seems to be a major factor contributing working poverty in the EU. Low educated employees are poorer than their medium and high educated counterparts. This may show that education is an important tool to combat working poverty and it may be a starting point to prepare a strategy against working poverty.
The table below shows the working poverty rate by educational level in the EU15.
Table 10- WP Rates by Education in the EU15 (%)
EU BE DK DE EL ES FR IE IT LU NL AT PT FI SE UK
Low Ed. 12 6 4 9 23 16 11 12 16 16 8 8 16 8 8 10 Med. Ed 5 5 4 4 9 6 6 6 5 5 - 5 3 7 6 7 High Ed. 3 2 3 2 1 3 3 3 5 1 6 7 1 3 7 4
Source: ECHP/European Commission, 2004, Joint Inclusion Report, 2003.
5.3. Type of Employment
According to European Commission Report (2003) around 13% of those working in the EU are self-employed and 13% work on non-permanent basis. 18% of non-permanent based workers work on part-time contracts. These data show that a significant amount of workers in the EU are under the risk of being a working poor.
Across the EU, about 14% of self-employed that are below the poverty level. In the EU13 10% of the part-time employees and 10% of workers that work with a temporary contract are below the poverty line.
[image:9.595.73.532.149.250.2]All this evidence shows that part-time employment and temporary work are major factors causing working poverty in the EU like in the US. The table below shows the situation of the working poor in the EU, according to their work and the type of contracts.
Table 11- WP Rates by the Type of Employment in the EU13 (%)
EU BE DK DE EL ES FR IE IT LU AT PT FI UK
Part-time empl. 10 7 8 9 16 11 6 12 9 - 3 20 18 11 Full-time empl. 5 3 2 3 5 6 5 4 7 8 3 6 3 3 Permanent contr. 4 3 2 3 4 5 5 4 6 8 3 6 3 4 Temporary contr. 10 7 9 8 10 9 9 8 18 7 3 12 8 8
Source: ECHP/ European Commission, 2004.
5.4. Family Matters
The key cause of poverty is most often the structure of the household. The polarisation of households into working poor and working rich is a central question in defining working poverty.
According to ECHP data (1999) in EU14, 59% of couples have two jobs; 36.4% of couples have one job and 4.5% of couples have no job. Scandinavian countries have more couples with two jobs than meditteranean countries.
It can be concluded from the ECHP data that, like in the US, living in a single household (i.e. by themselves) causes significant risk of working poverty.
The table below shows the relations between household/family matters, employment and working poverty.
Table 12- WP Rates by the Household/family structure and Employment in the EU15 (%)
EU BE DK DE EL ES FR IE IT LU NL AT PT FI SE UK Living alone no children 8 9 15 7 12 6 6 11 4 7 12 4 19 7 13 9 Living alone one or more children 22 11 7 31 3 34 15 9 17 22 22 11 25 5 10 28 Living with others, no work, no children 9 8 9 8 17 6 13 12 9 6 6 9 16 7 9 7 Living with others, no work, one or more children 20 14 8 9 20 24 26 24 32 13 13 13 35 8 18 19 Living with others, some or all at work no children 3 2 1 1 11 2 5 2 3 3 4 4 9 5 3 1 Living with others, some or all at work one or more
children 5 4 4 3 11 4 5 2 6 6 6 6 15 3 6 4 Source: ECHP/European Commission, 2004.
5.5. Low Pay
Low pay is a major factor in tackling income poverty so that the extent of low wage employment practices could preclude or weaken the capacity of the household to gain sufficient income to avoid poverty.
There is no commonly agreed definition of low pay but academic literature on low pay generally uses a low pay threshold of “...earnings below two-thirds of the earnings level for all full-time workers”. According to these sources the incidence of low paid worker varies from 12.6% to 15.8% in the EU.
It was concluded in the “Working Poor in the EU” (2004) by Casas-Lata that, there is no evidence showing that low pay is a particular cause of poverty. The household situation, such as being sole earner either in a single-adult or two-adult household is a determinant factor for the incidence of poverty. But a study produced by Eurostat on the situation in the EU shows a different picture. The table below shows the results of that research by Eurostat.
Table 13- WP Rates and Low Paid Workers in the EU13 (%)
EU BE DK DE EL ES FR IE IT LU NL AT PT UK Share of WP among all employees 8 6 4 10 9 9 7 6 10 8 7 6 5 7 Share of low paid workers among all employees 15 9 7 17 17 13 13 18 10 16 16 16 16 21 Share of WP among low paid employees 20 18 13 24 27 19 21 14 25 18 15 16 18 15 Share of low paid employees among WP 37 26 21 41 52 28 38 38 27 38 33 40 21 44 Source: ECHP, 1996.
As it can be seen in the table that, low wage employment plays a determinant but certainly non-exclusive role on constitution of working poverty. For 2 out of 3 low paid workers, other resources from members of the household contribute to maintain the low paid workers from poverty. According to an EIRO study, the factors preventing low paid workers from becoming working poor are mainly:
1. A second (or more) wage earned by a partner or other household member or,
2. Social transfers, notably housing benefits or childcare-related allowances, plus minimum income schemes in some countries.
All these show that low pay together with the household situation have greater effects on working poverty. The table below shows the causes of poverty among workers in the EU.
Table 14- The causes of poverty among workers in the EU14 in 1996 (% of all WP)
EU DE UK DK NL AT EL FR FI LU IT IE ES PT BE
Household structure 73.3 57.5 58.9 62.4 67.9 71.9 79.3 80.4 83.5 85 87.7 89.1 89.2 90.4 93.7
Low Pay 26.7 42.5 41.1 37.6 32.1 28.1 20.7 19.6 16.5 15 12.3 10.9 10.8 9.6 6.3
6. The Profile of the Working Poor in Turkey
It seems impossible to make similar detailed analysis on the issue of working poor for Turkey as the ones made for the U.S.A. and the E.C. countries. The State Institute of Statistics (SIS) of Turkey measures poverty in general and does not provide detailed data on working poor. However it is still possible to find some hints about the characteristics of working poor in Turkey by carefuly investigating the poverty study and other related statistics of SIS.
[image:11.595.157.450.283.456.2]Analysing poverty in Turkey, the first finding that we departure from is the existence of a relatively high unequal distribution of income. According to the Survey of Household Budget of 2003 –which is the most recent statistics on this issue- the income shares of the households in the highest income quintile ise 48.3%, while the share of the households in the lowest income quentile is 6.0%. Table 15 gives the individual income shares by quintile groups in general and in urban/rural areas.
Table 15- Distribution of Disposable Income by Quintile Groups, 2002-2003, [Turkey-Urban-Rural]
Turkey Urban Rural
Income
Shares 2002 2003 2002 2003 2002 2003
Total 100.0 100.0 100.0 100.0 100.0 100.0
Lowest
%20 5.3 6.0 5.5 6.1 5.2 6.4
Second
Next 9.8 10.3 9.7 10.3 10.3 11.0
Third
Next 14.0 14.5 13.9 14.5 14.7 15.0
Fourth
Next 20.8 20.9 20.5 20.8 21.7 21.2
Highest
%20 50.1 48.3 50.4 48.3 48.0 46.3
Gini
Coefficient 0.44 0.42 0.44 0.42 0.42 0.39
Source: SIS, Results of the Income Distribution Survey, 2003.
According to table 15 the average household income in the highest quintile is 8.1 times more than that of the lowest income quintile. Table 15 also shows that income inequality is greater in the urban areas than the rural areas. The relative shares in income of the lowest and the highest urban income groups are 6.1% and 48.3% in 2003. The same percentages for the rural areas are 6.4% and 46.3% respectively. One should note that while these figures are not an indication of higher rural incomes, but they mean that lower rural incomes are distributed more equally than the higher urban incomes. It has been reported that with these Gini coefficients, Turkey is the country that has the highest rate in the OECD countries.
In order to analyse income distribution better, it would be helpful to consider the individual income shares of decile groups. According to the World Development Report 2005 of the World Bank the share of the households in the lowest 10% income group is 2.3%, while it is 30.7% for the highest 10% income group. From This point, the average income in the highest income group is 13.0 times greater than that of the lowest income group. According to the report, following Mexico and the U.S.A., Turkey is the third country in the OECD of which income inequality is the worst (Worldbank, 2005).
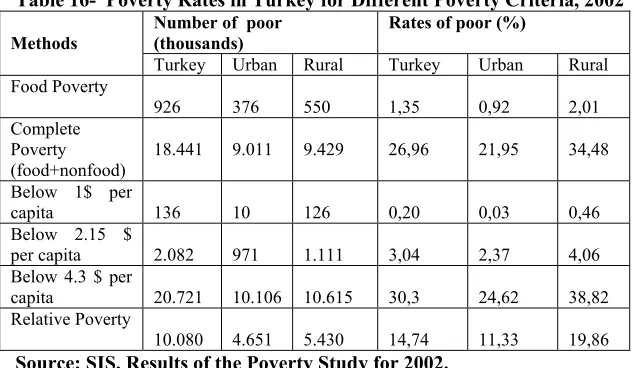
Table 16- Poverty Rates in Turkey for Different Poverty Criteria, 2002 Number of poor
(thousands) Rates of poor (%) Methods
Turkey Urban Rural Turkey Urban Rural Food Poverty
926 376 550 1,35 0,92 2,01 Complete
Poverty
(food+nonfood) 18.441 9.011 9.429 26,96 21,95 34,48 Below 1$ per
capita 136 10 126 0,20 0,03 0,46 Below 2.15 $
per capita 2.082 971 1.111 3,04 2,37 4,06 Below 4.3 $ per
capita 20.721 10.106 10.615 30,3 24,62 38,82 Relative Poverty
10.080 4.651 5.430 14,74 11,33 19,86
Source: SIS, Results of the Poverty Study for 2002.
Together with the previous table, table 2 shows that even though income distribution is more equal in rural areas, poverty rates are higher in rural areas than the urban ones. Also it can be seen from table 16 that poverty rateshighly increase when per capita income lower than $ 2.15 and $4.3 are accepted as criteria.
After the above explanations about income distribution and poverty in Turkey, we now try to determine the dimensions and profiles of working poor. The Poverty Study of the SIS provide information about distribution of poor in accordance with working status. However no information concerning the numbers of working poor, their shares in total employment and their characteristics, can be obtained from this study. For this reason by using the method that was developed by Berger and Harasty (Berger and Harasty, 2002:3), we will try to estimate the upper and lower limits of the number of working poor in Turkey. Since the number of poor is 10 million, total population is 70 million and total employment is 22.1 million, these upper and lower limits can be calculated as follows:
WP: Total numbers of working poor WPL= EMP/POP X POOR= 22.1/70 X 10= 3.1
POOR: Total numbers of poor WPU=POP15-64/POP x POOR= 46/70 X 10= 6.5
POP: Total population WPr= WP/EMP X 100
EMP: Total employment WPLr= 3.1/22.1 X 100= %14
WPr: Rate of working poor WPUr= 6.5/22.1 X 100= %29.4
According to these simple calculations, the number of working poor in Turkey is somewhere between 3.1 million and 6.5 million. These calculations show that the share of working poor in total employment is between 14.8-29.4%. But because of the possible inadequacy of Turkish data, it can be said that these results are not suitable to make comparisons with the U.S.A. and the E.C. members’ rates of working poor.
Table 17- Poverty Rates* of the Households by Status in Employment, 2002 Population Shares** Poverty Rates
Status in
Employment Turkey Urban Rural Turkey Urban Rural Total 100,00 100,0 100,00 100,00 100,00 100,00 Regular
Employee 13,44 17,22 7,76 13,64 12,24 18,31 Casual
Employee 2,60 2,58 2,63 45,01 44,82 45,29 Employer 1,35 1,65 0,89 8,99 6,73 15,26
Self Employed 9,48 4,71 16,64 29,91 21,75 33,38 Unpaid Family
Workers 8,08 2,07 17,10 35,33 27,94 36,67 The
Unemployed 2,06 2,61 1,23 32,44 22,99 62,56 Economically
Inactive People 34,54 39,60 26,93 22,15 18,53 30,14 People
Younger than
15 years old 28,46 29,55 26,82 34,55 30,59 41,10
Source:SIS, Results of the Poverty Study for 2002.
According to table 17, almost half of the poor (45%) are from the households that work as “casual workers”. The second high percentage of poor contains people who work as “unpaid family workers”. Other household members that suffer poverty problem are the ones who are the unemployed and the self-employed. In the rural areas the unemployed have the highest share in working poor, while it is the casual workers in the urban areas that have the highest share.
Investigating the characteristics of the groups that have high poverty rates will also help us explore the reasons of poverty. The first group that we will analyse is “casual workers”, the workers that work on daily payment basis.
6.1. Casual Workers
Casual workers’ high poverty rates can be explained by the characteristics of jobs that they work. These jobs that usually employ workers on daily payment basis are generally “seasonal” in nature and do not require high skill levels. According to the SIS’s data of 2002 only 1% of employers that work on daily payment basis are faculty graduates while 77.2% of these workers have primary and lower (literates but have no diploma and illeterates) levels of education.
It is obvious that workers’ low level of education in these jobs cause low wage levels and poverty . As a matter of fact The Poverty Study 2002 of the SIS confirms this saying since poverty rates estimated for university graduates is 15%, while it is 41.0% for illeterates and is 34.6% for the ones who literate but have no diploma.
[image:13.595.132.460.84.313.2]Table 18- Employed People by Status in Employment and Branch of Economic Activity, 2002
Employers The Self-Employed
Unpaid Family Workers
Branch of Economic Activity
Turkey Urban Rural Turkey Urban Rural Turkey Urban Rural Agriculture and
Forestry 21,0 7,0 43,9 6,7 2,6 22,6 60,5 14,0 80,8 Mining and
Quarrying 0,4 0,2 0,6 0,3 0,2 0,4 0,1 0,1 0,1 Manufacturing 13,9 16,1 10,2 24,0 25,3 19,3 5,3 10,5 3,1 Electricity, Gas
and Water 0,1 0,0 0,1 0,0 0,0 0,0 0,0 0,0 0,0 Construction
28,5 31,0 24,5 5,4 5,6 4,6 2,2 5,6 0,7 Wholesale and
Retail Trade 14,3 18,4 7,8 47,8 49,2 42,0 22,2 50,6 9,8 Transportation,
Communication
and Storage 6,9 8,4 4,4 3,0 3,3 2,0 6,2 10,6 4,2 Finance,
Insurance, Real
Estate 1,1 1,4 0,7 6,8 7,7 3,3 1,4 3,6 0,4 Community,
Social and Personal
Services 13,8 17,5 7,8 6,8 6,1 5,8 2,1 5,0 0,9 TOTAL 100,0 100,0 100,0 100,0 100,0 100,0 100,0 100,0 100,0
Source: Calculations are made by us based on 2002 data of the SIS
According to table 18, in the urban places casual workers concentrated on construction jobs (31.0%), wholesale and retail trade (18.4%) and community, social and personal services (17.5%).
Table 19- Poverty* Rates of the Households by Branch of Economic Activity, 2002
Population Shares** Rates of Poverty
Branch of Economic
Activity Turkey Urban Rural Turkey Urban Rural
Total 100,00 100,00 100,00 26,96 21,95 34,48 Agriculture
and Forestry 14,05 2,67 31,13 36,19 32,80 36,62 Mining and
Quarrying 0,25 0,16 0,37 2,22 2,39 2,10 Manufacturing 5,38 6,32 3,97 16,65 13,08 25,18 Electricity, Gas
and Water 0,18 0,17 0,19 16,62 3,35 34,82 Construction
1,87 2,12 1,50 35,92 37,62 32,32 Wholesale and
Retail Trade 5,95 7,69 3,33 18,97 18,79 19,59 Transportation,
Communicatio
n and Storage 1,88 2,05 1,62 14,01 13.47 15,03 Finance,
Insurance, Real
Estate 0,78 1,20 0,14 7,87 8,47 0,00 Community,
Social and Personal Services
4,62 5,85 2,78 14,58 11,00 25,87
The
Unemployed, Economically Inactive People and People Younger Than 15 years old
65,05 71,76 54,98 27,90 23,66 36,21
Source: SIS, Results of the Poverty Study for 2002.
When we interpret the rates in above table with the rates of table 18, we can clearly explain the main point in casual workers’ poverty problem. As we mentioned before, working on daily payment basis is common for workers who have low levels of education and who work in seasonal jobs. It is possible to observe these kinds of jobs mostly in such sectors as agriculture, construction and wholesale and retail trade. According to table 19 high poverty rates in these sectors confirm the link between poverty of casual workers and their branches of economic activities.
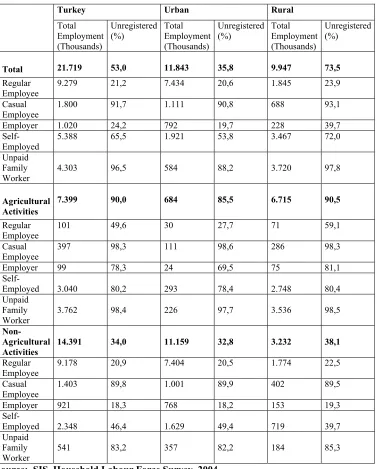
Table 20- Employed People by Status in Employment and Status in Registration, 2004
Turkey Urban Rural
Total Employment (Thousands)
Unregistered
(%) Total Employment (Thousands)
Unregistered
(%) Total Employment (Thousands)
Unregistered (%)
Total 21.719 53,0 11.843 35,8 9.947 73,5
Regular
Employee 9.279 21,2 7.434 20,6 1.845 23,9 Casual
Employee 1.800 91,7 1.111 90,8 688 93,1 Employer 1.020 24,2 792 19,7 228 39,7
Self-Employed 5.388 65,5 1.921 53,8 3.467 72,0 Unpaid
Family
Worker 4.303 96,5 584 88,2 3.720 97,8
Agricultural
Activities 7.399 90,0 684 85,5 6.715 90,5
Regular
Employee 101 49,6 30 27,7 71 59,1 Casual
Employee 397 98,3 111 98,6 286 98,3 Employer 99 78,3 24 69,5 75 81,1
Self-Employed 3.040 80,2 293 78,4 2.748 80,4 Unpaid
Family
Worker 3.762 98,4 226 97,7 3.536 98,5
Non-Agricultural
Activities 14.391 34,0 11.159 32,8 3.232 38,1
Regular
Employee 9.178 20,9 7.404 20,5 1.774 22,5 Casual
Employee 1.403 89,8 1.001 89,9 402 89,5 Employer 921 18,3 768 18,2 153 19,3
Self-Employed 2.348 46,4 1.629 49,4 719 39,7 Unpaid
Family
Worker 541 83,2 357 82,2 184 85,3
Source: SIS, Household Labour Force Survey, 2004.
According to table 20, a very large proportion of workers are not covered by social security. In 2004, 34% of income receiving people in non-agricultural activities and 90% of income receiving people in agriculture do not benefit from social security. The percentage of uninsured people in rural areas are even higher (73.5%). In urban areas, on the other hand, the percentage of uninsured people is 35.8%. In respect to working status, coverage of social security is very low for those who are “casual employees”, “unpaid family workers” and “the self-employed”.
Since most of the casual employees have no social security, it can be assumed that these workers have low levels of life quality and they are under the poverty level.
increase (TISK, 2004: 10-11). Two sources of these high labour costs are high payroll taxes and high employer’s contribution to social security. Employer’s contribution to social security is now more than half of the net wages and has been increasing continuously in real terms. This stimulates both the employers and the employees to be out of social security system (TISK, 2003: 53).
As a result, the main causes of casual workers’ poverty are workers’ having low level of education and their concentrating on such sectors as agriculture in rural areas and construction in urban areas. Since in these sectors the jobs are “seasonal” and firm sizes are “small”, average wages are low and unregistered employment is common. To sum up, casual workers is the principal group that suffer from poverty because of all these reasons mentioned above.
6.2. Unpaid Family Workers
In Turkey, those who work as unpaid family workers is involved in group that has the second high rates of poverty. Poverty rates of this group is 36.6% in rural areas, while it is 27.9% in urban places. These rates point out two principal features of Turkish labour markets.
The first feature is that agriculture’s share in total employment is stil quite high. This share has been reduced to 30s % of total employment while it was 84% when the Republic of Turkey was established in 1923. But comperatively speaking even this reduced share of agricultural employment is higher than that of developed countries.
The second significant feature of Turkish labour markets is that majority of the firms in both agriculture and manufacturing are defined as “small firms”. According to the General Agriculture Survey of 2001, 64.8% of the agricultural production units have lands less than 50 acres. In the same way, 94.4% of manufacturing firms employ 1-9 workers (Resmi Gazete, 31.10.2004, S.25626: 170). Since small firms are weak in general from financial standpoint, it is necessarry for these firms to use family members in production without any regular payment. These unpaid family workers generally do not get any continuing and high income apart from the small allowances that they may get sometimes. Also a vast majority of them (according to table 20, 96.5%) do not have any social security. These factors put unpaid family workers in disadvantaged groups in respect to income distribution.
6.3. The Unemployed
[image:17.595.80.526.621.716.2]Table 17 shows that one of the groups that have high rates of poverty is the unemployed. Poverty rates of the unemployed is 32.4% in general, while it is 22.9% in urban areas and 62.5% in rural areas. From these rates it is clear that poverty is a more common problem for the unemployed in rural areas. To analyse the causes of poverty of the unemployed, it would be helpful to investigate the unemployment rates both from geographical and gender points of views. In these aspects table 21 gives the necessary information.
Table 21- Unemployment Rates by Gender (Turkey-Urban-Rural) (2000-2005)
Turkey Urban Rural
Years Total Men Women Total Men Women Total Men Women 2000 6,5 6,6 6,3 8,8 7,8 13,0 3,9 4,9 2,0 2001 8,4 8,7 7,5 11,6 10,3 16,6 4,7 6,5 1,7 2002 10,3 10,7 9,4 14,2 13,0 18,7 5,7 7,3 3,0 2003 10,5 10,7 10,1 13,8 12,6 18,3 6,5 7,9 4,2 2004 10,3 10,5 9,7 13,6 12,5 17,9 5,9 7,3 3,2 2005 11,5 11,7 10,8 13,8 12,7 18,1 8,2 10,1 4,4
Source: SIS, Electronic data base of Household Labour Force Surveys
Table 21 shows that the unemployment rates tend to increase since 2000. In this period the unemployment rates have taken values between 4-8% in rural areas and 9-14% in urban areas. This indicates that in rural areas agricultural activities reduce or hide unemployment. Thus in these areas the most common forms of status are the self employed and the unpaid family workers. However, during the period the unemployment rates in even rural areas have dramatically increased from 3.9% to 8.2%. This can be accepted as an increase in the deepness of the problem.
The principal reason of the unemployment in Turkey is that economy is unable to create enough jobs due to the unsteady economic growth. In the last decade, Turkish economy had experienced three severe recessions where the growth rates became 6.1% in 1994 and 1991 and 9.4% in 2000 in negative terms. From 2002 on high positive growth rates have been achieved. Insipite of this the Turkish economy have been unable to reduce unemployment .
In view of many the main reasons of this “economic growth that does not create jobs for the unemployed” are the rigidities in the labour markets. As we mentioned before, the high burden of payroll taxes on the employers encourages them to be unregistered. It is clear that this also discourages them to create new jobs. According to the calculations made on this issue reducing labour costs by 15% will lead to a 1% increase in total employment and 0.8 point decrease in the unemployment rate (Gürsel et al., 2002: 226). From these calculations it would not be wrong to say that high taxes and social security contributions simply punish creation of the new jobs. It is obvious that because of high labour costs for the last three years Turkish employers have preferred to use available workforce overtime to increase production instead of employing the new ones.
Poverty of the unemployed in Turkey is related to the the weakness or absence of unemployment compensation.. From financial point of view, it is known that the worst effect of unemployment is income loss. Therefore, it is essential to compensate the unemployed in order to prevent them from falling under the poverty level. In Turkey the unemployment insurance system was established on 25 August 1999. Collection of premiums commenced on 1 June 2000 and first benefit payment were made in March 2002. However since then only a small minority of the unemployed has been taking adventage of the system. In 2004, for example, only 73.000 out of 2.5 million of the unemployed were compensated by the unemployment insurance system. This can be accepted as a clear sign of the system’s insuffuciency which is the sole reason of the unemployed’s poverty problem.
Also, from another point inadequacy of the unemployment insurance system can be accepted as an indirect cause of poverty of the unemployed. Because there is not enough remuneration for the unemployed, most of the unemployed are ready to accept job offers without taking care of their qualities. This situation is known as “underemployment”. Because of the unemployment threat many people work under the poor conditions. Most of the workers in this group say that they are looking for other jobs because of low wages.This can be admitted as a clear sign of working with low wages.
6.4. The Self-Employed
The fourth group of workers that have high poverty rates are the ones who work as self-employed. As previously shown in table 17; poverty rates of this group is 29.9% in general, while it is 21.7% in urban areas and 33.8% in rural areas.
Tablo 22- The Self-Employed by Status in Employment and Location of Workplace (%) (Mean Values of 2000-2003) (Turkey-Urban-Rural) (Women-Men)
Turkey Urban Rural
Total Women Men Total Women Men Total Women Men Total 100.0 100.0 100.0 100.0 100.0 100.0 100.0 100.0 100.0 Regular 22,8 7,1 25,4 49,423,4 52,5 10,7 2,0 12,3
Casual 77,2 92,9 74,6 50,6 76,7 47,5 89,3 98,0 87,7
[image:19.595.72.523.141.215.2]Source: Calculations are made by us based on the data of the SIS
Table 22 presents that in urban places almost half of the self employed workers work in regular jobs while this rate is 10.7% in rural areas. It is obvious that there are two reasons for this difference. The first is that, most of the economic activities in rural areas are in agriculture. The second reason is the high share of small enterprises in agriculture.
[image:19.595.111.472.336.465.2]Analysing the distribution of casual jobs that self employed workers perform will help us understand the source of poverty of these workers. Table 23 shows the results of our calculations made on this issue.
Table 23- Distribution of the Casual Self Employed by Work Place Status and Gender (Mean Values of 2000-2003) (Turkey-Urban-Rural)
Turkey Urban Rural
Total Women Men Total Women Men Total Women Men Total 100,0 100, 100,0 100,0 100,0 100,0 100,0 100,0 100,0 Market
Place 2,3 0,7 2,6 9,2 2,0 10,6 0,6 0,2 0,7 Mobile 6,3 0,9 6,9 25,6 3,7 29,4 1,3 0,2 1,5 Irregular
Place 11,2 0,9 12,6 32,3 3,4 38,0 5,8 0,2 6,9 At
Home 2,6 12,2 6,3 8,4 44,6 1,6 1,1 4,3 0,4 Field 77,6 85,3 71,6 24,5 46,3 20,4 91,2 95,1 90,5
Source: Calculations are made by us based on the data of the SIS
Table 23 exhibits that in Turkey most of the casual self employed jobs are the ones that are made on the fields (77.6%). Jobs that are performed in irregular (11.2%) and mobile (6.3%) places are also common among the casual self employed workers.
In the rural areas small scales of agricultural enterprises and depedency of agricultural production on the weather conditions are the main reasons of the self employed workers’ poverty. Also it is known that the growth rates of agriculture has been slower than the ones for the economy in general and during the last 25 years the government’s financial supports to agriculture has been gradually decreased. It can be thoght that all these factors may contribute to the poverty problems of the self employed workers in rural areas.
When it comes to the urban areas, as we previously mentioned the insufficiency of UI system and the low levels of education of the workforce may force many workers to work in irregular or mobile places as the self employed. Since most of the times there is no regular earnings and social security in these jobs, poverty becomes inevitable for them.
6.5. Gender
Although from gender standpoint The Poverty Study of the SIS does not include any information about the working poor, by using other related statistics and the results of researches made on this issue, it is possible to reach to a conclusion on this matter.
higher poverty rates than the others described as the unpaid family workers and the unemployed.
The status of “unpaid family worker” is more common among women than men especially in rural areas. The SIS’ Household Labour Force Surveys reveal that women in urban places have more difficulties in entering labour markets than the ones who live in rural places. According to these statistics, in 2005 labour force participation rate (LFPR) of urban women is 17.7% while it is 31.9% among rural women. This huge difference between the urban and rural LFPR’s of women may lead us to have a conclusion that women in rural areas might enter labour markets easily. But if we consider the fact that about 80% of these women work as unpaid family workers in rural places, the issue becomes clearer. It is highly possible that these women are under the level of poverty because of the reasons that we mentioned before to explain the reasons of poverty of the unpaid family workers.
In rural areas not only the women who work as unpaid family workers, but also the women who employ themselves have disadvantages with respect to income distribution. Table 22, which shows the distribution of the self employed workers between casual and regular jobs, displays that women are in worse conditions than men. In rural areas the rates of working in casual jobs among the self employed is 87.7% for men whereas it is 98.0% for women. The difference between two is far more bigger in the urban areas.
In the urban areas, 45.0% of the self employed men work in casual jobs while this rate is 76.6% for women. From table 23 it can be drawn that the majority of self employed women who work in irregular jobs work in fields in rural areas and in their houses in urban areas. According to this women who can find opportunities to work as unpaid famil workers or self employed workers in rural areas are not able to find similiar opportunities in urban labour markets. There are several reasons of this.
The first reason is the low educational levels of women. It is seen that in the urban labour markets women who have lower educational level than high school do not get enogh job opportunities.
The other reasons are the low wages and insufficient social support for women. For example, in a study it was found that the average annual incomes of female-headed households in urban areas are 67% of the male-headed households (Kasnakoğlu, 1997: 3). That is in Turkey it is observed that in most sectors women get 20-30% less wages than men (Zeytinoğlu, 1998: 189).Having lower earnings than men most of the times makes it difficult for the urban women to buy professional child care services.According to a research made on this issue in Şanlıurfa only 3% of 830 women said that they get use of child care services and 65% of them claim that they get support from their mothers and mother-in-laws in taking care of their children (Çolak and Kılıç, 2001: 96).
Because child care services are expensive and wages are low, most of the women, who are not able to get relatives’ support for child care, prefer to be out of labour force or they work at home for the sub-contractor firms mainly in textile sector. Neverthless, as seen from table 23 in urban areas 44.6% of the self employed women that work in irregular jobs work at home. In these kinds of jobs working hours are usually longer and the earnings are lower than regular jobs. For instance in a research that was done among the women who work at home in Bursa and İstanbul in 1993, it was found that women work 34-51 hours per week but get less than 30% of the minimum wage (Lordoğlu, 1993: 106).
expilicit that women who left left labour markets because of unemployment are counted as “economically inactive people” and probably fall under the poverty level. Just as table 17 indicates the poverty rate of economically inactive people as 22.5%.
In conclusion, high share of agriculture in Turkish economy and the low educational levels of the work force condemn the majority of people to work as the self employed. As agriculture is already an unproductive sector and the firm sizes are generally small, poverty problem becomes inevitable.
Low educational level affects the employment status of both women and men negatively in urban areas too. This also leads to poverty problem. In the urban labour markets working in mobile and unstable work places is common for men while working at home is so for women. In the form of working at home women are able to avoid such problems or costs as transportation and sexual harrasment and get the advantages of working without delaying their home duties. But because these jobs provide very low income, women who work at home are probably under the level of poverty.
To sum up, it can be said that to overcome the problem of working poor, Turkey has to reduce unemployment and eliminate the rigidities that hinders enlargement of employment . The solution to this problem is related to not only creating new jobs, but also creating better jobs in quality. To achieve this goal it is necessary to increase the share of wage earners in total employment and to decrease the share of people who work as the self employed and the unpaid family workers. To be honest, to realize all these things depends on such factors as; providing a stable growth in economy, increasing per capita income, extending the level of education of workforce and reducing the share of agriculture in the economy. It is obvious that all these changings require long and difficult steps to take.
7. Conclusion
In this study we tried to analyse working poor problem from comperative point of view. Because of the data limitations there are very little research on this issue especially in both the European countries and Turkey. Insipite of this fact we are able to find some characteristics of working poor. The main findings of the study are as follows:
z The working poverty rate in Turkey (approximately 20%-our estimation-) is higher than the USA (%5.3) and the EU15 (6%).
z While the working poor are mostly women in the USA and Turkey; surprisingly, women and men face the same likelihood of being working poor at the EU level.
z In the USA and in the EU, the working poverty rate among service sector workers is higher than that of the other workers. Also, farm workers are more likely to be classified as working poor than workers in other occupations. Likewise majority of working poor work in agricultural sector in Turkey. Because a vast majority of agricultural production units have small lands, they are financially weak and they earn unsteady incomes due to dependancy of production to weather conditions. Also in Turkey working as unpaid family workers are common form of employment for the women while working as the self employed is so for the men. All these factors cause poverty.
difference between mid-age and older workers and finally in Belgium, Germany, Greece, Finland and UK working poverty seems to be less related with age.
z Hispanic, Latino and black workers are poorer than their white counterparts in the USA. Immigrants and ethnic minorities face an increased risk of working poverty in all EU countries. Immigrants and ethnic minorities are often ‘pushed’ into sectors in which the work is less well paid and valued. There is not any data about ethnical characteristics of the working poor in Turkey.
z The self employed are at increased risk of being poor. EU data suggest that 17% of the self employed people in the EU15 could be classified as poor. The working poor are casual workers (45%), unpaid family workers (35%) and the self employed (29%) in Turkey. Most of the casual workers and unpaid family workers work in “agriculture” in rural areas, while “construction” and “retail trade” are the sectors that they mainly work in urban areas. Also, in Turkey majority of the self employed workers work in casual jobs than regular ones. Most of these casual jobs are performed in the fields and irregular and mobile work places.
z One of the most striking findings of this study is that most low paid workers (83%) are not poor in the EU. While only one in five low wage earners can be characterised as working poor in the EU, low earnings are the most common labour market problem for the working poor in the USA (62%) and in Turkey. Especially the women in Turkey that work at home for the sub-contractor textile firms get less than the minimum wage inspite of the fact that they work much more than 40 hours per week.
z The main cause of working povery is the structure of the household in all countries. The working poverty rate in the households with one member in the workforce is higher than the households with two or more members in the workforce. Also, the risk to be a working poor is higher in the families having one or more children than the families without children. According to a study made on individual income distribution in Turkey, for example, poverty rates of large family without children has been found as 13.9%, while it has been 19.6% for the large families with two or more children (Gürsel et al., 2000: 23).
z The correlation between low education levels and working poverty is very strong. The likelihood of being classified as working poor greatly diminishes as workers achieve higher levels of education in all countries.
z Part-time employment and temporary works are major factors causing working poverty in all countries. Poverty rate in part-time and casual workers is 10% in the EU. The poorest workers are casual employees in Turkey (45%).
REFERENCES
Berger, Stefan- Harasty, Claire (2002), “World and Regional Employment Prospects: Halving the World’s Working Poor by 2010”, ILO Employment Paper, 2002/38.
BLS (2005), “A Profile of the Working Poor, 2003”, (www.bls.gov).
Caritas, Schweiz (1998), Trotz Eincommen kein Auskommen: working poor in der Scheweiz (Luzern, Caritas-Verlag).
Çolak, Ömer Faruk and Kılıç, Cem (2001), Yeni Sanayileşen Bölgelerde Kadın İşgücü Arzı: Şanlıurfa Örneği, TİSK Yayınları, Yayın No: 214, Ankara.
EC (2004), “Joint Inclusion Report 2003, Brussels.
European Foundation for the Improvement of Living and Working Conditions (2004),
“Working Poor in the European Union”, Seminar Report, Brussels, 1-2 July 2004.
EUROSTAT (1999), New Chronos.
Gürsel, Seyfettin et al. (2000), Individual Income Distribution in Turkey: A Comparison With The European Union, Turkish Industrialists’ and Businessmen(s Association
Publication, Pub.No. 2000-12/296, İstanbul.
Gürsel, Seyfettin et al. (2002), Türkiye’de İşgücü Piyasası ve İşsizlik, Türk Sanayicileri ve İş Adamları Derneği (TÜSİAD) Yayın No: 12-354, İstanbul.
ILO (2004), World Employment Report 2004-05, Geneva.
ILO (2004a), Global Employment Trends 2003, Geneva.
ILO (2004b), Global Employment Trends for Women 2004, Geneva.
Kapsos, S, “Estimating Growth Requirements for Reducing Working Poverty: Can the World Halve Working Poverty by 2015”, ILO Employment Strategy Paper No. 2004/14, Geneva, 2004.
Kasnakoğlu, Zehra (1997), “Income Distribution in Turkey; Who Gets What?”, http://www.tusiad.org/yayin/private/autumn97/html/kasnak.html, pp:1-9.
Klein, B. W. and Rones, P. L. (1989), “A Profile of the Working Poor”, Monthly Labour
Review, October 1989.
Lagaranne, Christine- Legendre, Nadine (2000), “The Working Poor in France: Personal
and Family Factors”, Economie at Statistique, No. 335, 2000-5
(http://www.insee.fr/en/ffc/docs_ffc/Is48_335.pdf)
Majid, Nomaan (2001), “The Working Poor in Developing Countries”, International Labour Review, Vol. 140, No. 3.
Mosisa, Abraham (2003), “The Working Poor in 2001”, Monthly Labour Review, November/December.
NCW (2002), Poverty Profile.
Özer, Mustafa and Biçerli, Kemal (2003), “Türkiye’de Kadın İşgücünün Panel Veri Analizi”, Anadolu Üniversitesi Sosyal Bilimler Dergisi, Cilt:3, No: 1, pp. 55-85.
Pena Casas Ramon- Latta Mia (2004), Working Poor in the EU, European Foundation for the Improvement of Living and Working Conditions.
Ponthieux S. and Concialdi P. (2000), “Low Pay and Poor Workers: A Comparative Study
of France and the USA”, Transfer 6, Winter 2000.
Resmi Gazete, 31/10/2004, Sayı: 25629
Shipler, David (2004), The Working Poor: Invisable in America.
SIS (2003), “Poverty Study for 2002”.
SIS (2003), “Income Distribution Survey”.
SIS (2004), “Household Labour Force Survey”.
Strengmann-Kuhn, Wolfgang (2002), “Working Poor in Europe: A Partial Basic Income for Workers”, BIEN 9th International Congress, Geneva, 11-14 September.
The World Bank (2005), World Development Report 2005.
TİSK Türkiye İşveren Sendikaları Konfederasyonu (2003), Türkiye’de Kayıtdışı İstihdam, TİSK Yayın No: 233, Ankara.
Warren, C. R. (2002), “Poverty, the Working Poor and Income Inequality: Review of
Recent Research”, Building Ladders for Success Project, Chicago, 2002.
Zeytinoğlu, Işıl Urla (1998), “Constructed Images as Employment Restrictions:
![Table 15- Distribution of Disposable Income by Quintile Groups, 2002-2003, [Turkey-Urban-Rural] Income Turkey Urban Rural](https://thumb-us.123doks.com/thumbv2/123dok_us/8088153.784135/11.595.157.450.283.456/distribution-disposable-income-quintile-groups-turkey-income-turkey.webp)