Hand Geometry Verification based on Chain Code and
Dynamic Time Warping
I Ketut Gede Darma Putra
Made Ari Sentosa
Department of Electrical Engineering Alumni of Department of Electrical Engineering
Udayana University, Bali, Indonesia Udayana University, Bali, Indonesia
ABSTRACT
This research demonstrated a technique for hand geometry biometric verification using hand contour matching. Hand shape feature is obtained by using a chain code method. Since the vector length of the hand shape chain code of each user is distinct tendency then Dynamic Time Warping (DTW) is suitable metrics to match of two chain code features. System performance was tested by using databases that consists of 75 users with 12 hand image samples for each user. The experimental results show the system produces about 84% success rate with FNMR = 7.98% and FMR = 7.92%.
General Terms
Biometrics, Pattern Recognition, Image analysis.
Keywords
Hand geometry, DTW, chain code.
1.
INTRODUCTION
Hand geometry is one of the very well known physical biometrics and has been widely implemented in security system. Some of successful applications of hand geometry are employee time and attendance and physical access control. Highly public acceptance, easier to collect, relatively easy to user, and integration capabilities with other biometrics are the advantages of hand geometry. Acquisition of hand geometry does not require expensive device and unlike fingerprints, low quality of the skin do not impact to the hand geometry features. Hand geometry is suitable to be integrated with fingerprint and palmprint because these biometric are part of the hand so can be captured at the same time during acquisition phase. One of drawback of the hand geometry is not highly unique therefore the applications of hand geometry are limited to the verification system only.
The characteristic of hand geometry is based on geometric structure of hand shape such as: length and width of the fingers, size of the palm, distance between the knuckles, thickness, etc. Each finger is commonly taken one feature of each finger length and two or three measurement width of finger at the specific coordinate position. The researches in [1][2][3][4][5][6][7] used the technique to extract the hand geometry features. Measurement of width and length of fingers is not relatively easy task. To facilitate the measurement of length and width of each finger is used some of fixed points [5].
This paper demonstrates the use of the hand contours as a feature of hand geometry. The contour is extracted by chain code technique. To match of two chain code of hand is used dynamic time warping distance (DTW). The distance was chosen since the hand shape chain code of each user has tends to unequal length.
2.
METHODOLOGY
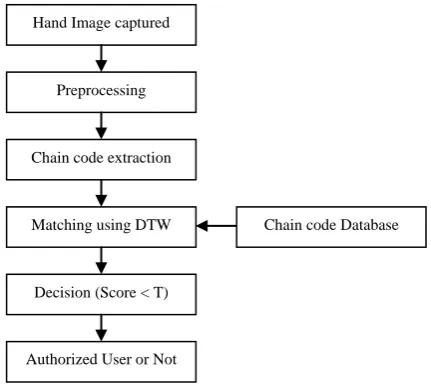
[image:1.595.320.536.263.458.2]Overview diagram of the proposed hand geometry verification system in this research is shown in Figure 1.
Figure 1. Overview diagram of hand geometry verification
2.1
Hand Image Acquisition
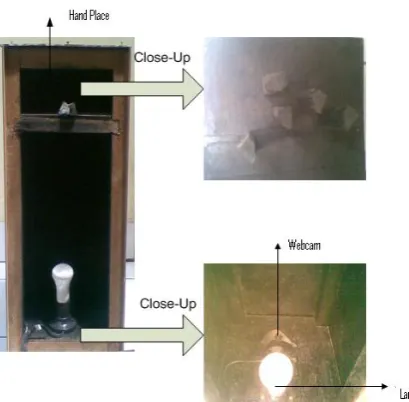
This research has developed a hand image acquisition device as shown in figure 2. Component of the device consists of camera, hand pad, lamp and the box to enclose the components. The device used web camera (webcam) with resolution 320 x 240 pixel due to get the hand geometry feature does not need the high resolution camera, so the device has become very cheap. The webcam is connected to the computer by using USB port. The Hand pad has a black background to make significance different with hand object and also consist of some pegs that are placed at specific position. The pegs are useful to control the hand oriented, translation, and stretching and also to ensure that
Chain code Database Hand Image captured
Preprocessing
Chain code extraction
Matching using DTW
Decision (Score < T)
Authorized User or Not
Figure 2. Hand image acquisition device
Figure 3. Software to capture the hand image
the hand fingers are not touching each other. The lamp serves as a light source to make a stable lighting in acquisition process.
Each user was requested to put his/her left hand on the hand pad and a software that has been installed on computer will be captured the hand image from the device (see Figure 3).
2.2
Preprocessing
The preprocessing aims to prepare hand images to be more easily processed on the feature extraction phase. There are four main processes in preprocessing stage are gray scaling, thresholding, median filtering and detecting of object boundary.
Gray scaling transform the color hand image that produced by device (webcam) to gray scale image.
Thresholding aims to convert the gray scale hand image to the binary image. The threshold value (T) is obtained automatically by Otsu method [8]. If pixel value of gray scale image less than T then the pixel value is converted to black (0), otherwise the pixel value is converted to white (1).
(a) (b)
[image:2.595.59.264.74.275.2]
(c) (d)
Figure 4. Preprocessing results, (a) gray scaled image, (b) binarized image, (c) median filtered image, (d)
boundarized image
Median filtering is applied to avoid the white pixels (not pixel object) outside of the hand object due to imperfections process of thresholding phase. Size of filter mask is 3 x 3 pixels.
Since the median filter applied on the binary image then pixel ordering process in median filter to determine the pixel median is not required any more. Determination of pixel median can be replaced by applying the following rule: If sum of all pixels in sliding window is greater than 4 then pixel is set to 1 otherwise the pixel is set to 0.
The rule would make the median filtering process will be much faster.
The last process in this stage is hand boundary detection. The result of this process is only pixels on edge or boundaries of hand object will be set to black otherwise will be set to white. The results of each preprocessing step are shown in Figure 4.
2.3
Hand Chain Code Extraction
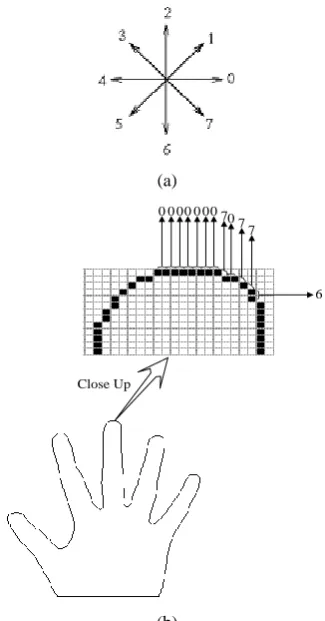
[image:2.595.62.273.315.456.2]Figure 5(b) illustrates how the chain code of hand shape is generated from boundary hand image. The boundary hand image is scanned from top left until the first boundary pixel is found. This pixel is noted as starting pixel. In general, the location of the pixel is around the tip of middle finger because the finger is generally longer than other fingers. The next boundary pixel is traced by clockwise movement and assigned a code to this pixel by following Figure 5(a). Figure 5(c) shows its chain code feature.
(a) Close Up 0 } } } } } } } }} } } }
[image:3.595.83.246.185.496.2]0 00 0 0070 7 7 6 (b) 0000007767666766666666666666666666676666667666666666766 6666666666666667666666666656666666666666667677001112122 2212212221212212121221212121121122112212121222212222122 2122212211010000070776676666566665666566655666566566665 6566566665666566566665666565665665656666656665666667770 0101110111111101011121101111011112111121121112100000776 6666665665566555655566565555655565555556555655565565656 5566665656666556666665666656666556666565666656655665665 5666565655656666444444444444444444444444444444444444444 4444444444444444444444444444433434333333333323334332323 3323332233233323333332232332333333334334334334434334334 3333232332332322211101001000000000007070777777770707077 7706707770700700070000001010101132222111121212212322222 2212222223223322233232322323223223222223323223223232223 2232223232223222322222222222121110007007777677676767676 6667766766776777676767676767677666667676667667667666767 7777700001122222123222222222322222222222222222222222221 22222212222222222222222222222222232212222222112101 (c)
Figure 5. Extraction of chain cod, (a) 8-connectivity chain code, (b) hand shape chain code extraction, (c) chain code
feature vector
In this research chain code as shown in Figure 5(c) is used as a hand shape feature without any modification or normalization process.
Two hand shape chain code of the same user have tends to unequal vector length and therefore dynamic time warping distance is used in this research to compute the similarity degree of each other.
2.4
Dynamic Time Warping Distance
Dynamic Time Warping (DTW) is a well known technique to measure the similarity between two given (time-dependant) sequences. One advantages of DTW is able to match of two feature vectors with unequal length. The feature vectors are warped to match each other and the DTW distance is measured based on optimal warping path of two feature vectors.The DTW distance of two vectors U and V with length m and n respectively, can be expressed as follows:
)
,
(
)
,
(
U
V
m
n
DTW
(1) ) 1 , ( ) 1 , 1 ( ) , 1 ( min ) , ( ) , ( j i j i j i v u d n
m base i j
(2)
0, (0, ) , ( ,0) )
0 , 0
(
(3)) ... 3 , 2 , 1 ; ... 3 , 2 , 1
(i m j n
The distance is commonly computed by creating the m by n distance matrix. The matrix contains element γ(i, j) that represent the cumulative distance of warping path from element (1,1) to (i, j) where (1≤ i ≤ m, 1 ≤ j ≤ n), therefore the matrix is called cumulative distance matrix.
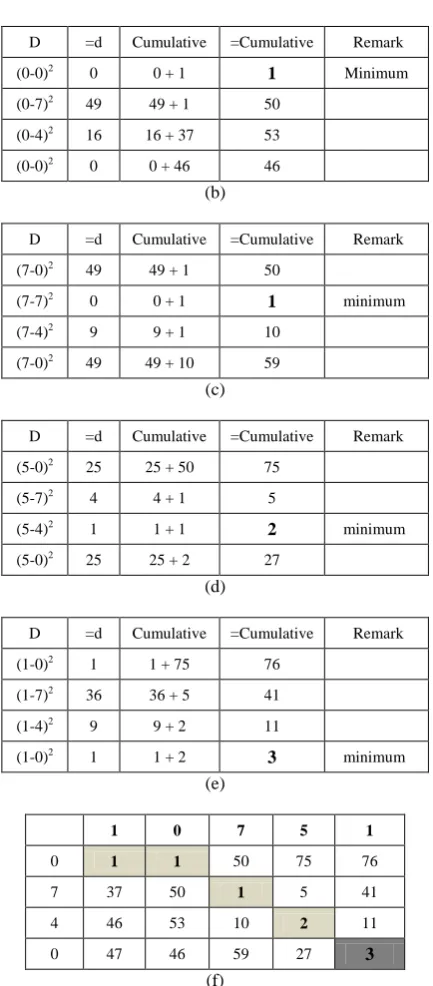
Lets see the example of two chain code vectors U = (0 7 4 0), and V = (1 0 7 5 1). The DTW distance of these vectors is 3. Figure 6(a) to 6(e) shows cumulative distance computation is based on the column 1 to column 5 of V respectively, while the warping path from U to V is shown by shaded area in Figure 6 (f).
A threshold value (T) is used to decide whether two chain codes come from the same person (genuine) or not (impostor). If the DTW score less than or equal with T then the tested chain code is noted as authorized, otherwise the chain code is noted as not authorized.
d =d Cumulative =Cumulative Remark
(1-0)2 1 1 + 0
1 Minimum
(1-7)2 36 36 + 1 37
(1-4)2 9 9 + 37 46
(1-0)2 1 1 + 46 47
[image:3.595.317.508.297.391.2] [image:3.595.322.537.620.707.2]D =d Cumulative =Cumulative Remark
(0-0)2 0 0 + 1
1 Minimum
(0-7)2 49 49 + 1 50
(0-4)2 16 16 + 37 53
(0-0)2 0 0 + 46 46
(b)
D =d Cumulative =Cumulative Remark
(7-0)2 49 49 + 1 50
(7-7)2 0 0 + 1
1 minimum
(7-4)2 9 9 + 1 10
(7-0)2 49 49 + 10 59
(c)
D =d Cumulative =Cumulative Remark
(5-0)2 25 25 + 50 75
(5-7)2 4 4 + 1 5
(5-4)2 1 1 + 1 2 minimum
(5-0)2 25 25 + 2 27
(d)
D =d Cumulative =Cumulative Remark
(1-0)2 1 1 + 75 76
(1-7)2 36 36 + 5 41
(1-4)2 9 9 + 2 11
(1-0)2 1 1 + 2
3 minimum
(e)
1 0 7 5 1
0 1 1 50 75 76
7 37 50 1 5 41
4 46 53 10 2 11
0 47 46 59 27 3
(f)
Figure 6. DTW distance computation of vector U = (0 7 4 0) and V=(1 0 7 5 1), (a), (b), (c), (d), (e) represents computation is based on column 1 to 5 of V respectively, (f) shaded area represents the warping path from U to V.
3.
EXPERIMENTS AND RESULTS
The hand shape chain code feature and DTW distance have been applied for hand geometry verification system. The total number of hand images used to test the system performance is 900 images that are generated from 12 samples from each of the 75 users randomly selected. To know the impact of increasing the database size to the system performance then these experiments create three type of database size is 25, 50 and 75 users with various numbers of reference samples in template databases and various numbers of query image samples in testing database.
The performance of the verification system is obtained by matching each of testing hand images with all of the reference
hand images in the database. A matching is noted as a correct matching if the two hand images are from the same hand and as incorrect if otherwise. This paper used FMR (false match rate), FNMR (false non match rate), system accuracy, and receiver operation curve (ROC) as indicators of the performance system.
A threshold value is used to determine the FNMR and FMR. This experiment tries various threshold values and each threshold value will be produces a pair of FNMR and FMR. A pair of FNMR and FMR is selected as system performance when the total of FNMR + FMR is smallest then the others and its threshold will be chosen as a threshold value of system.
FNMR, FMR and success rate are computed as:
% 100 x access genuine of
total
rate genuine reject
of total
FNMR (4)
% 100 x access impostor of
total
rate impostor accpet
of total
FMR (5)
) (
%
100 FNMR FMR
Rate
Success (6)
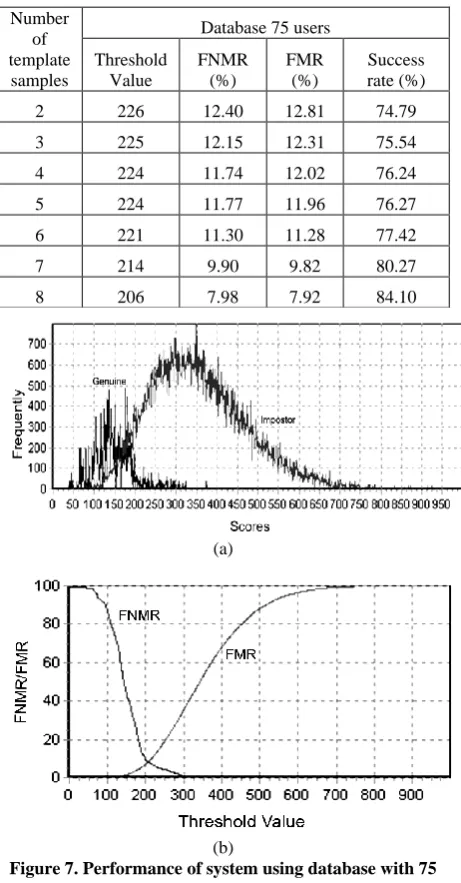
Table 1, Table 2 and Table 3 shows system performance by using database size 25, 50, and 75 users respectively with varying in number of reference samples (2 to 8 samples) in database. When the experiment use 2 samples as reference this mean 10 of 12 remain sample images are used as test image. The tables show increasing the number of training sample in database also tends to increase the success rate of the system. The best success rate achieved is about 84% when using eight training samples in database for whole database size (see the last row of Table 1, 2 and 3). The system performance in database with 25 users is FNMR= 7.63, FMR=7.71, and success rate = 84.67, database with 50 users is FNRM=7.88, FMR=7.99, and success rate = 84.13, while database with 75 users is FNRM=7.98, FMR=7.92, and success rate = 84.10.
Figure 7 shows graphics of genuine and impostor score distribution and receiver operating curve by using database with 75 users. Overlapping area in Figure 7(a) will be effect the system performance. The larger overlapping area, the higher the error rate system (decrease the system performance) and vice versa.
Table 1. Performance of system by using template database contains 25 users
Number of template
samples
Database 25 users Threshold
Value
FNMR (%)
FMR (%)
Success rate (%)
2 218 13.40 13.25 73.35
3 211 11.11 11.38 77.51
4 207 10.84 10.78 78.37
5 207 10.97 10.90 78.12
6 204 10.00 10.35 79.65
7 203 10.17 9.98 79.85
[image:4.595.59.276.59.553.2]Table 2. Performance of system by using template database contains 50 users
Number of template
samples
Database 50 users Threshold
Value
FNMR (%)
FMR (%)
Success rate (%)
2 221 12.40 12.43 75.17
3 218 12.00 11.66 76.34
4 216 11.17 11.28 77.54
5 216 11.49 11.38 77.13
6 213 10.67 10.86 78.47
7 207 9.66 9.59 80.75
8 199 7.88 7.99 84.13
Table 3. Performance of system by using template database contains 75 users
Number of template
samples
Database 75 users Threshold
Value
FNMR (%)
FMR (%)
Success rate (%)
2 226 12.40 12.81 74.79
3 225 12.15 12.31 75.54
4 224 11.74 12.02 76.24
5 224 11.77 11.96 76.27
6 221 11.30 11.28 77.42
7 214 9.90 9.82 80.27
8 206 7.98 7.92 84.10
(a)
[image:5.595.53.283.100.256.2](b)
Figure 7. Performance of system using database with 75 users, (a) graphics of genuine and impostor score
distribution, (b) receiver operating curve (ROC)
Figure 8. The impact of increasing database size to the success rate of system
Figure 7(b) show the ROC of system. The cross point on the figure represents the cross error rate (CER) or equal error rate (EER) where FNMR ≈ FMR. The EER system is 7.92% with appropriate T is 206.
Figure 8 provides good information that the performance of system is relatively stable despite the size of database is increased from 25 to 75 users.
This research also noted that the average time that is needed to match two chain code vectors is about 0.028 second on notebook Intel Dual Core processor with 1 GB RAM.
4.
CONCLUSION
This paper has successfully demonstrated the use of chain code and dynamic time wrapping method for hand geometry verification. The experiment results show that the proposed method achieved success rate about 84% with FNMR = 7.98% and FMR =7.92%.
For further work in order to improve the system performance, we will combine with envelope feature [8] and other hand geometry features such as: perimeter and area of hand geometry that directly obtained from chain code [9] and also apply the normalization [10] and modification [11] techniques on the chain code.
5.
ACKNOWLEDGMENTS
Our thank goes to the Udayana University who has helped organize this research.
6.
REFERENCES
[1] Jain A.K., Ross A., and Pankanti S., A Prototype Hand Geometry-based Verification System, IEEE Trans. On Circuits and Systems for Video Technology, Vol. 4, No. 1, 1999.
[2] Ajay Kumar, David Zhang, Personal Recognition using Hand Shape and Texture, IEEE Transaction on Image Processing, 2006, Vol. 15, No. 8.
[3] Ajay Kumar, David Chang, Helen CS., Anil K. Jain, Personal Authentication using Hand Images, Pattern Recognition Letter 27, 2006, pp. 1478-1486.
[image:5.595.55.286.292.734.2]and Video-Based Biometric Authentication (AVBPA), Guildford, UK, June 9-11, pp. 668-675.
[5] Setyawan, I.B., 2004, Sistem Verifikasi Telapak Tangan dan Geometri Tangan Dengan Metode Overlapping Block, Thesis, Electrical Engineering, Udayana University, Bali, Indonesia.
[6] Alexandra L.N.Wong., Pengcheng Shi, 2002, Peg-Free Hand Geometry Recognition Using Hierarchical Geometry and Shape Matching, IAPR Workshop on Machine Vision Application, Nara, Japan.
[7] Tee Connie Andrew Teoh Beng Jin Michael Goh Kah Ong and David Ngo Chek Ling., 2003, A single-sensor hand geometry and palmprint verification system, In Proceedings of the 2003 ACM SIGMM workshop on
Biometrics Methods and Applications (WBMA'03), New York, NY, USA, ACM Press, pp 100-106
[8] Darma Putra, IKG., 2009, Biometrics System, Andi Publisher, Yogyakarta, Indonesia
[9] Darma Putra, IKG., 2010, Digital Image Processing, Andi Publisher, Yogyakarta, Indonesia
[10] Rajput G., Mali SM., Marathi Handwritten Numeral Recognition Using Fourier Descriptor and Normalized Chain Code, IJCA special issue on Recent Trend in Image Processing and Pattern Recognition, 2010. [11] Amasyali MF., Nilgun E., Hakan H., Filiz Koyuncu,