An Efficient behavioural analysis of Graph Clustering
Algorithms via Random Graphs
Mohit Kumar
Nitin Yadav
Vaibhav Pratap
Avdhesh Kumar
Department of Computer Science and Engineering,
Invertis University Bareilly, Uttar Pradesh, India.
ABSTRACT
The proposed last research entitled “An Effective Data Comparison of Graph Clustering Algorithms via Random Graphs” compared two mostly used algorithms for graph clustering i.e. restricted neighborhood search and markov clustering algorithms via random graph generators i.e. Erdos-Renyi and power law graphs. This paper is an extension to our last research work. In this we have examined an efficient behavioral analysis of both algorithms via random graphs. This paper mainly shows the behavior of both the algorithms under certain parameters which we have used. Previously in case of Erdos-renyii we used graphs with 1000 nodes with variable edge densities, while in this paper we have modified the number of nodes from 1000 to 15000 with variable edge densities ranging from 0.1 to 0.5 while in case of Power-law we have variable number of nodes ranging from 1000 to 15000. This paper also depicts as to which algorithm works more efficient, whether in case of Erdos-Renyi or Power-Law graphs. Our last research showed that in case of Erdos-Renyi graph run time of RNSC algorithm is better as compared to MCL for graph having nodes less than 2000 but as nodes keep on increasing the run time of RNSC increases drastically while run time of MCL doesn’t increase, so MCL is better in case of Erdos-Renyi graph having more than 2000 nodes and having high connectivity between the nodes [12] while in this paper it is clearly visible that both RNSC and MCL works better in case of Power-Law graph as compared to Erdos-Renyi graph which clearly states that both algorithm shows some similar characteristics in graphs where edge connectedness is not very high for all vertices. Furthermore we studied the behaviour of RNSC in case of Erdos-Renyi individually also.
General Terms
Graph Clustering, Data mining et. al.
Keywords
discussed in previous segment. This work is not basically a comparison but it is more of a behaviour analysis of both the algorithms via more modified graphs. We have implemented this work on gcc compiler version 4.6 (which can be obtained by running gcc -version in terminal) on Ubuntu operating system and all the graphs used in this analysis were unweighted and undirected.
2.
PARAMETERS USED FOR
COMPARISON
The parameters we considered in this research work are all the same as what we used previously i.e. Edge Density [12],Run time [12], Graph Size [12] and Cluster Size [12] but we excluded Singleton Cluster from our analysis. The theory regarding all the parameters used in our analysis has already been discussed in the previous paper.
3.
RESULTS AND DISCUSSIONS
3.1
Results for RNSC
This section contains all the results and discussions regarding behaviour of RNSC in case of Erdos-Renyi and Power-Law graphs.
3.1.1
Number of Nodes vs RUN TIME in case of
Erdos-Renyi only
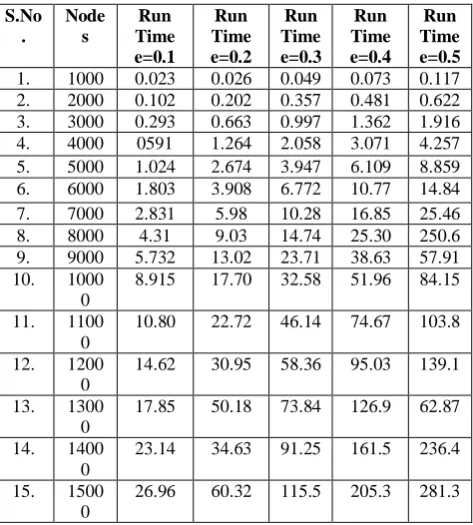
Table 1: Dataset for RNSC in case of Erdos-Renyi
[image:2.595.52.289.91.354.2]
Discussion: Fig 1 shows a line graph representing Run Time versus graph size for a graph of nodes ranging from 1000 to 15000 and edge densities ranging from 0.1 to 0.5. This graph clearly states the behaviour of RNSC. We have represented the run time of RNSC for graphs having variable nodes and edge densities where the symbol (e) in the graph denotes the edge density for Erdos-Renyi graph. It is clearly visible from the graph that as the number of nodes and edge density is increased the run time of all the graphs also increased but in a linearly fashion but in case of graph (e=0.5) i.e. highest edge density the run time increased drastically and then came down as well and vice versa. This kind of behaviour we observed in our last work too. While the other graphs increased linearly with nodes. There was a sudden increase and fall in the run time of graph (e=0.2). This comparison of run time clearly shows that run-time of the RNSC increases sharply at the edge density of 25-50% i.e. half the edge pairs are connected. The number of moves is very high because the cost keeps fluctuating in this range due to diversification steps [12]. As the Edge-Density crosses 50%, the edge-connectivity of the graph increases and the diversification step has low effect on such high Edge-Density. So the run-time decreases, but still increases linearly as the Edge-Density increases [12].Thus run time of RNSC gets highly affected due to increase in edge density and thus performance is poor against highly connected graphs.
Fig 1: A line graph representing Number of Nodes vs RUN TIME for Erdos-Renyi graph with varying nodes and edge
densities.
3.1.2
Number of Nodes vs Cluster Size in case of
Erdos-Renyi only
The table contains computed values of cluster size for Erdos-Renyi graph with varying nodes and edge densities.
0
50
100
150
200
250
300
R
U
N
T
IME
Number of Nodes(N)
NUMBER OF NODES vs RUN
TIME
run time(e=0.1) run time(e=0.2) run time(e=0.3) run time(e=0.4) run time(e=0.5) S.No
.
Node s
Run Time e=0.1
Run Time e=0.2
Run Time e=0.3
Run Time e=0.4
Run Time e=0.5 1. 1000 0.023 0.026 0.049 0.073 0.117 2. 2000 0.102 0.202 0.357 0.481 0.622 3. 3000 0.293 0.663 0.997 1.362 1.916 4. 4000 0591 1.264 2.058 3.071 4.257 5. 5000 1.024 2.674 3.947 6.109 8.859 6. 6000 1.803 3.908 6.772 10.77 14.84 7. 7000 2.831 5.98 10.28 16.85 25.46 8. 8000 4.31 9.03 14.74 25.30 250.6 9. 9000 5.732 13.02 23.71 38.63 57.91 10. 1000
0
8.915 17.70 32.58 51.96 84.15
11. 1100 0
10.80 22.72 46.14 74.67 103.8
12. 1200 0
14.62 30.95 58.36 95.03 139.1
13. 1300 0
17.85 50.18 73.84 126.9 62.87
14. 1400 0
23.14 34.63 91.25 161.5 236.4
15. 1500 0
Table 2. Dataset for RNSC in case of Erdos-Renyi
[image:3.595.50.274.92.286.2]
Discussion: Fig 2 shows a line graph representing cluster size versus graph size for a graph of nodes ranging from 1000 to 15000 and edge densities ranging from 0.1 to 0.5. In previous paper Figure 5 showed a line graph representing Graph Size versus Cluster Size, where we analysed that as the number of nodes increased in the graph the number of clusters formed increase linearly, with the condition that the graph follows the same attribute like Edge-Density and connectivity. We saw that the number of clusters formed in the RNSC clustering is much higher than the MCL clustering for power-law graphs. From the graph we can easily analyse that cluster size also depends on the size of the graph and its edge density. The cluster size increased linearly with the graph size but as edge density is increased or the graph becomes more connected there is a sudden rise in cluster size. In case for graph (e=0.5) we see the same behaviour as the previous one i.e. cluster size increases drastically and then falls. While RNSC has a special feature of limiting the number of clusters which other algorithms do not have. We can limit the number of clusters in our case too. In the next comparison we will be comparing the behaviour of RNSC in case of Erdos-Renyi and Power-Law both.
Fig 2: A line graph representing Number of Nodes vs Cluster Size for Erdos-Renyi graph with varying nodes
and edge densities.
3.1.3
Number of Nodes vs Cluster Size in case of
Erdos-Renyi
and Power-Law
0
1000
2000
3000
4000
5000
6000
7000
N
u
m
b
e
r
o
f
C
lu
s
te
r
Number of Nodes(N)
NUMBER OF NODES vs CLUSTER
SIZE
Cluster Size (e=0.1) Cluster Size (e=0.2)
Cluster Size (e=0.3) Cluster Size (e=0.4)
Cluster Size (e=0.5) S.No
.
Nodes 0.1 0.2 0.3 0.4 0.5
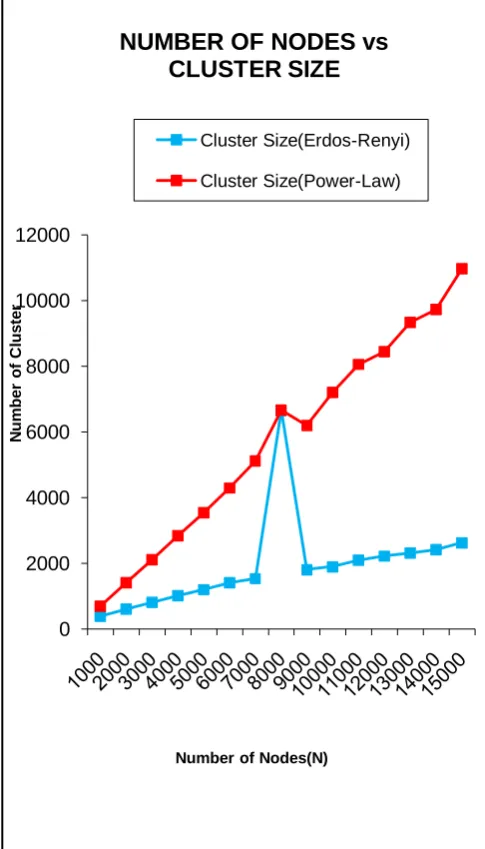
Table 3. Dataset for RNSC in case of Erdos-Renyi & Power-Law
S.No Size of Graph
Cluster Size Erdos-Renyi(e=0.1)
Cluster Size Power-Law(alpha=2.5)
1. 1000 391 701
2. 2000 607 1414
3. 3000 811 2115
4. 4000 1021 2843
5. 5000 1204 3545
6. 6000 1409 4298
7. 7000 1538 5125
8. 8000 6660 6664
9. 9000 1813 6204
10. 10000 1902 7203
11. 11000 2097 8061
12. 12000 2225 8448
13. 13000 2315 9341
14. 14000 2423 9737
15. 15000 2629 10972
Discussion: Fig 3 shows a line graph representing Number of Nodes versus Cluster Size for RNSC in case of both Erdos-Renyi and Power-Law graphs. The following graph depicts the behaviour of RNSC in case of both types of graphs i.e. Erdos-Renyi and Power-Law. The blue line represents cluster size for Erdos-Renyi while Red line represents cluster size for Power-Law. In case of Erdos-Renyi we have kept same edge density (e=0.1) for all graphs while in case of Power-Law the value of alpha is fixed to 2.5 for all the graphs. The cluster size for RNSC for Erdos-Renyi is same as what we discussed earlier i.e. Linear rise in the beginning and then sudden rise and fall in between 8000-10000 nodes while in case of Power-Law the cluster size increased linearly throughout its course. Another reason may be the large number of singleton clusters. Singleton clusters result due to the fact that the cost of the cluster decreases sometime with singleton cluster for sparsely connected graphs like power-law graphs [12]. Thus behaviour of RNSC is better for Power-Law graphs in the course of cluster formation.
Fig 3: A line graph representing Number of Nodes vs Cluster Size in case of Erdos-Renyi & Power-Law.
3.1.4
Number of Nodes vs Run Time in case of
Erdos-Renyi
and Power-Law graphs
The table contains computed values of run time in case of Erdos-Renyi & Power-Law graphs with varying graph size.
0
2000
4000
6000
8000
10000
12000
N
u
m
b
e
r
o
f
C
lu
s
te
r
Number of Nodes(N)
NUMBER OF NODES vs
CLUSTER SIZE
Cluster Size(Erdos-Renyi)
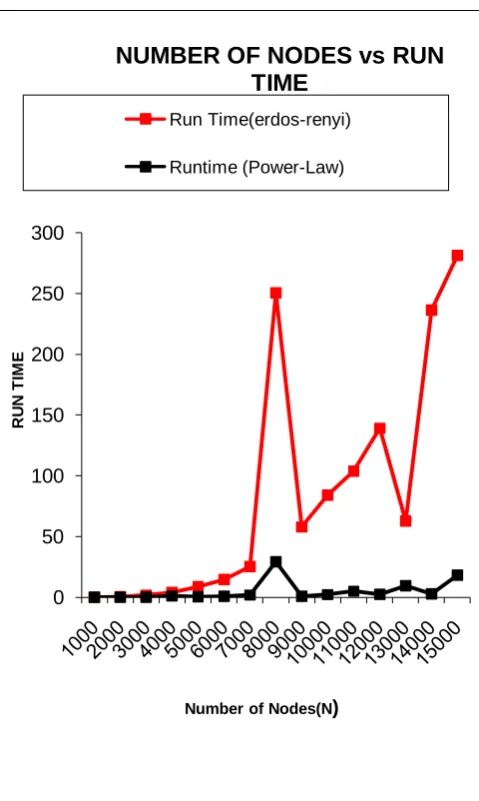
Table 4. Dataset for RNSC in case of Erdos-Renyi & Power-Law
S.No Size of Graph
Runtime(Erdos-Renyi)
Runtime (Power-Law)
1. 1000 0.117 0.053
2. 2000 0.622 0.12
3. 3000 1.916 0.232
4. 4000 4.257 1.085
5. 5000 8.859 0.542
6. 6000 14.84 0.797
7. 7000 25.46 1.891
8. 8000 250.66 29.478
9. 9000 57.91 0.981
10. 10000 84.151 2.33
11. 11000 103.893 5.036
12. 12000 139.16 2.427
13. 13000 62.873 9.53
14. 14000 236.4 2.91
15. 15000 281.332 18.425
[image:5.595.49.284.97.460.2]Discussion: Fig 4 shows a line graph representing Number of Nodes versus run time for Erdos-Renyi and Power-Law graphs. In case of Erdos-Renyi the run time keeps on increasing exponentially because the run-time of the algorithm is inversely proportional to Tabu length i.e. the run time increases with the decrease in tabu length. Therefore for lesser run time large tabu length should be used. As the tabu-length increases the number of moves which cannot be retraced increases, so there are fewer choices to make for the next move, thus the run-time decreases [13]. If the graph size is less then the run-time will be smaller. So as we decrease the maximum number of cluster which can be done in case of RNSC the run-time increases. While in case of Power-Law graph the run time stays a lot low.
Fig 4: A LINE graph representing Graph Size vs Run Time in case of Erdos-Renyi & Power-Law
3.2
Results for MCL Graph
This section contains all the results and discussions regarding behaviour of MCL in case of Erdos-Renyi and Power-Law graphs.
3.2.1
Number of Nodes vs Cluster Size
The table contains computed values of Cluster Size and Number of Nodes in case of Erdos-Renyi & Power-Law graphs.
0
50
100
150
200
250
300
R
U
N
T
IM
E
Number of Nodes(N
)
NUMBER OF NODES vs RUN
TIME
Run Time(erdos-renyi)
Table 5. Dataset for MCL in case of Erdos-Renyi & Power-Law
S. No.
Numbe r of Nodes
Cluster Size (Erdos-Renyi(e=0.1)
Cluster Size Power-Law(α=2.5)
1. 1000 248 16
2. 2000
677 19
3. 3000
1297 15
4. 4000
2174 18
5. 5000 3220 14
Discussion: Figure 5 show a line graph representing graph size versus cluster size for both Erdos-Renyi and Power-Law graphs. More clusters can be seen in case of Erdos–Renyi as compared to Power-Law graph.
3.2.2
Number of Nodes vs Run Time
[image:6.595.54.281.97.301.2]The table contains computed values of Run Time and Number of Nodes in case of Erdos-Renyi & Power-Law.
Table 6. Dataset for MCL in case of Erdos-Renyi & Power-Law
S. No.
Number of Nodes
Run Time Erdos-Renyi(e=0.1)
Run Time Power-Law(α=2.5)
1. 1000 127.377 3.82
2. 2000
2592.35 11.928
3. 3000
3254.026 12.844
4. 4000 16583.961 12.898
5. 5000 9617.616 14.806
Discussion: Fig 6 shows a line graph representing run time versus graph size for both Erdos-Renyi and Power-Law graphs. The pruning feature of MCL helps it to sustain a better performance than RNSC in case of run time, but performance of MCL is quite poor in case of strongly connected graphs. The graph clearly shows the behaviour of MCL in case of both graphs.
0
500
1000
1500
2000
2500
3000
3500
N
u
m
b
e
r
o
f
C
lu
s
te
r
Number of Nodes(N
)
NUMBER OF NODES vs
CLUSTER SIZE
Cluster Size[Erdos-Renyi(e=0.1)]
Cluster Size[Power-Law(α=2.5)]
0
2000
4000
6000
8000
10000
12000
14000
16000
18000
R
u
n
T
im
e
Number of Nodes(N
)
NUMBER OF NODES vs RUN
TIME
[image:6.595.318.539.133.297.2] [image:6.595.55.283.378.717.2] [image:6.595.316.541.407.706.2]4.
CONCLUSIONS AND FUTURE
WORK
On analyzing the whole scenario we came to the result that both algorithms have some advantages and disadvantages depending on what state and situation they are being applied. Run Time of MCL was better in case of Power-Law graph while Cluster Size was more in case of Erdos-Renyi, on the other hand RNSC showed better results mainly in case of Power-law graph. So the future work may be integrating the best parts of both the algorithms so that the performance may be enhanced. In our integration we may use Genetic algorithm so that heuristic approach of RNSC may be minimized too.
5.
ACKNOWLEDGMENTS
The authors are very thankful to their respected honorable Dr. Umesh Gautam Chancellor, Dr. Y.D.S Arya, Pro Vice Chancellor, Invertis University, Bareilly, Mr. Zubair Khan H.O.D Computer Science Department and Mr. Ravi Shankar Shukla H.O.D Information Technology Department, for providing excellent computation facilities in the University campus. We are very much thankful to all the technical and non-technical staffs of the Invertis University for their assistance and co-operation. Lastly we thank all of our students who directly or indirectly supported us.
6.
REFERENCES
[1] Sauta Elisa Schaeffer, “Survey Graph clustering,” Elsevier Computer Science Review, vol. I, pp. 27-64, 2007.
[2] P. Erdos and A. Renyi. On the evolution of random graphs. Publ. Math. Inst. Hungar. Acad. Sci., 5:17-61, 1960.
[3] A.-L. Barabasi and R. Albert. Emergence of scaling in random networks. Science 286(5439) (1999) 509-512.
[4] A.-L. Barabasi and Z. N. Oltvai. Network biology: Understanding the cell’s functional organization. Nature Reviews Genetics, 5:101-113, 2004.
[5] A.D. King, Graph clustering with restricted neighborhoods search. Master’s Thesis, University of Toronto, 2004.
[6] X. Hu and J. Han. Discovering clusters from large scale-free network graph. In ACM SIG KDD Second Workshop on Fractals, Power Laws and Other Next Generation Data Mining Tools, August 2003.
[7] S. Enright, A.j.van Dongen, C.A. Ouzounis, An efficient algorithm for large-scale detection of protein families, Nucleic Acids Res. 30(7) (2002) 1575-1584.
[8] S. M. Van Dongen. Graph Clustering by Flow Simulation. PhD thesis, University of Utrecht, May 2002. [Online].Available: http://www.svdthesis.pdf [9] Scaled-Free graph generator code. [Online].Available:
http://www-rp.lip6.fr/~latapy/FV/
[10]King, A. D., Przulj, N., and Jurisica, I. (2004) Bioinformatics 20, 3013-20.
[11]King, A. D. (2005), McGill University, Montreal. [12]Reena Mishra, Mohit Kumar, An Effective Data
Comparison of Graph Clustering Algorithms via Random Graphs, International Journal of Computer Applications Volume 1 No.1, May 2011.