Environmental Scrutinizing System based on Soft
Computing Technique
Dinesh Kumar Saini
Faculty of Computing and IT, Sohar University, Oman
Faculty of Engineering and IT, University of Queensland, Australia
Jabar H Yousif
Faculty of Computing and IT, Sohar University, Oman
ABSTRACT
Artificial intelligent techniques are very much needed to design the environmental monitoring systems. These systems must be smart enough so that all the decisions taken by the system must be accurate. Soft Computing (SC) it is a set of computational methods that attempt to determine satisfactory approximate solutions to find a model for real-world problems. It based on various techniques such as Artificial Neural Networks, Fuzzy Logic and Genetic Algorithms. The aim of this paper is to implement a soft computing technique which is artificial neural network based on Self-Organizing Feature Map (SOFM). SOFM model for monitoring and collecting of the data are real-time and static datasets acquired through pollution monitoring sensors and stations. In the environmental monitoring systems the ultimate requirement is to establish controls for the sensor based data acquisition systems and need interactive and dynamic reporting services. SOFM techniques are used for data analysis and processing. The processed data is used for control system which even feeds to the alarming systems.
General Terms
Soft Computing, Environment, Software System
Keywords
Environmental modeling, EMS, air pollution, environmental sensors, Self-Organizing feature Map
1. INTRODUCTION
There will be a positive impact on the standard of living through improving the smart environmental management and monitoring services. Pollutants are increasing in the environment and monitoring the pollutants and bringing into control is the major challenge. Information technology and computing has a major role in the current situation. Moreover, this research assisted in building a collaborative framework that is able to connect the proposed framework to international environment management systems, in order to gain experiences from high profile specialist environmentalists around the world.
Gaining such knowledge and experience from specialists in the field has cost effective implications for people. Moreover, this paper focused on building intellectual capacity in the fields of environmental informatics; in this field has a pronounced shortage at the present time. The proposed system and framework is a generic model that manages monitors and provide alerts on the emissions of the air pollutants, which can be applied anywhere in the world and
any region, and is able to manipulate the data that is received from any type of sources [3].
A pilot project for monitoring the air pollution at Sohar Industrial Zone is developed in collaboration with the Sohar Environmental Unit (SEU), a separate agency promoted by Ministries which are responsible for all environmental monitoring and management within the entire industrial zone.
Sensor technology and Nano technology with information technology is building the solid base for the environmental informatics.
The project offers a complete decision-making system that is able to analyze the gathering data from remote sensors. In addition, building a national benchmarking system is one of the outcomes of this research. The benchmarking system will be used to produce based on MECA’s policies and regulations.
The benchmarking system takes into consideration the nature of the industry. The proposed system and framework suggest a generic model that is able to manage, monitor and provide alerts on the emissions of the air pollutants, which can be applied anywhere in the region where the source of pollutants are there. As a part of this project; a case study of the feasibility of using this framework is conducted, to focus on establishing a smart monitoring system for air pollution. This is done in collaboration with SEU and University of Queensland, Australia. Moreover, as part of this research, awareness among local community will be developed towards environment pollution, and to take seriously their responsibilities towards the environment. This will be done through conducting environmental workshops and outreach sessions [18].
Technology transfer is another focus of the project through adopting the latest technologies in environment monitoring systems. Furthermore, in this paper an attempt is made to merge knowledge management techniques with e-environment systems applications. This has been suggested in order to generate a generic model for environmental monitoring system to monitor the emissions of air pollutants, especially in the industrial regions [2].
2.
POTENTIAL
BENEFITS
FROM
ENVIRONMENTAL MONITORING
Materials savings from more complete processing, substitution, re-use or recycling of product inputs
Less downtime through more careful monitoring and maintenance
Reduced material storage and handling costs
Savings from safer workplace conditions
Reduction of costs associated with emissions, discharges, waste handling, transport & disposal
Improvements in the product as a result of process changes
Higher quality, more consistent products
Lower product costs (e.g. from material substitution)
More efficient resource use
Higher product re-sale and scrap value
3.
CYBER
INFRASTRUCTURE
FRAMEWORKS
Multi-Agent Systems [9] is used in smart monitoring simulators and intelligent systems to perform several tasks like
Figure1. Cyber Framework
data filtering and alarming systems. Agents have to react to events, define strategies, interact, and participate in the activities of the system as shown in Figure 1. Internet is also busting use for such agent based systems.
4. DATA QUALITY
Data quality and accuracy remain a major challenge for researchers and organizations. Over time techniques and procedures have evolved designed to make sure data quality meets certain standards [10].
Data and information are very dynamic which present the following issues, like data gathering, data delivery, destruction due to inappropriate pre-processing, data integration [16].
4.1 Poor Data Quality Impact
Poor data quality management in environmental data can lead to the following which includes Lowered end user satisfaction of an EMS. Poor data quality increases cost due to the fact that time and money will be spent in detecting and correcting errors rather than performing critical operational tasks. It is a fact that the decision made is no better than the data it was based on. Therefore, poor data quality will lead to poor decision making which lead to incorrect estimate and predictions. E-environment is so sensitive that we should not tolerate any compromise when it comes to decision making or we will endanger people and planet earth. More difficult to set strategy and execute it. Environmental strategic decision requires data gathering from various data sources with some uncertain quality. This makes it harder to develop a sound strategic decision. Executing the strategy becomes difficult as inaccurate results become evident [6, 7].
4.2
Cleansing Of Environmental Data
Current data collected by SEU are not hosted in centralized warehouses rather it’s saved in Excel spreadsheets. This presents an issue with data cleansing and integration between distributed sensors. Data cleansing is required when integrating data from distributed sensors. In order to clean the data they need to be integrated using the appropriate methods. Here an attempt is made to execute a method for integrating multiple data sources from different environmental sensors
4.3
Multi-Source Problems
Data collected from different environmental sensors can present a large data cleansing issue when integrated. This is due to the fact that data quality problems will be inherited from the source databases Environmental data sources typically developed deployed and maintained independently to serve specific needs [13]. By looking at Sohar industrial region environmental data we can observe the multi-source cleansing problem.
One major issue when cleaning data from multiple sources is how to identify overlapping records. Any duplicate information should be purged out and complement information should be consolidated and merged in order to have a consistent and accurate reflection for the real world entity [17]. AS example if two records were found duplicate we are going to merge them and add the sensor Id from each record. This act as a historical reference in case we need to infer some information in the future [1, 15]
Some records has different date format, apply the same date format for the date column mm/dd/yyyy as follows:
If we have the following:
Sensor1 (Date= 29/02/08, time =0:00)
Sensor 2(Date=02/29/08 time=24:00)
5
NEURAL NETWORKS MODELING
Artificial Neural Networks (ANN) is considered as a new paradigm in computing, embodying a view of computation inspired by the brain biology [11]. Neural networks are a powerful tool capable of learning and dissemination of data which is the way to model the data, both linear and nonlinear [12]. Neural networks have certain advantages have stimulated researchers to the adoption of neural networks as a tool to calculate the variables in the systems and issues that do not have available the large amount of data or that require unusual methods of calculation. The main characteristics are Massive parallelism, Uniformity, ability of learning, ability of Training, ability of generalization, and adaptivity [11]. Most applications of neural networks realize into prediction, classification, data association, data conceptualization and data filtering [4].
The neuron is the processing unit which takes number of values as inputs and producing an individual output. The neurons are of three types input, hidden and output layers. The input layer is does not consist of a transfer function [11]. SOM normally is used in unsupervised learning approaches using of the concept of feature maps. The input of high-dimensional data can be mapped on a two-high-dimensional map called the feature map. Each node in the SOM represents some point in the input space.
The main concept in the SOM learning process is that the winner nodes and its neighborhood are changed closer in the input data space. The Hebbian rule is used in modification of weights. The adjustment of the activity has an effect on the neighboring neurons; therefore, if we adjust a neuron, we would also be adjusting its neighbors. The input in the OSM can be described as
Y = [y1, y2, y3, . . ., yn] T
In which y1,y2,y3,. . .,yn represents the selected features, and the synaptic weighting vector for jth neuron is denoted by
Wj [wj1,wj2,wj3,. . .,wjn] T ,j = 1,2,. . .,m. Where m is the
number of the neuron.
[image:3.595.318.549.120.307.2]The distance between the feature vector and weighting vector can be expressed as
dj = ||Y-Wj|| , J = 1,2,. . .,m.
The winning neuron q is the minimization of expression and, and can be expressed as
dq = minAj(dj)
The feature map is considered as the most important concept introduced by SOM networks. The training of SOM involves mapping up of the highly dimensional input space into two-dimensional feature maps. The Mapping of data refers to giving a 2-dimensional demonstration with a finite size to the input space.
An illustration of Self-Organizing Feature Map Neural Network is depicted in Figure 2.
The architecture of neural network is the organization of neurons into layers and the connection pattern between them, it demonstrated as follows: ‘R-S1-S2-S3’, which means the input layer consists of R values. And it has two hidden layers referred as S1 and S2. The output layer is referred as S3 neurons. The transfer function of each neuron must define for all layers in the network. Besides, the weight values for each neuron should also define. The training process is the
adjustment of weights of the NN to ‘match’ set of samples (training set). For the sake of network generalization, the ‘match’ of training sets enables us to infer from unseen samples.
Figure 2: Self-Organizing Feature Map Architecture
Before using the neural network, we need to encode the input text into a suitable form. The data set must divide into three categories; training data sets cross validation data sets and test data sets. The Cross validation computes the error in a test data sets at the same time that the network is being trained with the training set.
To develop the SOM model for environment monitoring system, a training process was first conducted to determine the model parameters. This process used the input vectors of the frequency domain training feature to modify the weighting vector
And
createafinalweightingvectorforeachwinningneuronforthecorres pondingfeaturevector
6
EXPERIMENTS AND RESULTS
The experiments covered five gases CO,CH4, H2S, SO2 and O3, the input file is encoded into a suitable form and then divided it into three categories; training data sets cross validation data sets and test data sets .The Cross validation computes the error in a test data sets at the same time that the network is being trained with the training set.
6.1. Implementation of the Proposed
Systems
The experiments are implementing using the NeuroSolution packages to design the SOMF which has 25 PEs for input and 25 PEs for output layers respectively. The SOMF Network has only one hidden layer. Basically, the size of the Kohonen layer must be maintained as small as possible because the SOFM trains slowly. The Starting and Final Radius are 2, 0 respectively. The data will map on 5 by 5 dimensional feature maps. Every PE has an adaptive parameter which it must change according to some pre-specified procedure. The Back propagation learning technique is used as a learning approach in neural network. The weights are changed based on their previous value and a correction term.
The step size is 1 and the momentum rate is 0.7. The Genetic optimization is used to find the best values for these parameters [21, 22] .
There is several ways to test the networks performance. Usually, MSE "mean squared error" is used. It is two times the average cost which is computed as follows:
Where, P is the number of output processing elements. N is the number of exemplars in the data set. yij is the network output for exemplar i at processing element j . dij is the desired output for exemplar i at processing element j .
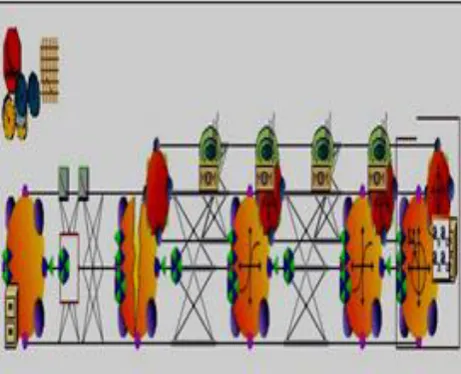
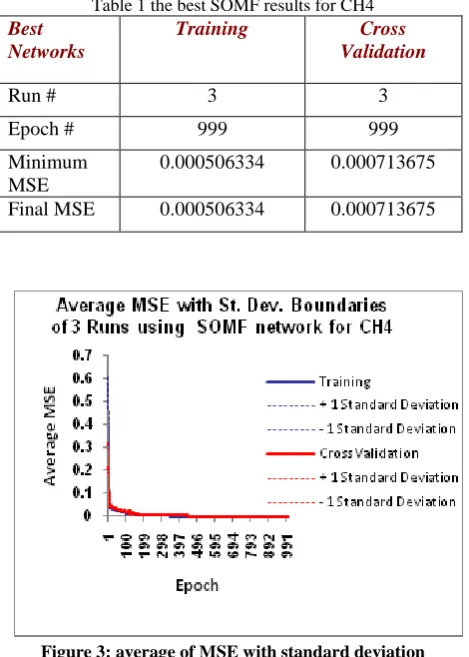
[image:4.595.318.543.72.227.2]Final MSE of CH4 is 0.000506334at epoch 999 at run 3, and the correlation between the desired output and actual network output is 0.999081896. The average of MSE with standard deviation boundaries for 3 runs of CH4 shows the training and cross validation graph is clearly smoothly trained and they are closely to each other from the epoch 25, and the network is smoothly trained as shown in Figure 3 and results summarize in table1.
Table 1 the best SOMF results for CH4
Best Networks
Training Cross
Validation
Run # 3 3
Epoch # 999 999
Minimum MSE
0.000506334 0.000713675
Final MSE 0.000506334 0.000713675
Figure 3: average of MSE with standard deviation boundaries for 3 runs of CH4
Figure 4: average of MSE of training data set for 3 runs of CH4
[image:4.595.50.285.285.614.2]Figure 4 depicts the final MSE value for tree run of training data set for the sake of testing the stability of network and then the generalization process. And Figure 5 illustrates the final MSE value for tree run of cross validation data set for the sake of assessing the generalization of the proposed model by the analysis of accuracy of the model predictions on seemingly independent dataset.
Figure 5: average of MSE of cross validation for 3 runs of CH4
6.2. Comparison of Results with other
Researcher
Some researchers are using the concept of sensor arrays and pattern recognition which applied to the obtained signal patterns for environmental monitoring but this approach is not suitable for giving the exact information about concentrations of individual species [23]. In our work we are addressing the individual gases concentration with time and date.
[image:4.595.317.542.337.521.2]ray spectrometer to identify radioactive isotopes. Neural network is used to identify the composition of the sensed pollutants. With intense training in the neural network computation is carried out for propagation of data through the network. The computation involved during operation consists of vector-matrix multiplication and application of look-up tables (activation function), unknown samples can be rapidly identified in the field
7
ALERT SYSTEMS
Air pollution is a serious problem that can lead to catastrophic outcomes if not managed and controlled properly. Atmosphere has a complex mixture of airborne particles with varying sizes coming from different sources which need to be monitored and controlled. Artificial intelligence Self-Organizing Feature Map (SOFM) is implemented and proposed for designing an alert system for the pollution control and monitoring. Our network can appropriately predict the exact values of gases which are responsible for the pollutant. The PM presence and dispersion in the atmosphere depends on a wide range of factors including meteorological. Data gathered from different environmental sensors needs to be analyzed and assessed appropriately. For any system that handle critical data that can reduce catastrophic impact on the population has to be credible and effective. Credibility demands that the system is accurate when dispatching a red alarm signal. The system will need to calculate the concentration of PM in a distributed area taking into accounts many external elements such as Temperature, wind, wind speed, rain storm and dust storm [14]. The system has to be smart enough to issue an early warning based on area of effect and the degree of impact. When cyclone Gunu [5] hit Oman many havoc was everywhere. Although a warning was issued by the government earlier but still there was losses of life and destruction. This raises a few questions, regarding the alarming process employed. Similarly a big lesson was learned from tsunami the problem wasn’t the forecasting rather it was the alarming system. For any effective alarming system it must be credible and functional under catastrophic conditions. In case of air pollution control system if any particular gas rations increase, the alarming system will notify the controller and will send warning.
8
CONCLUSIONS
In this paper we developed a framework and set of services to enable streamlined access to a collection of real-time, near-real-time and static datasets acquired through pollution monitoring sensors and stations. We proposed pollution control management system and Web Portal to enable the sharing and integration of the high quality data and models for pollution control resource managers. Data cleaning is implemented in this paper and artificial intelligence techniques are implemented to train the collected data set. Artificial intelligence technique ANN (Self-Organizing Feature Map) is used for data analysis and this processed data is used for developing alarming system [19].
9
FUTURE RESEARCH WORK
The practical test bench needs to be verified and tested in the real world situations. This system is life critical so before release the reliability must be tested correctly. There are other
soft computing techniques like genetic algorithms, and fuzzy which can be implemented for the sake of optimization of the results [20].
10. REFERENCES
[1] Acken, A.H., Lewis, R.: Final Particulate Matter National Ambient Air Quality Standards. ENRLS update 4(15) (2006).
[2] Akyol, D. E. (2004). Applications of neural networks to heuristic scheduling algorithms. Computers and Industrial Engineering, 46, 679-696. http://www.sciencedirect.com/science/article/pii/S03608 3520400066X.
[3] Abdul-Wahab S.A., 2005. Monitoring of Air Pollution in the Atmosphere Around Oman Liquid Natural Gas (OLNG) Plant. Journal of Environmental Science and Health, Part A: Toxic/Hazardous Substances and Environmental Engineering. Vol. 40, No. 3, pp. 559-570.
[4] Bonissone, P (2002). Hybrid Soft Computing for Classification and Prediction Applications. Conferencia Invitada. 1st International Conference on Computing in an Imperfect World (Soft-Ware 2002), Belfast. DOI: 10.1007/3-540-46019-5_28.
http://en.wikipedia.org/wiki/Cyclone_Gonu
[5] Fayyad, U.: Mining Database: Towards Algorithms for Knowledge Discovery. IEEE Techn. Bulletin Data Engineering 21(1), 1998.
[6] Galhardas, H.; Florescu, D.; Shasha, D.; Simon, E.: AJAX: An Extensible Data Cleaning Tool. Proc. ACM SIGMOD Conf., p. 590, 2000.
[7] Garcia, A.; Silva, V.; Lucena, C.; Milidiú, R. An Aspect-Based Approach for Developing Multi-Agent Object-Oriented Systems. Simpósio Brasileiro de Engenharia de Software, Rio de Janeiro, Brazil, October 2001.
[8] Giorgio Corani,"Air quality prediction in Milan:feed-forward neural networks, pruned neural networks and lazy learning" ,Ecological Modelling Volume 185, Issues 2-4, 10 July 2005, Pages 513-529
[9] Jabar H. Yousif, “INFORMATION TECHNOLOGY DEVELOPMENT”, LAP LAMBERT Academic Publishing, Germany ISBN 9783844316704, 2011.
[10]Jabar H. Yousif, Dinesh Kumar Saini and Hassan S. Uraibi, “ARTIFICIAL INTELLIGENCE IN E-LEANING-PEDAGOGICAL AND COGNITIVE ASPECTS”, Journal of Lecture Notes in Engineering and Computer Science,Vol:2191 , Issue:1 pp:997-1002 , 2011.
[11]Li Huang; Hai Jin; Pingpeng Yuan; Fan Chu; , "Duplicate Records Cleansing with Length Filtering and Dynamic Weighting," Semantics, Knowledge and Grid, 2008. SKG '08. Fourth International Conference on , vol., no., pp.95-102, 3-5 Dec. 2008 URL: http://ieeexplore.ieee.org/stamp/stamp.jsp?tp=&ar number=4725901&isnumber=4725879.
[13]Mark Richards, Moustafa Ghanem, Michelle Osmond, Yike Guo, John Hassard. 2006. Grid based analysis of air pollution data. Ecological Modelling. Elsevier Journal. Volume 194, Issues 1–3, pp.274–286.
[14]Ministry of Environment and Claimant affairs, Department of Monitoring Air pollution and Noise. Sultanate of Oman.
[15]Quass, D.: A Framework for Research in Data Cleaning. Unpublished Manuscript. Brigham Young Univ., 1999.
[16]LS Prakash, DK Saini, NS Kutti “Integrating EduLearn learning content management system (LCMS) with cooperating learning object repositories (LORs) in a peer to peer (P2P) architectural framework” ACM SIGSOFT Software Engineering Notes 34 (3), 1-7, 2009.
[17]Rehman, M.; Esichaikul, V.; , "Duplicate Record Detection for Database Cleansing," Machine Vision, 2009. ICMV '09. Second International Conference on , vol., no., pp.333-338,28-30Dec.2009. URL: http://ieeexplore.ieee.org/stamp/stamp.jsp?tp=&ar number=5381140&isnumber=5380895.
[18]Sousa, S.I.V., Martins, F.G., Pereira, M.C., Alvim-Ferraz, M.C.M., Ribeiro, H.,Oliveira, M., Abreu, I.: Influence of atmospheric ozone, PM10 and meteorological factors on the concentration of airborne pollen and fungal spores. Atmospheric Environment 42, 7452–7464 (2008)
[19]DK Saini “A mathematical model for the effect of malicious object on computer network immune system “Applied Mathematical Modelling 35 (8), 3777-3787, 2010.
[20]Teuvo Kohonen, "Self-Organizing Maps" (3rd edition) Springer, ISBN 3540679219 , 2001
[21]Zadeh, L.A. (2001). Applied Soft Computing. Applied Soft Computing 1, 1–2.
[22]Zvi Boger ,”Artificial Neural Networks Modeling to Reduce Industrial Air Pollution”, Applications of Soft Computing :Advances in Soft Computing, SpringerLink, Volume 58, pp63-71, 2009.
[23]Wenjian Wang, Zongben Xu, Jane Weizhen Lu, (2003) "Three improved neural network models for air quality forecasting", Engineering Computations, Vol. 20 ISS: 2, pp.192 – 210.
[24]WM Omar, DK Saini, M Hasan “Credibility of Digital Content in a Healthcare Collaborative Community” Software Tools and Algorithms for Biological Systems, 717-724, 2011.
[25]W. Ingemar, Christina K.R., Maria S. Fedrik L. “Electronic tongues for environmental monitoring based on sensor arrays and pattern recognition: a review” Analytica Chemica Acta, Vol.426, issue 12, Jan 2011, PP-217-226.
[26]DK Saini “Security Concerns of Object Oriented Software Architectures” International Journal of Computer Applications 40 (11), 41-48, 2012.