Energy Efficient Data Aggregation using Voronoi based
Genetic Clustering Algorithm in WSN
S. Nithyakalyani
Assistant professor K.S.R College of Engineering
Tiruchengode, India
S. Suresh Kumar,
Ph.DPrincipal
Vivekanandha College of Technology for Women Tiruchengode, India
ABSTRACT
Wireless Sensor Network is an major emerging technique in wireless communication technology for application across a wide array of domains such as the military surveillance, medical diagnosis, weather forecasting, fire detection alarming systems, etc. One of the main challenges of wireless sensor network (WSN) is how to improve its time of livelihood due to the restricted energy of sensor nodes. Data must be aggregated in order to avoid amounts of traffic in the network, limit the recourses and energy. To solve the above dilemmas , data mining process such as clustering and data aggregation is used .clustering is used to group the nodes where as data aggregation function like MIN,MAX,AVG is used for swabbing redundant data transmission and improves the life span of energy in wireless sensor network. In this paper a new approach related to Voronoi based Genetic clustering (VBGC) Algorithm is proposed for energy efficient data aggregation. Our algorithm achieves energy efficiency by reducing the number of data transmission in each round to cluster head and from it to Base station (BS) .The Base Station periodically executes the proposed algorithm to select new Cluster-Heads after a certain period of time. Simulation results reveal that our algorithm outperforms basic GA.
Keywords
Wireless Sensor Networks, Voronoi Diagram, Genetic Algorithm, clustering, data aggregation
1.
INTRODUCTION
Wireless Sensor Networks (WSNs) is essential ingredient of many application environments that are used in military and civilians. A sensor network is composed of a large number of sensor nodes, which are densely deployed either inside the phenomenon or very close to it [1]. One of the most important features in WSNs belongs to the limited battery of sensor nodes. When battery-powered wireless sensor nodes are placed in a specific field, it is complex to replace their batteries or provide additional energy. Furthermore, if one sensor node consumes completely its energy, part of the network may disconnect [2].
Data gathering is a common but it is significant operation in many applications of WSNs, while data aggregation and hierarchical mechanism are widely used techniques. Data aggregation can eliminate data redundancy and reduce communication load. Data mining technique like clustering mechanisms is an effective means for running such high population of nodes and can help reduce the nodes’ energy consumption [3]. Some efforts in energy-efficient clustering are as follows. [2] have proposed a so-called Low Energy Adaptive Clustering Hierarchy (LEACH) as the first clustering protocol. In this protocol, adata collection area is randomly divided into several clusters while each cluster has a
cluster-head and some cluster members. Cluster members transmit data to their own cluster-heads, which aggregate and transmit data to the base station. Later, [4] extended their work and represented a LEACH-C protocol. In this clustering method, the base station makes sure that only nodes with enough energy are participating in.
A protocol named HEED has been proposed by [5]. The protocol selects cluster-heads through O(1) time iteration according to some metrics and adopts the multi-hop communication to reduce energy consumption. The transmission cost in WSNs is regarded as the energy consumption of the nodes and when we can minimize this value, energy is saved. Fig. 1 shows a data delivery example in a cluster based network [1]. As shown, the calculation of transmission cost can be divided into two parts. The first part is the cluster members that transmit data to their cluster-heads. The second part, however, is the cluster-heads that transmit aggregated data to a sink node.
The Genetic Algorithm (GA) is a technique for randomized search and optimization and has been applied to a wide range of studies [6,7]. A basic operation flow of GA includes creating initial population, evaluating fitness, selection, crossover, mutation, updating optimal chromosome, and checking termination condition.
Searching for optimal clusters can be done using GA. Following, are the energy-efficient clustering technique using GA that has been developed previously. Electing a cluster-head that can minimize the maximum intra-cluster distance between itself and its cluster members by optimize energy consumption of the network have been proposed in [8] The researcher in [9] have developed a GA that creates energy efficient clusters for routing in wireless sensor networks. For evaluate the energy consumption of the network, they used a radio model. Besides, they assumed a fitness function with some fitness parameters such as direct distance to sink, cluster distance, transfer energy, and number of transmissions. The proposed algorithm maximizes the fitness function which is more energy efficient than a few existing cluster-based routing protocols in this work.
1.1. CLUSTERING IN WSN
Sensor node are densely deployed in wireless sensor
[image:2.595.55.283.213.341.2]network that means physical environment would produce very similar data in close by sensor node and transmitting such type of data is more redundant. So all these issues give confidence in using some kind of grouping of sensor nodes such that group of sensor node can combine or compress data together and transmit only compact data to base station. This can reduce localized traffic in individual group and also reduce global data. This grouping process of sensor nodes in a densely deployed large scale sensor node is known as clustering. The method of combing data and compress data belonging to a single cluster called data aggregation.
Fig 1: Cluster Based Data Aggregation in WSN
1.2. VORONOI DIAGRAM
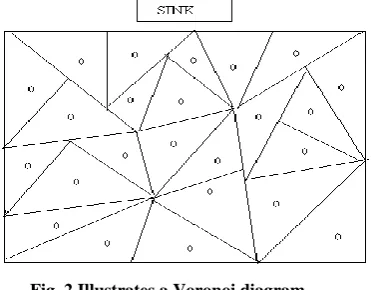
Computational geometry is frequently used in WSN coverage optimization, the most commonly used computational geometry approach are Voronoi diagram and Delaunay triangulation [12]. Voronoi diagram is partition of cells in such a way that points inside a polygon are closer to that cell than any other cells thus one of the vertices of the Polygon is the farthest point of the polygon to the site inside it. Therefore Voronoi diagram can be used as one of the sampling method in determining WSN coverage; with the sensors act as the sites, if all Voronoi polygons vertices are covered then the field is fully covered otherwise coverage holes exist.
Fig. 2 Illustrates a Voronoi diagram
A Voronoi diagram for N sensors s1,s2, . . . , sN in a
given plane is defined as the subdivision of the plane into N cells with one sensor, such that the distance between any point in a cell and the sensor of the cell is closer than that distance between this point and any other sensors. A Voronoi diagram is initially built up for all stationary sensor nodes, assuming that each node knows its own and its neighbor’s coordinates. After the local Voronoi diagram construction, the sensor field is divided into sub regions of Voronoi cells and each stationary node is within a Voronoi cell. A node is a Voronoi neighbor of another one if they share a Voronoi edge. Fig.2
illustrates a Voronoi diagram in a bounded sensor field, where the boundaries of the sensor field contribute to a Voronoi cell. ask that authors follow some simple guidelines. In essence, we ask you to make your paper look exactly like this document. The easiest way to do this is simply to download the template, and replace the content with your own material.
2. PROBLEM STATEMENT
In this work, consider a sensor network application where each sensor is capable of aggregating multiple incoming data packets with its own data and forwards a single data packet of fixed length. Each node is equipped with small amount of energy and the objective is to keep all sensors working as long as possible in order to expand the life time of WSN.
Definition 1 In a data gathering epoch, base station accepts data from all nodes in the field. Each sensor acquires the required data samples form its environment, aggregates any incoming packets from its neighbors, and forwards the aggregated packet to its parent or base station.
Definition 2 The network lifetime is defined as the number of rounds until all nodes are in a working condition.
Definition 3 The load of a sensor node is defined as the energy required to receive all the incoming data packets from its children and to transmit the aggregated data to its parent.
3. METHODOLOGY
In proposed VBGC, it is assumed that all sensors are of the same type, deployed randomly in the sensing field. At first proposed algorithm uses voronoi diagram to find each sensor’s coverage region by dividing given area into cells and then employs data mining process like clustering and data aggregation. Genetic clustering algorithm which is proposed for grouping optimal number of sensor nodes into clusters. In each CH, data aggregation function is performed such as MIN,MAX, AVG so as to minimize the energy spent by each node.
Let assume that there are n sensors, S1, S2,…,Sn, randomly deployed in field to detect its region R. Each sensor is able detect small range of region surrounding it (i.e) r, and connect to all those neighbors within its transmission range. The proposed methodology can be divided into four steps. The first step is to location discovery, which is used to determine the position of each sensor. The second step is detection range partition, where each sensor uses Voronoi diagram algorithm to delimit its responsible detection range. The third step is Genetic Algorithm for clustering and the final step is data aggregation.
3.1 Location Discovery
The first step is to determine the position of each sensor. If each sensor is equipped with a GPS, the system could have the absolute position of each sensor. In the proposed method sensor are considered to be static and location or position of the sensor’s are known in prior by the base station through broadcasting of sensor’s position.
3.2 Detection Range Partition Using
Voronoi
After the first step, each sensor will be able to know the relative positions of its 1-hop neighbors. The next step is to determine the responsible detection range of each sensor. In Base station
Cluster Member
[image:2.595.75.261.493.638.2]this research, utilization of Voronoi diagram is to delimit the responsible detection range of each sensor. Voronoi diagram can be used to divide an area into sub-areas. In a Voronoi diagram, it holds the property that the nearest site of any point x in a sub-area V(Pi) must be Pi (site).
Let P =
{
P
1,
P
2,...,
P
n},
n
2
,
P is a set of nodes in anarea, and
P
1,
P
2,...,
P
n are sites} , :
{ )
(P x x x j i
V
P
P
j
i
P
{
V
P
1,
V
P
2,...,
V
P
n}
V
P
[image:3.595.50.278.116.273.2]V
is called a voronoi diagramFig 3.Definition: Voronoi Diagram
3.3.
General
Genetic
Algorithm
for
Clustering
Genetics Algorithm (GA) is a heuristic based optimization technique which produces many fruitful results in engineering field. It is structured yet randomized search technique which primarily works based upon the following three genetic operators called Reproduction, Crossover and Mutation.
Let us have a look at genetics algorithm terms, Chromosomes: The initial possible solutions or population to the problem are called chromosomes or individual. All the chromosomes should have the same length and the elements in it are called as genes or alleles. Fitness function: Fitness function is used to evaluate the chromosomes fitness values and the higher valued chromosomes would produce more offspring than others. Here in our paper the fitness value corresponds to the network lifetime. Reproduction: It is the basic genetic operator which reproduces the chromosomes with higher values to the next generation. Crossover: Crossover selects two parent chromosomes and makes them to swap part of their genetics information with each other and produces the next generation chromosomes. Mutation: After crossover, mutation operator is applied to the chromosomes. It prevents the GA approach from pre-mature convergence. It is used to search the solution from whole new place instead of searching from the current better ones.
3.4. Data Aggregation
Data aggregation is a method of data mining process which is executed in each cluster head that aims to reduce the localized congestion problem, redundant data, number of data transmission as [13]. It tries to gather helpful data from the sensory data by applying the maximum, minimum, average functions. It then transmits only the useful information (aggregated data) to the sink node thus reducing congestion and its linked problems. In wireless sensor network, each sensor node transmits their sensed data to the cluster head and subsequently, the cluster head calculates aggregate function such as average or maximum or minimum of the received data which is send to the sink node. The cluster head then sends the aggregated data to the sink node periodically.
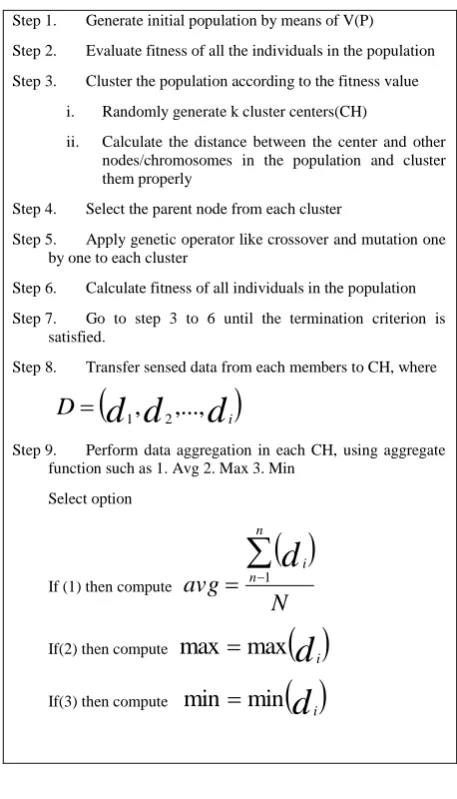
4. PROPOSED VBGC
The wireless sensor nodes are deployed in the sensing field R and each sensor know its position by using location discovery method. Then construct voronoi diagram for the given field using the equations in Table 1 in order cover the entire region R. Subsequently the genetic clustering algorithm is used to cluster the nodes in the field. Fitness function of GA is measured as Euclidian distance of sensor nodes and residual energy of each sensor. Using table 2, from the step1 to step 6 optimal cluster head (CH) are elected and optimal number clusters are formed. Once the clusters are obtained sensed data in each node is transmitted from it to its cluster head (CH). Finally data aggregation is carried out in each CH, the cluster head will transmits only the aggregate information to the base station which is useful for further decision making process to the end user. Data aggregation is done so as to limit the energy spent by each node which in turn increase the total network life time.
Fig 4. Voronoi Based Genetic Clustering algorithm
5. SIMULATION AND SUMMARY
Energy calculation
The sensor nodes are randomly deployed in the 100 x 100 meters and the base station is located out the sensing field.
Step 1. Generate initial population by means of V(P)
Step 2. Evaluate fitness of all the individuals in the population
Step 3. Cluster the population according to the fitness value
i. Randomly generate k cluster centers(CH)
ii. Calculate the distance between the center and other nodes/chromosomes in the population and cluster them properly
Step 4. Select the parent node from each cluster
Step 5. Apply genetic operator like crossover and mutation one by one to each cluster
Step 6. Calculate fitness of all individuals in the population
Step 7. Go to step 3 to 6 until the termination criterion is satisfied.
Step 8. Transfer sensed data from each members to CH, where
d
d
d
i
D
,
,...,
2 1
Step 9. Perform data aggregation in each CH, using aggregate function such as 1. Avg 2. Max 3. Min
Select option
If (1) then compute
N
avg
n
n i
d
1If(2) then compute
d
imax
max
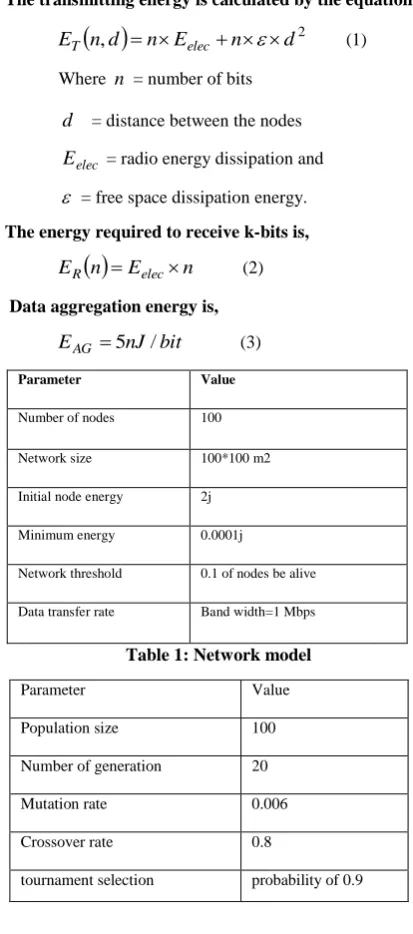
[image:3.595.318.547.286.686.2]The number of times that nodes transmit their messages to the cluster heads and cluster heads transmit the message to the base station from the beginning of the network life is defined as number of transmissions and is employed as a scale to compare the network lifetime and different clustering methods. By the way the network will be alive until ten percents of the nodes are alive. Wireless channel is assumed to be ideal and so there is no retransmission of control packets because of collision. We used a radio setting model the same as the one in Heinzelman [4]. In our simulation we assumed that the n =4000bits, Eelec =50 nJ/bit and ε = 10 pJ/bit/m2 and
table 1 and 2. The radio model is followed as in [4], etc...
The transmitting energy is calculated by the equation,
2,
d
n
E
n
d
n
E
T
elec
(1) Where n = number of bitsd
= distance between the nodeselec
E
= radio energy dissipation and
= free space dissipation energy.The energy required to receive k-bits is,
n
E
n
E
R
elec
(2)Data aggregation energy is,
bit
nJ
E
AG
5
/
(3)
Parameter Value
Number of nodes 100
Network size 100*100 m2
Initial node energy 2j
Minimum energy 0.0001j
Network threshold 0.1 of nodes be alive
[image:4.595.327.533.72.196.2]Data transfer rate Band width=1 Mbps
Table 1: Network model
Table 2.Genetic parameter
Fig 5: Number of transmissions VS number of node
[image:4.595.63.270.208.676.2]
Fig 6: Average energy dissipation per round VS number of nodes
Fig. 5 and 6 shows the comparisons of total energy consumptions of proposed method per round Vs GA. GA has less information exchange than VBGC, therefore VBGC has the best energy consumption performance. As the number transmission increases performance of node decreases so if we increase the number of nodes then network life time will be extend and energy spent per node will be decreased. Hence the VBGC is efficient than any GA by reducing number of transmission to Basetion.
7. CONCLUSION
In this paper, energy efficient data aggregation using Voronoi Based Genetic Clustering algorithm were proposed for reducing the number of transmission from Cluster member to CH ,CH to base station and to increase the WSN life time. The voronoi diagram in VBGC was employed to determine the sensing range of each sensor since the total energy consumption is closely concerned with the number of cluster-heads and their position. Once the voronoi diagram is applied GA was applied for grouping the sensor node ,here proposed work tried to generate an optimal number of cluster-heads and optimize the number of cluster members of each cluster-heads for data aggregation process. The Euclidian distance between sensor node and CH was considered to evaluate the fitness function of a genetic algorithm in a network. By this function, proposed method minimized the cost of transmission in this network. Data mining process further reduces the numbers data transmission from CH to sink node by data aggregation function such as MIN,MAX,AVG as additional benefit to clustering in network .To validate the algorithm, simulations had been carried out using MATLAB. Simulation results shows better performance of VBGC as compared to basic GA in terms of performance metrics like number of transmission, coverage area and total energy dissipation in the system.
0 1000 2000 3000 4000 5000 6000 7000 8000
20 40 60 80 100
N
u
m
b
er
o
f
Tra
n
sm
is
si
o
n
s
Number of nodes
Numbers of transmission VS number of nodes
VBGC GA
0 50 100 150 200
20 40 60 80 100
A
ve
ra
ge
e
n
e
rg
y
d
issi
p
at
ion
p
e
r
rou
n
d
number of nodes
Comparisons of total energy consumption per round
GA VBGC
Parameter Value
Population size 100
Number of generation 20
Mutation rate 0.006
Crossover rate 0.8
[image:4.595.327.531.234.349.2]8. REFERENCES
[1] I. F. Akyildiz, W. Su, Y. Sankarasubramaniam, and E. Cayirci, “Wireless sensor networks: A survey,” Computer Networks, vol. 38, no.4, pp. 393–422, March 2002.
[2] W. Heinzelman, A. Chandrakasan, and H. Balakrishnan,“Energy-efficient communication protocol for wireless microsensor networks,” in Proc. of the 33rd Annual Hawaii International Conference on System Sciences, pp. 3005-3014, January 2000.
[3] A. Abbasi and M. Younis, “A survey on clustering algorithms for wireless sensor networks,” Computer Communications, vol. 30, pp.2826-2841, October 2007. [4] W. Heinzelman, A. Chandrakasan, and H. Balakrishnan,
“An application-specific protocol architecture for wireless microsensor networks,” IEEE Trans. on Wireless Communications, 2002, 1(4), pp.660-670. [5] O Younis and S Fahmy, “HEED: A hybrid,
energy-efficient,distributed clustering approach for ad hoc sensor networks,” IEEE Transactions on Mobile Computing, vol. 3, pp. 366-379, 2004.
[6] D. E. Goldberg, Genetic Algorithms in Search, Optimization, and Machine Learning,Addison Wesley, Reading, MA, 1989.
[7] K. Sastry, D. Goldberg, and G. Kendall, Genetic Algorithms. Chapter 4 of Introductory Tutorials in Optimization and Decision Support Techniques, (eds. E. Burke and G. Kendall), pp. 97–125, Kluwer, 2005. [8] R. Khanna, H. Liu, and H. H. Chen, “Self-organization of
sensor networks using genetic algorithm,” IEEE ICC ’06, pp.3377-3382,June 2006.
[9] O. Islam, S. Hussain, and H. Zhang, “Genetic algorithm for nergy efficient clusters in wireless sensor networks,” IEEE ITNG '07, pp. 147 – 154, 2007.
[10] J. Zhang, Y. Lin, C. Zhou, and J. Ouyang, “Optimal model for energy-efficient clustering in wireless sensor networks using global simulated annealing genetic algorithm,” IEEE IITAW ‘8, pp. 656 –660, 2008. [11] H. Seo, S. Oh, and C. Lee, “Evolutionary genetic
algorithm for efficient clustering of wireless sensor networks,” IEEE CCNC 2009,pp. 1 – 5, 2009
[12] Naeim Rahmani, Farhad Nematy et al” Node Placement for Maximum Coverage Based on Voronoi Diagram Using Genetic Algorithm in Wireless Sensor Networks”, Australian Journal of Basic and Applied Sciences, 5(12): 3221-3232, 2011
[13] S.Nithya kalyani and S.Suresh kumar “ Optimal clustering Algorithm for Energy Efficient data Aggregation in WSN” European Journal of Scientific Research, ISSN 1450-216X Vol.78 No.1, ), pp.146-155,2012.
BIOGRAPHICAL NOTES
Mrs.S.Nithyakalyani received Bachelor of Engineering degree in Information Technology from Avinashiligam Deemed Universiry in 2004, and Master of Engineering in Computer Science and Engineering from Anna University in 2006. Currently she is working towards Ph.D degree in Anna University. Her area of interest includes in Data Mining, Network security. She is the life member of ISTE