Recognizing Workshop Activity Using Body Worn Microphones and
Accelerometers
P. Lukowicz, J. Ward, H. Junker, M. St¨ager, G. Tr¨oster
ETH - Swiss Federal Institute of Technology
Wearable Computing Laboratory
8092 Z¨urich, Switzerland
www.wearable.ethz.ch
A. Atrash and T. Starner
College of Computing
Georgia Institute of Technology
Atlanta, Georgia 30332-0280
amin,thad
@cc.gatech.edu
Abstract
Most gesture recognition systems analyze gestures intended for communication (e.g. sign language) or for command (e.g. navigation in a virtual world). We attempt instead to recognize gestures made in the course of performing every-day work activities. Specifically, we examine activities in a wood shop, both in isolation as well as in the context of a simulated assembly task. We apply linear discriminant analysis (LDA) and hidden Markov model (HMM) tech-niques to features derived from body-worn accelerometers and microphones. The resulting system can successfully segment and identify most shop activities with zero false positives and 83.5% accuracy.
1
Introduction
Advances in technology are allowing computer support for mobile applications. Delivery, maintenance, and manufac-turing personnel are adopting mobile computing devices to support their work. Similarly, consumers now have access to mobile electronic tourist guides, communication devices, and health and wellness monitoring devices.
A key issue in most such mobile applications is the ef-fort required to devote to operating the devices. Whereas in a desktop setting the computer is the focus of the user’s attention, the user is forced to focus his attention on the environment for many mobile applications. Accessing the computer should require minimal cognitive and physical ef-fort to prevent distracting the user from his primary task.
1.1
Context Sensitivity in Wearable Systems
In addressing the above issues wearable computers have re-cently emerged as a promising new paradigm. To reduce the physical effort required to operate the device they are designed to be a permanently accessible part of the user’s outfit, have mostly hands free input devices, and head-up displays.
With respect to the cognitive load, many wearable sys-tems focus on context sensitivity and proactiveness (e.g [1]). The system should be aware of the user’s action and the ac-tivities occuring in his environment. Based on this aware-ness, the system can adapt its configuration, deliver infor-mation to the user, or record interesting events without any explicit user input [17]. For example, a maintenance sup-port system could recognize what particular task is being performed by the user and automatically display the rele-vant manual pages on the system’s head-up display. The wearable could also record the sequence of operations that are being performed for later analysis or could warn the user if an important step has been forgotten.
1.2
Recognition Approach
Past approaches by the authors have used head-mounted cameras and computer vision techniques to identify user context [17]. Although the visual signal contains much rel-evant information about any given situation, vision–based recognition has several disadvantages. For one, reliable lo-calization and recognition of the relevant objects (hands, machine parts, tools) in complex scenes is an open research problem. In addition, computer vision techniques have diffi-culty with the unstructured, moving backgrounds and vary-ing lightvary-ing condition as is common to many wearable sce-narios, and relevant parts of the scene might be out of view or obstructed. Finally, video recognition is computationally intensive, often requiring resources not available on a wear-able system.
environmental activity is sound. It has been shown that in many situations ambient sound analysis can be used to dis-tinguish between different settings, activities, and situations [4].
1.3
Paper Aims and Contributions
This paper is part of our work aiming to develop a reli-able context recognition methodology based on the above approach. It presents a novel way of combining motion sensor-based gesture recognition with sound data from dis-tributed microphones. In particular we exploit intensity dif-ferences between microphones on the wrist of the dominant hand and on the chest to identify relevant actions performed by the user’s hand.
In the paper we focus on tracking user activity during as-sembly or maintenance tasks. Such tasks are among the most important applications of wearable computing (e.g. [2, 7]) and could significantly benefit from context sensi-tivity. At the same time these tasks are well structured and limited to a reasonable number of often repetitive actions. In addition, machines and tools typical to a workshop envi-ronment generate distinct sounds. Therefore, these activi-ties are well suited for a combination of gesture and sound– based recognition.
This paper describes our approach and the results pro-duced in an experiment performed on an assembly task in a wood workshop. We demonstrate that simple sensors placed on the user’s body can reliably select and recognize user actions during a workshop procedure.
1.4
Related Work
Acceleration–based activity recognition has been studied by different research groups [11, 14, 19]. However all of the above work focused on recognizing comparatively simple activities (walking, running, and sitting). Sound based sit-uation analysis has been investigated by Pelton et al. and in the wearables domain by Clarkson and Pentland [12, 5]. Intelligent hearing aids have also exploited sound analysis to improve their performance [3].
2
Experimental Setup
[image:2.612.317.552.25.177.2]Performing initial experiments on live assembly or mainte-nance tasks is unadvisable due to the cost and safety con-cerns and the ability to obtain repeatable measurements un-der experimental conditions. As a consequence we have de-cided to focus on an “artificial” task performed at the work-bench of wood workshop of our lab (see Figure 1). The task consisted of assembling a simple object made of two pieces of wood and a piece of metal. The task required 8 process-ing steps usprocess-ing different tools and includprocess-ing walkprocess-ing and
Figure 1: Left: the wood workshop with 1) grinder, 2) drill, 3)file and saw, 4) vice, and 5) cabinet with drawers. Right: The sensor type and placement is identical with the one used in our experiment: 1,4: microphone, 2,3 and 5: 3-axis ac-celeration sensors.
other gestures similar to an assembly task in a real world setting.
2.1
Procedure
No action
1 take the wood out of the drawer 2 put the wood into the vice 3 take out the saw
4 saw
5 put the saw into the drawer 6 take the wood out of the vice 7 drill
8 get the nail and the hammer 9 hammer
10 put away the hammer, get the driver and the screw 11 drive the screw in
12 put away the driver 13 pick up the metal 14 grind
15 put away the metal, pick up the wood 16 put the wood into the vice
17 take the file out of the drawer 18 file
19 put away the file, take the sandpaper 20 sand
21 take the wood out of the vice
Table 1: Steps of workshop assembly task.
[image:2.612.317.537.312.571.2]and a piece of sandpaper. The wood was fixed in the vice for sawing, filing, and smoothing (and removed whenever necessary). The test subject moved between areas in the workshop between steps. Also, whenever a tool or an ob-ject (nail screw, wood) was required, it was retrieved from its drawer in the cabinet and returned after use.
The exact sequence of actions is listed in Table 1. The task was to recognize all tool-based activities. Tool-based activities excludes drawer manipulation, user locomotion, and clapping (a calibration gesture). The experiment was repeated 10 times in the same sequence to collect data for training and testing. For practical reasons, the individual processing steps were only executed long enough to obtain an adequate sample of the activity. This policy did not re-quire the complete execution of any one task (e.g. the wood was not completely sawn), allowing us to complete the ex-periment in a reasonable amount of time. However this pro-tocol influenced only the duration of each activity and not the manner in which it was performed.
2.2
Data Collection System
The data was collected using the ETH PadNET sensor net-work [8] equipped with 3 axis accelerometer nodes and two Sony mono microphones connected to a body worn com-puter. The position of the sensors on the body is shown in Figure 1: an accelerometer node on both wrist and on the upper arm of the right hand and a microphone on the chest and on the right wrist (the test subject was right handed).
As can be seen in Figure 1 each PadNET sensor node consist of two modules. The main module incorporates a MSP430149 low power 16-Bit mixed signal micropro-cessor (MPU) from Texas Instruments running at 6 MHz maximum clock speed. The current module version reads out up to three analog sensor signals including amplifica-tion and filtering and handles the communicaamplifica-tion between modules through dedicated I/O pins. The sensors them-selves are hosted on an even smaller ’sensor-module’ that can be either placed directly on the main module or con-nected through wires. In the experiment described in this paper sensor modules were based on a 3-axis accelerom-eter package consisting of two ADXL202E devices from Analog Devices. The analog signals from the sensor were lowpass filtered ( ) and digitized with 12Bit
resolution using a sampling rate of 100Hz.
3
Recognition
3.1
Acceleration Data Analysis
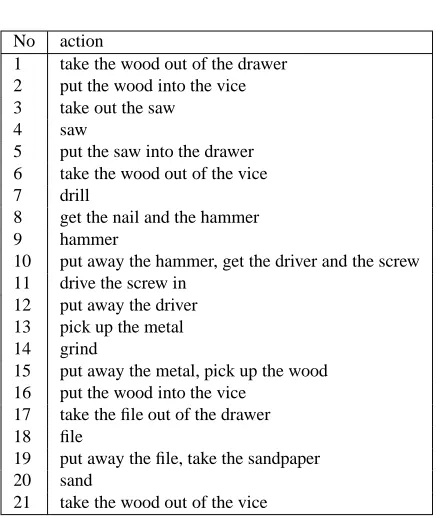
Figure 2 shows a segment of the acceleration data collected during the experiment. The segment includes sawing, re-moving the wood from the vice, and drilling. The user
ac-cesses the drawer two times and walks between the vice and the drill. Clear differences can be seen in the acceleration signals. For example, sawing clearly reflects a periodic mo-tion. By contrast, the drawer access (marked as 1a and 1b in the figure) shows a low frequency “bump” in acceleration. This bump corresponds to the 90 degree turns of the wrist as the user releases the drawer handle, retrieves the object, and grasps the handle again to close the drawer.
Given the data, time series recognition techniques such as hidden Markov models (HMMs) [13] should allow the recognition of the relevant gestures. However, a closer anal-ysis reveals two potential problems. First, not all relevant activities are strictly constrained to a particular sequence of motions. While the characteristic motions associated with sawing or hammering are distinct, there is high variation in drawer manipulation and grinding. Secondly, the activities are separated by sequences of user motions unrelated to the task (e.g the user scratching his head). Such motions may be confused with the relevant activities. We define a “noise” class to handle these unrelated gestures.
3.2
Sound Data Analysis
Considering that most gestures relevant for the assem-bly/maintanance scenario are associated with a distinct sounds, sound analysis should help to address the problems described above. We distinguish between three different types of sounds:
1. Sounds made by a handtool: - Such sounds are directly correlated with user hand motion. Examples are saw-ing, hammersaw-ing, filsaw-ing, and sanding. These actions are generally repetitive, quasi–stationary sounds (i.e. rel-atively constant over time - such that each time slice on a sample would produce an identical spectrum over a reasonable length of time). In addition these sounds are much louder than the background noise (dominant) and are likely to be much louder at the microphone on the user’s hand than on his chest. For example, the intensity curve for sanding (see Figure 2 top right) reflects the periodic sanding motion with the minima corresponding to the changes in direction and the max-ima coinciding with the maximum sanding speed in the middle of the motion. Since the user’s hand is directly on the source of the sound the intensity difference is large. For other activities it is smaller, however in most cases still detectable.
1.1 1.15 1.2 1.25 1.3 1.35 1.4 1.45 1.5 1.55 1.6
x 104
−2 −1 0 1 2 3 4 5 6 7 8
Data Frame
Accelerometer Reading (Offset per Axis for Readability)
sound correleation r−wrist axis 1 r−wrist axis 2 r−wrist axis 3 l−wrist axis 1
r−arm axis 1
sawing
open vice
close vice turn drill wheel to move it down taking out
the saw
putting back the saw
1a 1b 2
3
0 0.5 1 1.5 2 2.5 3 3.5 4 4.5
2 4 6 8 10 12 14 16 18 20
time [s]
Intensity
Sanding
Wrist microphone Chest microphone
−40 −20 0 20 40 60 80
−60 −50 −40 −30 −20 −10 0 10 20
saw
drill
[image:4.612.61.553.28.258.2]drawer
Figure 2: Left: example accelerometer data from sawing and drilling. Right top: audio profile of sanding from wrist and chest microphones. Right bottom: clustering of activities in LDA space
dominant and tend to have a less distinct intensity dif-ference between the hand and the chest (for example, when a user moves their hand away from the machine during operation).
3. Autonomous sounds: These are sounds generated by activities not driven by the user’s hands (e.g loud back-ground noises or the user speaking).
Obviously the vast majority of relevant actions in assembly and maintanance are associated with hand tool sounds and semi–autonomous sounds. In principle, these sounds should be easy to identify using intensity differences between the wrist and the chest microphone. In addition, if extracted ap-propriately, these sounds may be treated as quasi-stationary and can be reliably classified using simple spectrum pattern matching techniques.
The main problem with this approach is that many ir-relevant actions are also likely to fall within the definition of handtool and semi–autonomous sound. Such actions include scratching or putting down an object. Thus, like acceleration analysis, sound–based classification also has problem distinguishing relevant from irrelevant actions and will produce a number of false positives.
3.3
Recognition Methodology
Neither acceleration nor sound provide enough information for perfect extraction and classification of all relevant activ-ities; however, we hypothesize that their sources of error are
likely to be statistically distinct. Thus, we develop a tech-nique based on the fusion of both methods. Our procedure consists of three steps:
1. Extraction of the relevant data segments using the in-tensity difference between the wrist and the chest mi-crophone. We expect that this technique will segment the data stream into individual actions (including many actions we will model as noise).
2. Independent classification of the actions based on sound or acceleration. This step will yield imperfect recognition results by both the sound and acceleration subsystems.
3. Removal of false positives. While the sound and ac-celeration subsystems are each imperfect, when their classifications of a segment agree, the result may be more reliable (if the sources of error are statistically distinct).
4
Isolated Activity Recognition
4.1
Sound Recognition
4.1.1 Method
The basic classification scheme operates on individual sound segments of length . The approach follows a three
step process: feature extraction, dimensionality reduction, and the actual classification.
The features used are the spectral components of each
obtained by Fast Fourier Transformation (FFT). This pro-duces
dimensional feature vectors.
Rather than attempting to classify such large
-dimensional vectors directly, Linear Discriminant Analysis (LDA)[6] is employed to derive an optimal projection of the data into a smaller, dimensional feature space (where M
is the number of classes). In the “recognition phase”, the LDA transformation is applied to the data segment under test to produce the corresponding dimensional
fea-ture vector.
Using a labeled training-set, class means are calculated in the dimensional space. Classification is performed
simply by choosing the class mean which has the minimum Euclidean distance from the test feature vector (see Figure 3 bottom right).
4.1.2 Intensity Analysis
Making use of the fact that signal intensity is inversely pro-portional to the square of the distance from its source, the ratio of the two intensities
is used as a
mea-sure of absolute distance of source from the user. Assuming the sound source is distance from the wrist microphone
and "! from the chest, the ratio of the intensities will be
proportional to
#$
&%
'
!(
*)+!,"!
-. )!
!
When both microphones are separated by at least! , any
sound produced a distance ( where0/1/2! ) from the
user will bring this ratio close to one. Sounds produced near the chest microphone (e.g. the user speaking) will cause the ratio to approach zero whereas any sounds close to the wrist mic will make this ratio large.
Sound extraction is performed by sliding a window3 4
over the Hz resampled audio data. On each iteration,
the signal energy over354 for each channel is calculated.
For these windows, the difference in ratio6 7 and
its reciprocal are obtained, which are then compared to an empirically obtained threshold894 .
The difference: " 7#$ provides a
convenient metric for thresholding - zero indicates a far off (or exactly equidistant) sound while above or below zero values indicate a sound closer to the wrist or to the chest mic respectively.
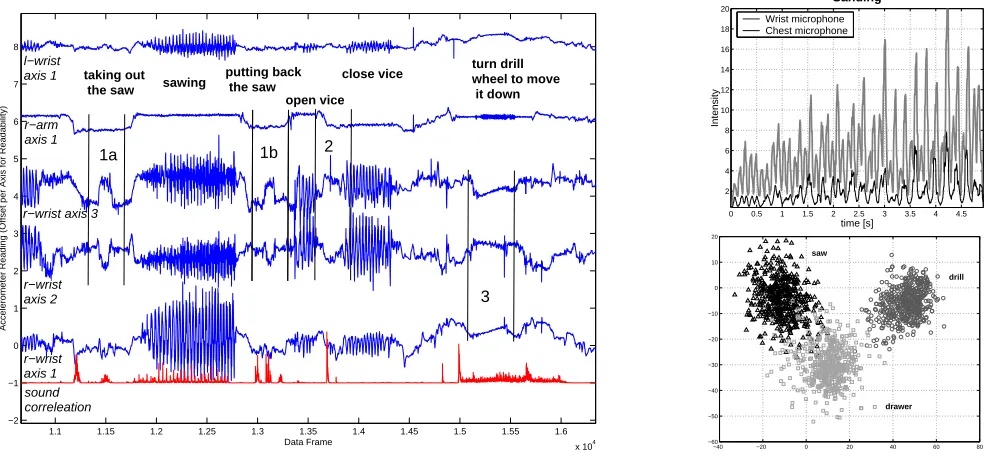
Sound LDA IA+LDA maj(IA+LDA) Hammer 96.79 98.85 100
[image:5.612.339.532.21.137.2]Saw 92.71 92.98 100 Filing 69.68 81.43 100 Drilling 99.59 99.35 100 Sanding 93.66 92.87 100 Grinding 97.77 97.75 100 Screwing 91.17 93.29 100 Vice 80.10 81.14 100 Overall 90.18 92.21 100
Table 2: Isolated Recognition Accuracy Per Sound (in %) for LDA alone, LDA with IA preselection and majority de-cision.
4.2
Results
In order to analysis the performance of the LDA on isolated classes, individual examples of each class were partitioned from each of the 10 experiments, providing 10 examples of each class. Eight examples of each class were used for training while testing on the remaining two examples.
Earlier work[15] cited ;=5kHz and =0.05 seconds
(256 points) as optimal parameters for general purpose sound recognition tasks. In this task, it was found that recognition rates were improved using a larger =0.1; at
the same time could be reduced to 2kHz without any
no-table adverse effects.
With these parameters, a sliding window LDA
classi-fication was run directly over all the class partitioned sam-ples. This process returned an overall recognition rate of 90.19%. The individual class results are given in the first column of Table 2. We next used intensity analysis to select only the samples over a given threshold to pass to the LDA procedure. This technique resulted in a slightly higher accu-racy of 92.21% as shown in the second column of Table 2. The third column of Table 2 shows a variation of this tech-nique where we slide a window over the data and classify the data at each window segment. A majority decision over the window segments was used to determine the overall la-bel for a given isolated activity. This technique resulted in 100% recognition over the test data.
[image:5.612.327.545.560.635.2]4.3
Accelerometer–Based Activity
Recogni-tion
Hidden Markov models (HMMs) are probabilistic models used to represent non-deterministic processes in partially observable domains and are defined over a set of states, tran-sitions, and observations. Details of HMMs and the respec-tive alogrithms are beyond the scope of this paper but may be found in Rabiner’s tutorial on the subject [13].
Hidden Markov models have been shown to be robust for represention and recognition of speech [9], handwriting [16], and gestures [18]. HMMs are capable of modelling important properties of gestures such as time variance (the same gesture can be repeated at varying speeds) and repe-tition (a gesture which contains a motion which can be re-peated any number of times). They also handle noise due to sensors and imperfect training data by providing a prob-abilistic framework.
For gesture recognition, a model is trained for each of the gestures to be recognized. In our experiment, the set of ges-tures includes saw, drill, screw, hammer, sand, file, drawer, vice, and clap. Once the models are trained, a sequence of features can be passed to a recognizer which calculates the probability of each model given the observation sequence and returns the most likely gesture. For our experiments, the set of features consists of readings from the accelerom-eters positioned at the wrist and at the elbow. This provides 6 total feature values which are then normalized to sum to one and collected at approximatedly 93 Hz.
We found that most of the workshop activities typically require only simple HMMs for modelling. For file, sand, saw, and screw, a 5 state model with 1 skip transition and 1 loopback transtion suffice because they consist of simple repetitive motions. Drill is better represented using a 7 state model. Clapping, drawer, and grinding are slightly more complex and required 9 state models. The vice is unique in that it has two seperate motions, opening and closing. Thus a 9 state model is used with two appropriate loopbacks to correctly represent the gesture. These models were selected through inspection of the data, an understanding of nature of the activities, and experience with HMMs.
4.4
HMM Isolation Results
For this project, a prototype of the Georgia Tech Gesture Recognition Toolkit was used to train the HMMs and for recognition. The Toolkit is an interface to the HTK toolkit [20] designed for training HMMs for speech recognition. HTK handles the algorithms for training and recognizing the Hidden Markov Models allowing us to focus primarily on properly modelling the data.
To test the performance of the HMMs in isolation, the shop accelerometer data was partitioned by hand into 255 individual examples of gestures then used as a training set
for the HMMs. Accuracy of the system was calculated by performing leave-one-out validation by iteratively reserving one sample for testing and training on the remaining sam-ples for each sample. The HMMs were able to correctly classify 93.33% of the gestures over data collected from the shop experiments. While this method has slightly more er-rors than the LDA method in isolation, we continue to pur-sue it for use in the continuous recognition case.
5
Continuous Recognition
Recognition of gestures from a continuous stream of fea-tures is difficult. However, we can simplify the problem by partitioning the continuous stream into segments and at-tacking the problem as isolated recognition. This approach requires a method of determining a proper partitioning of the continuous stream. We take advantage of the intensity analysis described in the previous section as a technique for identifying appropriate segments for recognition.
Since neither LDA nor the HMM are perfect at recog-nition, and each is able to recognize a different set of ges-tures well due to working in different feature space, it is advantagous to compare their independant classifications of a segment. If the classification of the segment by the HMMs matches the classification of the segment by the LDA, the classification can be believed. Otherwise, the noise class can be assumed, or perhaps a decision appropriate to the task can be taken (such as requesting additional information from the user).
Thus, the recognition is performed in three main stages: 1) Extracting potentially interesting partitions from the con-tinuous saquence, 2) Classifying these individually using the LDA and HMMs, and 3) Combining the results from these approaches.
5.1
LDA for partitioning
For classification, partitioned data needs to be arranged in continuous sections corresponding to a single user activity. Such partitioning of the data is obtained in two steps: First, LDA classification is run on segments of data chosen by the IA. Those segments not chosen by intensity analysis are returned with classification zero. (In this experiment, clas-sifications are returned at the same rate as accelerometer features); Secondly, these small window classifications are further processed by a larger (several seconds) majority de-cision window, which returns a single result for the entire window duration.
Gesture HMM LDA HMM + LDA
C I D S Acc C I D S Acc C I D S Acc P(G Class) Hammer 9 3 0 0 66.7 9 1 0 0 88.9 9 0 0 0 100 1.00
[image:7.612.88.523.22.150.2]Saw 9 0 0 0 100 9 1 0 0 88.9 9 0 0 0 100 1.00 Filing 9 0 0 1 100 9 7 0 1 23.2 8 0 2 0 80 1.00 Drilling 9 4 0 0 55.6 9 1 0 0 88.9 9 0 0 0 100 1.00 Sanding 8 0 0 1 88.9 9 8 0 0 11.1 8 0 1 0 88.9 1.00 Grinding 11 11 0 0 0 9 0 0 2 81.8 9 0 2 0 81.8 1.00 Screwing 4 0 0 5 44.4 9 75 0 0 -733.3 4 0 5 0 44.4 1.00 Vice 41 0 0 2 95.3 34 1 2 7 76.6 35 0 8 0 81.3 1.00 Overall 100 18 0 9 72.5 97 94 2 10 2.8 91 0 18 0 83.5 1.00
Table 3: Continuous recognition accuracy per gesture (Correct Insertions Deletions Substitutions Accuracy) and
proba-bility of gesture given classification P(GClass)
“A hammering gesture occured between sample 1500 and 2300.” The system is tolerant of, and does not require, per-fect alignment between the partitions and the actual gesture. The example alignment shown in Figure 5 is acceptable for our purposes.
5.2
LDA Results
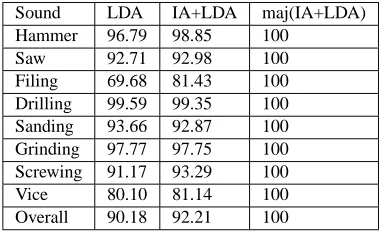
Analysis of the data was performed to test the system’s abil-ity to reconstruct the sequence of gestures in the shop exper-iments based on the partitioning and recognition techniques described to this point. Figure 4 shows an example of the automated partitioning versus the actual events. For this analysis of the system, the non-tool gestures, drawer and clapping, were considered as part of the noise class. Af-ter applying the parition scheme, a typical shop experiment resulted in 25-30 different partitions.
5.3
HMM Classification
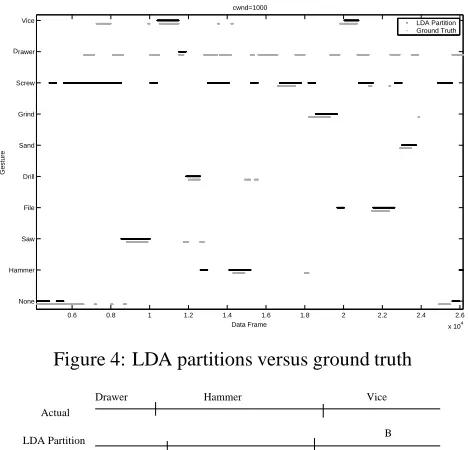
Once the partitions are created by the LDA method, they are passed to set of HMMs for further classification. For this experiment, the HMMs are trained on individual gestures from the shop experiments using 6 accelerometer features from the wrist and elbow. Ideally, the HMMs will return a single gesture classification for each segment. However, the segment sometimes includes the beginning or end of the next or previous gesture respectively, causing the HMMs to return a sequence of gestures. In such cases, the ges-ture which makes up the majority of the segment is used as the classification. For example the segment labelled “B” in Figure 5 may return the sequence “hammer vice” and would then be assigned as the single gesture “vice.”
5.4
Combining LDA and HMM classification
For each partitioned segment, the classification of the LDA and HMM methods were compared. If the classifications
matched, that classification was assigned the segment. Oth-erwise, the noise class was returned.
0.6 0.8 1 1.2 1.4 1.6 1.8 2 2.2 2.4 2.6
x 104
None Hammer Saw File Drill Sand Grind Screw rawer Vice
cwnd=1000
Data Frame
Gesture
LDA Partition Ground Truth
[image:7.612.319.553.256.481.2]D
Figure 4: LDA partitions versus ground truth
Drawer Hammer Vice
Actual
LDA Partition B
Figure 5: Detailed example of LDA partitioning Table 3 shows the number of correct classifications (C), insertions (I), deletions (D), and substitutions(S) for the HMMs, the LDA, and the combination. Insertions are de-fined as noise gestures identified as a tool gesture. Deletions are tool gestures recognized as noise gestures. A substitu-tion for a gesture occurs when that gesture is incorrectly identified as a different gesture. In addition, the accuracy of the system is calculated based on the following metric:
!"#$%
The accuracies for the HMMs and the LDA are calcu-lated as well as for the combined method. Clearly, the HMMs and LDA each perform better than the other on var-ious gestures and tended to err in favor of a particular ges-ture. When incorrect, LDA tended to report the “screw” gesture. Similarly, the HMMs tended to report “grinding” or “drilling.” Comparing the classification of the LDA and the HMMs help eliminate the false positives and improve the performance of the system. The data shows that the comparison method performed better than the HMMs and the LDA in many cases and improved the accuracy of the system.
Although the accuracy of the system in general is not perfect, it is important to note that the combined HMM + LDA method results in no insertions or substitutions. This result implies that when the system returns a gesture, that gesture, in fact, did occur. While the system still misses some gestures, a user interface designer can know that the system did not return a false positive and be confident in his use of context. This attribute is especially important in the ubiquitous computing and wearable fields which are sensitive to such errors.
6
Conclusion
We have shown a system capable of segmenting and rec-ognizing typical user gestures in a workshop environment. The system uses wrist and chest worn microphones and accelerometers and leverages the feature attributes of each modality to improve the system’s performance. The system demonstrated perfect performance in isolated gesture test-ing and a zero false positive rate in the continuous case. In the future, we hope to apply these promising techniques for recognizing everyday gestures in more general scenarios.
References
[1] D. Abowd, A. K. Dey, R. Orr, and J. Brotherton. Context-awareness in wearable and ubiquitous computing. Virtual
Reality, 3(3):200–211, 1998.
[2] L. Bass, D. Siewiorek, A. Smailagic, and J. Stivoric. On site wearable computer system. In Proceedings of ACM CHI’95
Conference on Human Factors in Computing Systems,
vol-ume 2 of Interactive Experience, pages 83–84, 1995. [3] M. C. B¨uchler. Algorithms for Sound Classification in
Hear-ing Instruments. PhD thesis, ETH Zurich, 2002.
[4] B. Clarkson and A. Pentland. Extracting context from envi-ronmental audio. In 2nd Int’l Symposium on Wearable
Com-puters, pages 154–155, Oct. 1998.
[5] B. Clarkson, N. Sawhney, and A. Pentland. Auditory context awareness in wearable computing. In Workshop on
Percep-tual User Interfaces, Nov. 1998.
[6] R. Duda, P. Hart, and D. Stork. Pattern Classification,
Sec-ond Edition. Wiley, 2001.
[7] J. H. Garrett and A. Smailagic. Wearable computers for field inspectors: Delivering data and knowledge-based support in the field. Lecture Notes in Computer Science, 1454:146– 164, 1998.
[8] N. Kern, B. Schiele, H. Junker, P. Lukowicz, and G. Tr¨oster. Wearable sensing to annotate meeting recordings. In 6th
Int’l Symposium on Wearable Computers, pages 186–193,
Oct. 2002.
[9] F. Kubala, A. Anastasakos, J. Makhoul, L. Nguyen, R. Schwartz, and G. Zavaliagkos. Comparative experiments on large vocabulary speech recognition. In ICASSP, Ade-laide, Australia, 1994.
[10] P. Lukowicz, H. Junker, M. Staeger, T. von Bueren, and G. Troester. WearNET: A distributed multi-sensor sys-tem for context aware wearables. In G. Borriello and L. Holmquist, editors, UbiComp 2002: Proceedings of
the 4th International Conference on Ubiquitous Computing,
pages 361–370. Springer: Lecture Notes in Computer Sci-ence, Sept. 2002.
[11] J. Mantyjarvi, J. Himberg, and T. Seppanen. Recognizing human motion with multiple acceleration sensors. In 2001
IEEE International Conference on Systems, Man and Cyber-netics, volume 3494, pages 747–752, 2001.
[12] V. Peltonen, J. Tuomi, A. Klapuri, J. Huopaniemi, and T. Sorsa. Computational auditory scene recognition. In
IEEE Int’l Conf. on Acoustics, Speech, and Signal Process-ing, volume 2, pages 1941–1944, May 2002.
[13] L. R. Rabiner and B. H. Juang. An introduction to hidden Markov models. IEEE ASSP Magazine, pages 4–16, January 1986.
[14] C. Randell and H. Muller. Context awareness by analysing accelerometer data. In Digest of Papers. Fourth
Interna-tional Symposium on Wearable Computers., pages 175–176,
2000.
[15] M. St¨ager, P. Lukowicz, N. Perera, T. von B¨uren, G. Tr¨oster, and T. Starner. Soundbutton: Design of a low power wear-able audio classification system. Submitted to 7th Int’l Sym-posium on Wearable Computers, 2003.
[16] T. Starner, J. Makhoul, R. Schwartz, and G. Chou. On-line cursive handwriting recognition using speech recogni-tion methods. In ICASSP, pages 125–128, 1994.
[17] T. Starner, B. Schiele, and A. Pentland. Visual contextual awareness in wearable computing. In IEEE Intl. Symp. on
Wearable Computers, pages 50–57, Pittsburgh, PA, 1998.
[18] T. Starner, J. Weaver, and A. Pentland. Real-time Amer-ican Sign Language recognition using desk and wearable computer-based video. IEEE Trans. Patt. Analy. and Mach.
Intell., 20(12), December 1998.
[19] K. Van-Laerhoven and O. Cakmakci. What shall we teach our pants? In Digest of Papers. Fourth International
Sym-posium on Wearable Computers., pages 77–83, 2000.