Enhancing the crop yield through capacity building
programs: Application of double difference method
for evaluation of drip capacity building
program in Tamil Nadu State, India
Kuppannan Palanisami1*, Coimbatore RamaRao Ranganathan2, Devarajulu Sureshkumar2, Ravinder Paul Singh Malik3
1
International Water Management Institute, Hyderabad, India; *Corresponding Auth
2
International Water Management Institute, New Delhi, India
3
Tamil Nadu Agricultural University, Coimbatore, India
Received 28 June 2013; revised 12 December 2013; accepted 23 December 2013
Copyright © 2014 Kuppannan Palanisami et al. This is an open access article distributed under the Creative Commons Attribution License, which permits unrestricted use, distribution, and reproduction in any medium, provided the original work is properly cited. In accordance of the Creative Commons Attribution License all Copyrights © 2014 are reserved for SCIRP and the owner of the intellectual property Kuppannan Palanisami et al. All Copyright © 2014 are guarded by law and by SCIRP as a guardian.
ABSTRACT
A capacity building program on drip irrigation (TNDRIP) was undertaken in certain regions of the Indian State of Tamil Nadu during 2009-2010. An assessment of the impact of the program in terms of effective use of drip irrigation and in-creased crop yields was made in 2011 by ap-plying double difference method (a combination of both with and without and before and after approaches). The results had indicated that the drip capacity building program resulted in a yield increase of 2.5 t/ha for Banana 1, 1.9 t/ha for Banana 2, 3.3 t/ha for sugarcane and 0.3 t/ha for turmeric. The conventional method using the before and after situations had shown a yield increase of 4.3 t/ha for Banana 1, 12.1 t/ha for Banana 2, 40.6 t/ha for sugarcane and 2.6 t/ha for turmeric. The conventional approach is highly upward biased in estimating the impact of the drip capacity building program and thus the double difference method will be an appropriate method to evaluate the impact of the programs that involve both with and without as well as before and after situations.
KEYWORDS
Drip Irrigation; Double Difference Method; Impact Evaluation
1. INTRODUCTION
Water is becoming increasingly scarce resource and limiting agricultural development in many developing and developed economies across the world. It is esti-mated that around 50 percent of the increase in demand for water by the year 2025 can be met by increasing the effective use of irrigation water [1]. In India, almost all the easily possible and economically viable irrigation water potential has already been developed, but the de-mand for water for different sectors has been growing continuously [2,3]. Moreover, the water use efficiency in the agricultural sector, which still consumes over 80 per-cent of water, is only in the range of 30 - 40 perper-cent, in-dicating that there is considerable scope for improving the water use efficiency.
One of the important demand management mechan-isms vigorously promoted is the adoption of micro irri-gation technologies such as drip and sprinkler methods of irrigation. Many researchers have attempted to study the impact of drip irrigation in improving water use effi-ciency [4-13]. These studies, by and large, show that the adoption of micro irrigation has produced desired results. The water use efficiency increased up to 100 per cent in a properly designed and managed drip irrigation system [14,15]. Drip method of irrigation helps to reduce the over-exploitation of groundwater that partly occurs be-cause of inefficient use of water under surface method of irrigation. Environmental problems associated with the surface method of irrigation like water logging and salin-ity are also completely absent under drip method of irri-gation [5].
In addition, drip method helps in achieving reduction in tillage requirement, higher quality products, increased crop yields and higher fertilizer use efficiency [7,11,16]. In addition to the private benefits, the drip irrigation ge-nerates substantial social impacts in the forms of en-hanced food security, women participation in agriculture
dy indicates that drip irrigation has generated substantial social benefits to the society [18].
Though the potential benefits generated by the drip ir- rigation method are apparent, the adoption of drip irriga- tion is yet to be widely promoted across different regions and states in India. Several factors such as huge initial investment, small size of holding, lack of technical sup- port, nature of cropping pattern, access to water and so- cio-economic conditions of farmers etc., are found to be the major factors influencing adoption of drip irrigation [11,19]. In some cases, even after the adoption of drip ir- rigation, the farmers, particularly, the small farmers have often discontinued the use of drip irrigation for several reasons such as lack of proper maintenance, changes in crop pattern and unreliable water supply [12]. A study in Coimbatore district of Tamil Nadu State found that huge initial investment and small size of holding are the major constraints limiting the adoption of drip technology (100 per cent of farmers), as lack of access to subsidy (46.87 per cent of famers) and lack of technical support for fol-low up actions (28.85 per cent of farmers) [20].
To minimise dis-adoption rate of drip irrigation by farmers, the International Water Management Institute (IWMI) under its IWMI-TATA Water Policy Program initiated a capacity building program in certain regions of the Indian State of Tamil Nadu. The present paper attempts to make an assessment of the impact of the ca-pacity development program mainly on use of drip irri-gation in improving crop yields.
Hypotheses: The following hypotheses were tested in this study.
• Drip capacity building will enhance the yield of
crops compared to drip irrigation alone. • Appropriate evaluation methods will capture
ex-actly the impact of the capacity building program.
2. CAPACITY BUILDING PROGRAM ON
DRIP IRRIGATION
Realising the significance of drip maintenance prac-tices, drip irrigation capacity building and management initiative for maximizing productivity and income (TNDRIP) was conceived and implemented by Interna-tional Water Management Institute (IWMI) under the IWMI-TATA water policy program jointly with the Water Technology Centre (WTC) of the Tamil Nadu Agricul-tural University (TNAU) and Jain Irrigation Systems Limited (JISL) in Coimbatore district, Tamil Nadu state, Indiaduring 2009-2010. The objective of TNDRIP is to sustain the drip irrigation through increased adoption and proper drip maintenance practices by the farmers in order to achieve increased crop yields.
The program was implemented in 100 villages cover-ing about 1000 farmers who have adopted the drip irriga-tion already for various crops.A base line survey was conducted to know the current level of use of drip irriga-tion, inputs used and crop yields. The main part of the capacity building program was one day training which was organized in each village where farmers with differ-ent crops and farm sizes actively participated. The field based training was given by the field technicians of the WTC and JISL through lectures, hand-on exercises with the drip systems, demonstrations of the various drip ma-terials and question-answer sessions.
The contents of the training mainly focused on the op-eration and maintenance practices of drip irrigation sys-tem besides fertigation and irrigation scheduling practic-es. In addition, the farmers were given hand outs and booklets (in local language) regarding fertigation, drip demonstrationsand cleaning (sand filters, PVC pipes (sub-mains and laterals, screens and disc filters) drip system using acid. This helped the farmers in a big way to learn the drip and fertigation technologies and their periodical maintenance.
3. METHODOLOGY
3.1. Impact of Technology on Crop Yield and the Evaluation of the Technology Impact
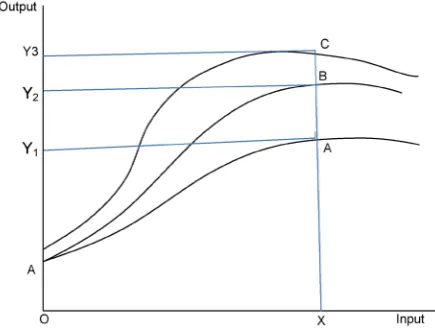
level can be reached with fewer inputs with improved technology. Consider the Figure 1, where curve AA re-fers the traditional irrigation technology production func- tion, curve AB refers the improved (drip) technology production function and curve AC refers the improved drip technology with capacity building. With X units of water, traditional technology produces Y1 units of output,
improved (drip) technology produces Y2 units of output
where as improved technology with capacity building produces Y3 units of output. The difference between Y2
and Y3 is the additional output due to capacity building.
3.2. Impact Evaluation Using Double-Difference Method
Several tools or approaches are used for impact evalu-ation. The most commonly used tools are the financial measures like the benefit-cost (B-C) ratio and internal rate of return (IRR) [11,19,21,22]. The major problems with this approach is that the benefits and costs are cal-culated using either before and after or with and without concept which ignores some of the benefits that are con-sidered as residual which may occur even without the intervention such as drip irrigation. Hence an approach that considers both with and without as well as before and after situations is important.
[image:3.595.63.281.510.676.2]The approach of any analysis of impact can be accom-plished into two ways. Firstly, “with project” parameters compared to the “pre-project” situation gives the incre-mental benefits due to the project. But these increments in the parameters intrinsically include the changes due to state of art of technology. Thus sometimes, the benefits may be exaggerated. Secondly, the literature on project analysis unanimously suggests the use of comparison between the “project parameters” with the “non-project
Figure 1. Technology adoption and crop yield. Note: AA refers the production function with traditional irrigation technology, AB refers the production function with improved (drip) tech-nology; AC refers the production function with improved (drip) technology along with capacity building.
control region’. This method automatically incorporates the correction for the impact of technology in the ab-sence of the project. For the present study, the informa-tion were collected for the pre and post-project period and compared with the control as well. Hence, the ap-proach is a combination of both with and without and before and after approaches i.e. double difference me-thod (Table 1).
Farm level data were collected from both types of drip farmers i.e. who have participated in the capacity build-ing program and who have not participated. This enables the use of the double difference method to study the im-pact of the drip capacity building program. The frame-work was adopted from the program evaluation literature [23,24].
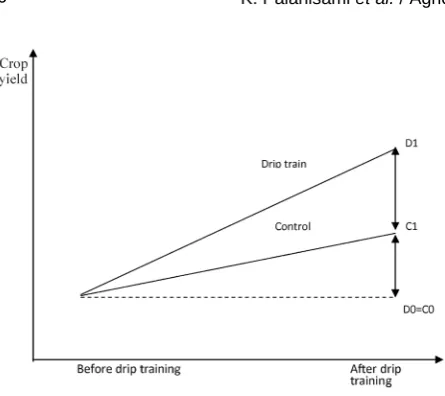
The resulting measures can be interpreted as the ex-pected effect of implementing the drip capacity building program. The columns distinguish between groups with and without the program and the rows distinguish be-tween before and after the program. Before the capacity building program, one would expect the average yield of different crops be similar for the two groups, so that the quantity (D0 - C0) would be close to zero. Once the ca-pacity building program has been implemented, however, one would expect differences between the groups as a result of the improvement in knowledge of the farmers about the drip maintenance, fertigation and irrigation scheduling due to the program. The impact of the pro-gram, however, would be better assessed considering any pre-existing observable or unobservable differences be-tween the two randomly assigned groups i.e. the double- difference estimate, which is obtained by subtracting the preexisting differences between the groups, (D0 - C0), from the difference after the program has been imple-mented, (D1 - C1) [23]. This is best explained in Figure 2.
Double Difference (DD) methodology is becoming a popular tool for studying the impact analysis as it has the advantage to control for the time-invariant characteristics of farmers when comparing adopters and non-adopters of a technology or a capacity building program. In this me-thodology, the average impact of a capacity building program is computed by the formula
Tab le 1. Double difference method of impact assessment of drip capacity building.
Particulars Drip
Participants Non-participants
Difference across groups
After drip
training D1 C1 D1 - C1
Before drip
training D0 C0 D0 - C0
Difference
across time D1-D0 C1-C0
[image:3.595.311.538.651.737.2]Figure 2. Illustration of impact of capacity building program by double difference method.
( )
(
1 0 1) (
1 0 1)
Double Difference DD
| 1 | 0
T T c c
E Y Y T E Y Y T
= − = − − = (1)
where T t
Y and C t
Y respectively denote the outcome responses for the trained and control groups at period
(
0,1)
t = where the time period t = 0 corresponds to the period before program implementation and the period t = 1 corresponds to after program implementation. Further, T1 = 1 means presence of the program at time t = 1 and
T1 = 0 means absence of the program. The first term in
Equation (1) represents the average difference between before-after for the trained group and hence it is given by
(
1 0 1)
(
1 0)
1 01
| 1
T T
i i T T
i T T
E Y Y T Y Y y y
N ε
− = =
∑
− = − (2)Similarly for the control group, the second term is given by
(
1 0 1)
(
1 0)
1 01
| 0
c c
j j c c
j c c
E Y Y T Y Y y y
N ε
− = =
∑
− = − (3)Substituting these values in (1), the impact of the pro-gram can be obtained as
(
1 0) (
1 0)
Impact= yT −yT − yc −yc (4)
The same results can be obtained by following a re-gression approach as follows:
For each observation i, let us define a variable δi as 0
i
δ = if the observation is from the control group and 1
i
δ = if it is from the trainedgroup. Similarly for each observation i define a variable Ti as Ti =0 if the ob-servation belongs to time t = 0, that is before the drip capacity building program and Ti=1 if the observation belongs to time t = 1, that is, after the program. Now form the regression equation,
i i i i i
y = +a bδ +cT +d Tδ (5)
The following results can be easily checked:
Observation belongs to δ T yi Control group before the program 0 0 yC0=a
Control group after the program 0 1 yC1= +a c
Trained group before the program 1 0 yT0= +a b
Trained group after the program 1 1 yT1= + + +a b c d
So using Equation (4)
(
) (
)
(
)
(
(
)
)
Impact of the program
a b c d a b a c a d
= + + + − + − + − = (6)
4. DATA AND VARIABLES
Out of the targeted 1000 farmers for the training, only 800 farmers actively participated in the training. Out of this, 500 farmers were selected employing random sam-pling procedure to study the impact of the TNDRIP dur-ing November 2011, one year after the program was in-troduced. In order to make a comparative study, 250 drip farmers in these villages who have not participated in the capacity building program were selected as control. Thus, a sample of 750 farmers was covered for the impact stu- dy. The needed information from the respondents was gathered personally administering the interview schedule. The primary information collected from the farmers in- cluded mainly the farm size, cost of wells, cost of drip ir- rigation system, crops grown, maintenandce costs, ground- water use, crop production including inputs used and crop yields, adoption of drip irrigation practices and the constraints in using the drip irrigation. In addition, the details of the trainings attended and subject matter learnt during the training program were collected from the res- pondents.The base line data collected in 2009 wasalso used for cross checking the inputs used and crop yields of the farmers prior to training.
5. RESULTS AND DISCUSSIONS
5.1. General Characteristics of the FarmHouseholds
[image:4.595.62.285.63.261.2]average farm size was comparatively high under partici-pants of the drip training. However, cropping intensity and irrigation intensity are more or less same among the participants of drip training and control farmers (Table 2).
5.2. Awareness and Adoption of Drip Maintenance
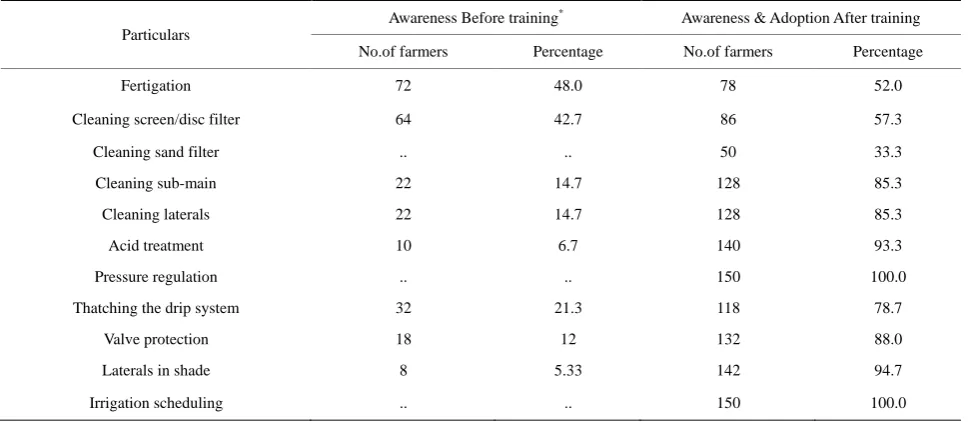
The capacity building program has created adequate awareness about various drip management practices. The perception of the trainees about the important drip man-agement and maintenance activities before their partici-
pation in the training revealed that most of them were aware about the fertigation practice (48%) followed by the cleaning of screen/disc filters (42.7%). Many farmers (5% to 21%) were aware about the practices like clean-ing the sub-mains and laterals, acid treatment, protectclean-ing the drip system, valve protection and placing the laterals under shade. However, no one was aware about the im- portant practices like cleaning the sand filter, pressure regulation in the laterals and irrigation scheduling to various crops before attending the training program (Table 3).
After undergoing the training program all the trainees
Tab le 2.General characteristics of the sample farmers.
Particulars Participants of drip training (N = 500) Control (N = 250)
Average farm size (ha) 3.41*** 2.58
Net sown area (ha) 3.31*** 2.43
Gross cropped area (ha) 3.86*** 2.79
Cropping intensity (%)a 116.6*** 114.8
Net irrigated area (ha) 2.97*** 2.18
Gross irrigated area (ha) 3.26*** 2.38
Irrigation intensity (%)b 109.8*** 109.2
Percentage of area irrigated by wells to the total cropped area (%) 84.5 85.3
Percentage of area irrigated under drip to gross cropped area (%) 67.1 64.8
Percentage of area irrigated under drip to gross irrigated area (%) 79.5 75.9
Source: Field survey. Notes: ***indicates values are significantly different at 1 per cent levels from the corresponding values of control farmers. aCropping
intensity is defined as the ratio of gross cropped area to net sown area and is expressed as a percentage; bIrrigation intensity is the ratio of gross irrigated area to
net irrigated area and is expressed as a percentage.
Tab le 3.Impact of capacity building on farmers’ awareness and adoption of various practices.
Particulars
Awareness Before training* Awareness & Adoption After training
No.of farmers Percentage No.of farmers Percentage
Fertigation 72 48.0 78 52.0
Cleaning screen/disc filter 64 42.7 86 57.3
Cleaning sand filter .. .. 50 33.3
Cleaning sub-main 22 14.7 128 85.3
Cleaning laterals 22 14.7 128 85.3
Acid treatment 10 6.7 140 93.3
Pressure regulation .. .. 150 100.0
Thatching the drip system 32 21.3 118 78.7
Valve protection 18 12 132 88.0
Laterals in shade 8 5.33 142 94.7
Irrigation scheduling .. .. 150 100.0
*
[image:5.595.58.542.259.448.2] [image:5.595.57.545.505.716.2]were aware about all the important practices and started adopting them. Hence, it could be inferred that the TNDRIP training has remained as the only source to provide first hand information and created awareness about the maintenance practices such as pressure regula-tion, irrigation scheduling, acid treatment and advantages of placing the laterals under shade. However, only one- third of the trainees were aware of the practice of clean-ing the sand filter even after undergoclean-ing the trainclean-ing. The overall picture had indicated that the TNDRIP training has made significant impact among farmers in adopting the drip maintenance practices in a better manner than before.
5.3. Benefits Perceived by the Farmers Due to the Adoption
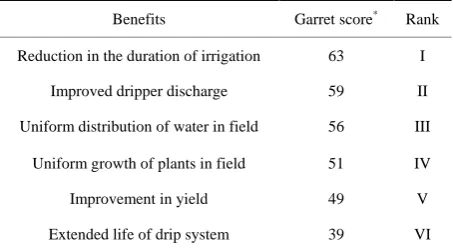
The adopters of drip maintenance practices were en-quired about the overall benefits they perceived due to the adoption of the drip maintenance practices in their farm. They were asked to rank their responses. The adopted farmers had altogether perceived and ranked six benefits due to the adoption of the maintenance practices taught in the training (Table 4). Among these, the top three benefits that were perceived and ranked were the reduction in the duration of irrigation, improved dripper discharge and achievement of uniform distribution of water in the field.
(
)
Percent Position=100 Rij−0.5 Nj
where,
ij
R = Rank given for the ith factor by the jth respon-dent, and
j
N = Number of factors ranked by the jth respondent. The benefit namely, uniform growth of plants in the field was perceived and ranked as fourth by the adopters. All these four benefits were interlinked due to the better maintenance practices adopted by the farmers.
The fact that was endorsed by majority of the adopters was that there was reduction in the duration of irrigation
Tab le 4. Farmers’ perception about the benefits due to drip maintenance.
Benefits Garret score* Rank
Reduction in the duration of irrigation 63 I
Improved dripper discharge 59 II
Uniform distribution of water in field 56 III
Uniform growth of plants in field 51 IV
Improvement in yield 49 V
Extended life of drip system 39 VI
*Garret scores [25], were worked out using the following formula.
to an extent of up to 30 per cent than it was observed without the adoption of the maintenance practices. Hence this particular benefit was ranked as first by the adopters. The regular cleaning and maintenance of filters, sub- mains and laterals might have rendered free flow of wa-ter through the drip system effectively. The adopwa-ters used pressure gauge to regulate the pressure in the sub-mains and laterals as per the recommendations. This particular action had resulted in ensuring uniform distribution of water throughout the field thus promoting uniform growth of plants also. These benefits were observable and hence most of the farmers had perceived such bene-fits.
The other two benefits that were perceived and ranked in the last order by the adopters were improvement in yield of crops and extended life expected over the drip system due to adoption of regular maintenance practices. The adopters had recorded an increase in yield up to 10 per cent across various crops. Although this change in yield is negligible, it has been perceived by some farmers and hence ranked fifth. Anticipation over the extended life of the drip system was perceived and ranked last as it was not observed by the adopters but still they believed the benefit.
Sharing or recommending the learnt technologies to peers is considered as a social impact indicator of the TNDRIP project. Hence the information sharing behavior of the farmers was studied. Of the total number of 500 farmers studied, 70 per cent of the farmers shared their information to others and 30 per cent farmers have not shared their information. Among the farmers shared their information, 52.38 per cent of farmers had shared to their own family members and the remaining 47.62 per cent of farmers shared to other fellow farmers. This showed that the penetration of the drip fertigation technologies, their maintenance and management will be possible through capacity building programs.
5.4. Impact of Capacity Building Program
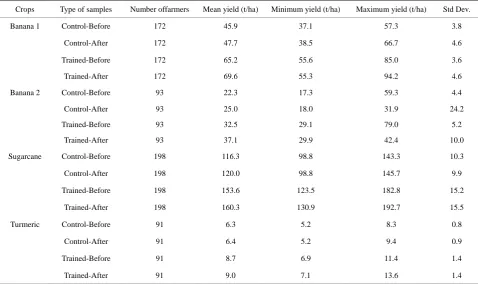
Here our aim is to examine whether the capacity build- ing program has generated any impact on yield of crops. The capacity building program not only created adequate knowledge on drip maintenance activities but also on irrigation scheduling and fertigation which would help to increase crop productivity. The details of the mean yield of crops under different farmer samples had indicated that crop yields were comparatively high for farmers who were trained in drip system operation and mainten-ance (Table 5).
[image:6.595.59.286.597.722.2]Tab le 5. Crop yields under different farmer samples.
Crops Type of samples Number offarmers Mean yield (t/ha) Minimum yield (t/ha) Maximum yield (t/ha) Std Dev.
Banana 1 Control-Before 172 45.9 37.1 57.3 3.8
Control-After 172 47.7 38.5 66.7 4.6
Trained-Before 172 65.2 55.6 85.0 3.6
Trained-After 172 69.6 55.3 94.2 4.6
Banana 2 Control-Before 93 22.3 17.3 59.3 4.4
Control-After 93 25.0 18.0 31.9 24.2
Trained-Before 93 32.5 29.1 79.0 5.2
Trained-After 93 37.1 29.9 42.4 10.0
Sugarcane Control-Before 198 116.3 98.8 143.3 10.3
Control-After 198 120.0 98.8 145.7 9.9
Trained-Before 198 153.6 123.5 182.8 15.2
Trained-After 198 160.3 130.9 192.7 15.5
Turmeric Control-Before 91 6.3 5.2 8.3 0.8
Control-After 91 6.4 5.2 9.4 0.9
Trained-Before 91 8.7 6.9 11.4 1.4
Trained-After 91 9.0 7.1 13.6 1.4
Note: Banana-1: Variety robusta; Banana-2: Variety Nendran.
Tab le 6. Impact of capacity building intervention in drip irrigation.
Observation belongs to Banana 1 Banana 2 Sugarcane Turmeric
Control group before the program (a) 45.9 22.3 116.4 6.3
Control group after the program (a + c) 47.7 32.5 153.6 8.7
Trained group before the program (a + b) 65.3 25.0 119.9 6.4
Trained group after the program (a + b + c + d) 69.6 37.1 160.5 9.0
Net impact due to capacity building intervention (=d) 2.5 1.8 3.3 0.3
gram. For instance, the yield of banana 1 was 45.9 t/ha for the control farmers before the training period. The yield of Banana 1 for the same set of farmers after the training period was 47.7 t/ha, thus the increase in yield of Banana 1 even among the farmers who have not partici-pated in the capacity building program was 1.8 t/ha.
This increase in yield might be due to the experience, cumulative knowledge gained by the farmers, use of bet-ter quality of inputs, technological growth and so on. Similarly, the above yields for the trained farmers (i.e. farmers who have participated in the capacity building program) were 65.3 t/ha and 69.6 t/ha respectively, lead-ing to a difference of 4.3 t/ha. However, our interest here is to assess mainly the yield increase attributed to the capacity building program. The double difference me-thod captured this yield increase as 2.5 t/ha (i.e. 4.3t/ha -
1.8t/ha). Similarly, the yield increase due to the training was calculated for other crops as shown in Table 6.
The results of the double-difference method using the regression analysis are presented in Table 7 It is seen that the drip capacity building program had significant impact on yield of crops such as Banana 1 and sugarcane. The technological growth indicated by time (T) had sig-nificant impact on crop yield in all the crops as evident from the coefficients of “T” which were significant for all crops.
[image:7.595.58.537.102.386.2]Tab le 7.Results of the regression analysis on impact of capacity building program on crop yield.
Crops Constant δ T δ T Adjusted R-Squared
Banana 1 45.887 19.366*** 1.847*** 2.542*** 0.86
(144.75) (43.19) (4.12) (4.01)
Banana 2 22.274 2.750 10.267*** 1.767 0.15
(15.88) (1.387) (5.178) (0.630)
Sugarcane 116.404 3.574*** 37.219*** 3.285* 0.69
(126.24) (2.74) (28.54) (1.78)
Turmeric 6.298 0.119 2.365*** 0.265 0.53
(51.04) (0.68) (13.55) (1.07)
Note: Figures in parentheses indicate estimated “t” ratios. ***Significant at 1% level; *Significant at 10% level.
cant difference between yield of trained andcontrol far-mers in the base period. Similarly, there is a significant increase in yield due to time period among the control farmers. It is evident that 1.8 t/ha increase in yield was realised over time period among the control farmers. The impact of capacity building programwas significant on the expected positive line which showed that the capacity building programalone has increased the crop yield by 2.5 t/ha.
5.5. Novelty and Merit of the Double Difference Method
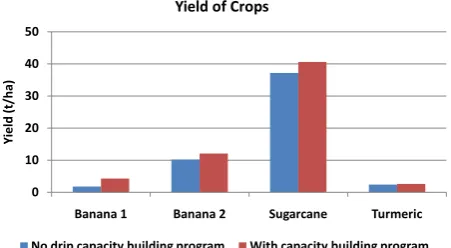
[image:8.595.56.538.101.257.2] [image:8.595.311.537.282.406.2]The novelty of the double difference method is that it is simple and appropriate method in capturing the yield increase due to capacity building program alone. The double difference method has estimated the impact of the drip capacity building program interms of yield increase as 2.5 t/ha for Banana 1, 1.9 t/ha for Banana 2, 3.3 t/ha for sugarcane and 0.3 t/ha for turmeric. In the absence of the double difference method, the impact of the drip ca-pacity building program interms of yield increase was 4.3 t/ha for Banana 1, 12.1 t/ha for Banana 2, 40.6 t/ha for sugarcane and 2.6 t/ha for turmeric (Table 8 and Figure 3). Thus the conventional approach is highly up-ward biased by over-estimating the impact of the capaci-ty building program. Thus the merit of the double differ-ence method is very clear from the results of the analysis. The results further confirmed the hypotheses that drip capacity building will increase the crop yield and the use of appropriate quantification method (double difference method) will capture the exact impact of the capacity building program.
The results of the double difference method could fur-ther enhance the richness of measurement methodologies in impact evaluation. Hence future impact studies could find this an interesting and valuable tool in impact evalu-ation of the technologies where time period is a major
Figure 3. Impact of drip capacity building program on crop yield.
player along with the technologies. For example, in sev-eral cases, farmers could be able to increase their crop yield over time due to better management. Thus the ap-proach could help in decomposing the yield increase due to capacity building intervention and time period (man-agement) as well.
5.6. Constraints in Adoption of Drip Maintenance Activities
During the survey it was found that there are several factors that limited the adoption of maintenance practices. One of the constraints for adoption of the maintenance practices was the insufficient knowledge about the re-levance of pressure regulation in the drip irrigation sys-tem. Farmers were not aware about the use of pressure gauge in the laterals to maintain uniform pressure so that the water would flow through the system effectively. The farmers believed that use of Hydro Chloric (HCl) acid treatment in the drip system would affect the soil health and crop growth and hence feared to adopt the acid treatment technology for removing the blockage/salt en-crustation in the drip system. Most of the farmers also felt that they were ignorant about the maintenance
pack-0 10 20 30 40 50
Banana 1 Banana 2 Sugarcane Turmeric
Yi
el
d (
t/
ha
)
Yield of Crops
age to be adopted for the drip system which acted as one of the constraints for its adoption. Hence the lack of knowledge and understanding of the farmers about the drip and its maintenance practices itself remained as constraints for its adoption (Table 9).
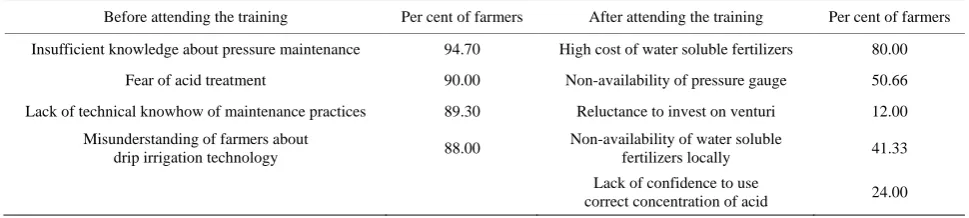
Farmers were asked to express the factors that re-mained as constraints to the adoption of the maintenance practices. The findings revealed that a majority of the trained farmers (80%) expressed high cost of the water soluble fertilizers as the major constraint. About half of them revealed that non-availability of pressure gauge was one of the constraints.
It is a fact that pressure gauge apparatus was not sold commonly in the shops located in rural/town areas. This was perceived as one of the reasons for non-adoption of the maintenance practices. Some farmers (12%) were reluctant to invest on the venturi unit which is needed for the adoption of the fertigation and acid treatment as well. About 41 per cent of them stated the non-availability of water soluble fertilizers in the local village/town market remained as one of the reasons for non-adoption of ferti-gation practice even though they had been supplied with the fertilizer tank on subsidy basis by the Government of Tamil Nadu. One-fourth of the farmers (24%) expected the assistance of the extension or development staff to adopt acid treatment technology in their farms as they were not very confident in adopting the technology on their own. These constraints need to be addressed in the future training programs.
6. CONCLUSIONS AND
RECOMMENDATIONS
TNDRIP training has brought out significant impact
among farmers to adopt the drip maintenance practices in varied proportions. Practices such as cleaning the filters, sub-mains and laterals, pressure regulation, acid treat-ment, thatching the drip system, placing the laterals in shade etc. were adopted by a majority of the trainees as a result of their participation in the training. The study re-vealed that a majority of the farmers (70%) had shared the information about the drip maintenance practices to their family members and other fellow farmers.
It is found that the drip capacity building program has produced significant impact on yield of crops such as banana and sugarcane. Drip farmers with training has increased their crop yield by 138 % under Banana 1, 19% under Banana 2, 9% under sugarcane and 13% under turmeric crops indicating that compared to drip irrigation alone, drip with capacity building helped them to exploit the full potential of drip irrigation. Compared to the cost of the training (Rs 110/ha), the additional yield has re-sulted in an additional per ha gross margin of Rs. 14,000, Rs. 32,015, Rs. 1650, and Rs. 14,893 per year respec-tively under Banana 1, Banana 2, Sugarcane and turmer-ic. Given this cost effectiveness of the capacity building program, it is suggested to introduce more number of drip capacity building programs across regions so as to achieve more crop per drop of water. The development departments such as Department of Agriculture, Horti-culture, and Agricultural Engineering may be geared up to follow up with similar kind of capacity building pro-grams across the regions. This will further have multip- lier impact in terms of bringing new farmers under drip irrigation as well as effective use of fertilizers. By estab-lishing such training programs in the rural areas, local expertise in terms of entrepreneur development through public private partnership can also be developed.
Tab le 8. Comparison of crop yields under drip and drip with capacity building.
Crops Increase in yield of drip farmers without training (t/ha)
Increase in yield of drip farmers with training (t/ha)
Increase in yield due to training alone (t/ha)
Banana 1 1.8 4.3 2.5
Banana 2 10.3 12.1 1.8
Sugarcane 37.2 40.5 3.3
Turmeric 2.4 2.7 0.3
Tab le 9. Constraints in adoption of the drip maintenance activities.
Before attending the training Per cent of farmers After attending the training Per cent of farmers
Insufficient knowledge about pressure maintenance 94.70 High cost of water soluble fertilizers 80.00
Fear of acid treatment 90.00 Non-availability of pressure gauge 50.66
Lack of technical knowhow of maintenance practices 89.30 Reluctance to invest on venturi 12.00
Misunderstanding of farmers about
drip irrigation technology 88.00
Non-availability of water soluble
fertilizers locally 41.33
Lack of confidence to use
[image:9.595.56.545.515.599.2] [image:9.595.55.540.628.737.2]ACKNOWLEDGEMENTS
This study was conducted under the IWMI-Tata Water Policy Pro- gram supported by International Water Management Institute (IWMI) and Sir Ratan Tata Trust (SRTT). We acknowledge the support pro- vided by our project partners, Dr S. Chellamuthu, Director and Dr C. Mayilswami, Professor of the Water Technology Centre of Tamil Nadu Agricultural University and Dr S. Narayanan, Vice President of the Jain Irrigation Systems, Coimbatore.
REFERENCES
[1] Seckler, D., Molden, U.A.D., de Silva, R. and Barker, R. (1998) World water demand and supply, 1990 to 2025: Scenarios and Issues. Research Report 19, International Water Management Institute (IWMI), Colombo, Sri Lan- ka.
[2] Saleth, R.M. (1996) Water institutions in India: Econom-ics, law and policy. Commonwealth Publishers, New Delhi.
[3] Vaidyanathan, A. (1999) Water resources management: Institutions and irrigation development in India. Oxford University Press, New Delhi.
[4] Magar, S.S., Firke, N.N. and Kadam, J.R. (1988) Impor-tance of drip irrigation. Sinchan, 7, 61-62.
[5] Narayanamoorthy, A. (1997) Drip irrigation: A viable option for future irrigation development. Productivity, 38, 504-511.
[6] Cuykendall, C.H., White, G.B., Shaffer, B.E., Lakso, A.N. and Dunst, R.M. (1999) Economics of drip irrigation for juice grape vineyards in New York State. Department of Agricultural, Resource and Managerial Economic. Col-lege of Agriculture and Life Sciences, Cornell University, Ithaca, New York, 14853-17801.
[7] Qureshi, M.E, Wegener, M.K. Harrison, S.R. and Bristow, K.L. (2001). Economic evaluation of alternate irrigation systems for sugarcane in the burdekin delta in North Queensland, Australia. In: Brebbia,C.A., Anagnostopou-los, K, Katsifarakis, K. and Cheng, A.H.D. Eds., Wat er Resource Management, WIT Press, Boston, 47-57.
[8] Dhawan, B.D. (2002) Technological change in irrigated agriculture: A study of water saving methods. Common-wealth Publishers, New Delhi.
[9] Narayanamoorthy, A. (2003) Averting water crisis by drip method of irrigation: A study of two water intensive crops.
Indian Journal of Agricultural Economics, 58, 427-437. [10] Verma, S., Tsephal, S. and Jose, T. (2004) Pepsee systems:
Grass root innovation under groundwater stress. Wat er Policy, 6, 1-16.
[11] Namara, R.E., Upadhyay, B. and Nagar, R.K. (2005) Adoption and impacts of microirrigation technologies: Empirical results from selected localities of Maharashtra and Gujarat States of India. Research Report 93, Interna-tional Water Management Institute, Colombo, Sri Lanka. [12] Kulecho, I.K and Weatherhead. E.K. (2005) Reasons for
smallholder farmers discontinuing with low cost micro
ir-rigation: A case study from Kenya. Irrigation and Drai- nage Systems, 19, 179-188.
[13] Suresh Kumar, D. and Palanisami, K. (2010) Impact of drip irrigation on farming system: Evidences from South-ern India. Agricultural Economics Research Review, 23, 265-272.
[14] Indian National Committee on Irrigation and Drainage (INCID). (1994) Drip irrigation in India, New Delhi. [15] Sivanappan, R.K. (1994) Prospects of micro-irrigation in
India. Irrigation and Drainage Systems, 8, 49-58. [16] Sivanappan, R.K. (2002) Strengths and weaknesses of
growth of drip irrigation in India. Proceedings of the GOI Short Term Training on Micro Irrigation for Sustainable Agriculture, 19-21 June 2002, Water Technology Centre, Tamil Nadu Agricultural University, Coimbatore. [17] Shah, T., Verma, S., Bhamoriya, V., Ghosh, S. and
Sak-thivadivel, R. (2005) Social impact of technical innova-tions: Study of organic cotton and low cost drip irrigation in the agrarian economy of west Nimar. Region. Interna-tional Development Enterprises (India), Delhi.
[18] Suresh Kumar, D. and Palanisami, K. (2011) Can drip irrigation technology be socially beneficial? Evidence from Southern India. Water Policy, 13, 571-587.
[19] Suresh Kumar, D. (2012) An analysis of economics of adoption of drip irrigation: Some experiences and evi-dences. The Bangladesh Development Studies, (In Press).
[20] Suresh Kumar, D. (2008) Promoting drip irrigation: Where and why? Managing water in the face of growing scarcity, inequity and declining returns: Exploring fresh approaches. The IWMI-Tata Water Policy Program, Se-venth Annual Partners Meet, ICRISAT Campus, Hydera-bad, 108-120.
[21] Narayanamoorthy, A. (2005) Economics of drip irrigation in sugarcane cultivation: Case study of a farmer from Tamil Nadu. Indian Journal of Agricultural Economics, 60, 235-248.
[22] Palanisami, K., Raman, S. and Mohan, K. (2012) Micro- irrigation Economics and Outreach. MacMillan Publish-ers India, New Delhi.
[23] John, M.A. and Flores, R. (2005) Impact evaluation of a conditional cash transfer program: The Nicaraguan Red de Social. Research Report 141, International Food Pol-icy Research Institute, Washington DC.
[24] Pattanayak, K.S. (2009) Rough guide to impact evalua-tion of environmental and development program pro-grams. Sandee Working Paper No.40-09, South Asian Network for Development and Environmental Economics, Nepal.