Munich Personal RePEc Archive
Dairy cattle management: survey on
dairy cattle lactation trend in Sabah
Boniface, Bonaventure and Silip, Jupikely James and
Ahmad, Abdul Hamid
Universiti Malaysia Sabah, Universiti Malaysia Sabah, Universiti
Malaysia Sabah
28 November 2007
Online at
https://mpra.ub.uni-muenchen.de/23781/
1
DAIRY CATTLE MANAGEMENT:
SURVEY ON DAIRY CATTLE LACTATION TREND IN SABAH Bonaventure Boniface1, Jupikely James Silip2, Abdul Hamid Ahmad3
Universiti Malaysia Sabah Beg Berkunci 2073 88999 Kota Kinabalu
Sabah
http://www.ums.edu.my
Abstract
A survey was conducted to obtain information on Sabah dairy cattle lactation length and lactation yield to identify the lactation trend. In the study, 18 farms with 2 types of husbandry practice namely feedlot and grazing were visited. Dairy livestock has became established part of the livestock industry with Friesian-Sahiwal crossbreed, imported from Australia and New Zealand with heredity of 62.5% Friesian 37.5% Sahiwal and 50% Friesian 50% Sahiwal respectively. Local born cattle are referred as Sabah Sahiwal Friesian (SSF). All the cows are milked twice a day. From the results obtained, the average lactation of dairy cow is around 6 liters to 12 liters per day with mean of 8.6 liters per day if there is no lactation failure. The mean for cow milked per lactation is 278 days of length and the mean for total milk yield per lactation is 2489 liters. Incidence of lactation failure happens in certain farm that had just received new imported cows, or happens in individual cow in the herd of lactating cows. The information of the survey has been obtained from selected farmers. Therefore the reliability of the data on certain aspects of dairy livestock was based on experience of farmers who provide the information.
Key word: dairy cattle,Friesian-Sahiwal, lactation length, lactation yield
INTRODUCTION
Lactation is the process of producing milk, occurs in all mammalian species. In fact, the producing of milk following parturition, the process of giving birth, is the sole definition factor in all mammals.
Milk produced by milking cow in the first four days post calving is colostrums and used to feed the newborn calve. This is because colostrums contain vitamin A, calcium and phosphorus as well as antibodies that are essential for the growth
1
Lecturer in School Of Sustainable Agriculture,UMS
2
Lecturer in School Of Sustainable Agriculture,UMS
3
2
and health of the newly born calves. The milk production would increase until peak production 35-50 days after calving. The most ideal lactation length is 305 days or around 10 months. Milking cow with longer or shorter lactation length may cause a decrease in milk production for the following lactation. Milk production per lactation will increases until the fourth lactation or at the age of six years old, when the cow calved (first lactation) at the age of two. When the cow reaches the age of eight, milk production tend to drop. Some suggest that the highest milk production per lactation is at the age of seven.
About one third of world’s cattle are found in tropics. They are of Bos indicus
types and generally their performance is extremely low as compared to the European breeds, Bos taurus in the temperate regions. Poor management, low plan of nutrition, disease and parasites, and low genetic potential are some of the factors associated with this low productivity. On the other hand, the performance of Bos taurus cattle under the tropical environment is far from satisfactory. They are succumbed to combined effect of tropical disease, poor nutrition and climatic stress.
However, Bos taurus cattle play a vital role in the genetic improvement of the local cattle through crossbreeding. The progeny produced by crossbreeding between Bos indicus and Bos taurus cattle, particularly the F1 crossbreeds, has
shown superior performance as compared to either one of the parents. Crossbreeding not only improve the milk yield of the indigenous cattle, but it also produce calves of heavier birth weight and animals with potential for faster weight gain and more beef production under the tropical condition.
The Dairy Cattle Project was started in 1980 in Sabah at the Sebrang Livestock Breed stations in Keningau and Tawau as a direct result of the Malaysia Plan (1981-1985). This project involved small land holders with the intention of forming the dairy industry and thereby increasing urban residents’ income in conjunction with the New Economic Foundation (Salleh, 1989).
Currently Sabah has 113 participants in this programme managing 12,500 cattle throughout Sabah and involves 1.7 million hectares of empty land in Sabah, primarily in the rural areas.
In 2003, Sabah almost reached self sufficiency in dairy production and planned to achieve 100 percent by the end of 2004 (Agriculture Ministry, 2004). The implementation of this program helps participants gain monthly income approximately around RM3, 894 to RM 3,349 per month.
3
The milk products are sold to the Sabah Dairies Sdn Bhd by contract farming which will determine a fixed price. (Basically, Sabah International Dairies Sdn Bhd offers a predetermined price at RM1.00 /litre for each dairy production but due to higher production cost in managing dairy farms, the state government agrees to subsidize RM0.50 for each litre. In other words, each participant will receive RM1.50/litre of milk.)
In this research, the main aspect is to survey on lactation performance of the crossbreed Bos taurus and Bos indicus dairy cattle in Sabah. Previous research by Murugaiyah et. al. (2000) had identified lactation failure in the crossbreed Friesian-Sahiwal dairy cattle in West Malaysia at the stage of the cattle udder. Lactation failure in dictionary means that failing in producing milk. Justification of such incidence in this survey shall be the cattle that failed to produce more than 5 liters per day and produce less than 120 days length per lactation is considered as the characteristics of lactation failure.
The main objectives of the survey are to obtain information on the continuous status of dairy cattle lactation:
i. To identify the dairy cattle lactation trend according to categories with percentage of milk produced at the Sabah dairy farms.
ii. Comparing lactation yield, lactation length and average daily production (ADP) in a lactation at dairy farms.
Table 1: Milk yield according to type of dairy cattle and location Cattle Normal yield (liter) Highest yield (liter)
SSF* 1300-3100 3700 SSF** 2400-5800 6556 NZFS 1500-3500 6002 AFS*** 2405 5500 AFS* 900-2000 2100
AFS** NA NA
Sahiwal 1135-3175 4535 Friesian-
Holstein***
4
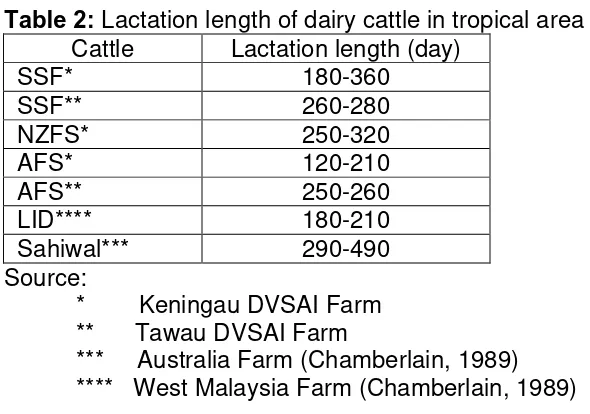
Table 2: Lactation length of dairy cattle in tropical area Cattle Lactation length (day)
SSF* 180-360
SSF** 260-280 NZFS* 250-320
AFS* 120-210
AFS** 250-260 LID**** 180-210 Sahiwal*** 290-490 Source:
* Keningau DVSAI Farm ** Tawau DVSAI Farm
*** Australia Farm (Chamberlain, 1989) **** West Malaysia Farm (Chamberlain, 1989)
METHOD
Survey Site
A survey was conducted on dairy farms in Sabah area, Department of Veterinary Services and Animal Industry (DoVSAI) in Kota Kinabalu, Milk Collecting Centre in Keningau and Ranau. These farms were selected as they are keeping milking record and or the cost for transportations to the location is affordable. The survey covered a period of 3 months, from December 2005 to February 2006. Name of the farms are not stated for confidential purpose.
Data
The method use for this dairy cattle lactation survey is by collecting samples of raw data from farmers that kept their milking record and Animal Department’s milk collecting centre records. The list should include general information such as number or ID of the cattle, date of calving, date of dry, length of lactation, total amount of milk yield, stage or number of lactation, birth date of the cow, first calving, calving interval, total dairy cow that include those lactating and those dry. The ways to collect the raw data is by visiting the farmers and ask for the relevant information, through calling by telephone, e-mail, fax, or posting photo- stated data.
Survey Parameters
The survey collection covers the length and volume of production as the aspect of lactation parameters.
a. Length of Lactation
The length of lactation is from the calving date to dry date. The lactation length is measured in day.
5
b. Volume of Lactation
Volume of lactation is measured in liter. The total volume arrived at by calculation base on the total daily milk records or multiply the total days in the month that lactating with the average of milk produced.
Experimental Design
It is to classify the categories of milk production of the dairy herb population in Sabah and then to compare between the farms. The population shall include those cow that register under government dairy smallholders’ scheme which majority consist of Friesian Sahiwal crossbreed, not include other private dairy practice. The total cows that had record of complete lactation from each farms act as replication are selected for the statistical analysis. This sum up of all the available data is to represent the cow population in Sabah.
The experimental design is to arrange the collected raw data and put them into standard tables. It is so to make every of the tables comparable to each other as the raw samples from the farmers have different pattern of record. The selected samples are according to the month that the cattle calved until the day it dry, so that a trend per lactation can be noted. The lactation curve is then shown in graph. After that, the average yield of total milking cow for the particular farm is calculated to see the lactation trend of the farm. Then, ten cows from each farms act as replication are selected for the statistical analysis.
For the first objective, categories are made according to the production level with percentage. Pie chart is used to show the dairy cattle lactation category. To categorize the milk yield into good, moderate, poor and very good or failure is according to the milk yield level. The category of more than 12 liters is consider as good, between 6 to 12 liters is consider as moderate, and those milk below 6 liters is indicated as poor production.
For the second objective, the total lactation average is compare between the farms. The lactation period analyzed for each milking cow is ten months. Complete lactation means that the cow finish a lactation cycle and starts to dry and not refer to their milking process of reaching the tenth month as indicated.
6
Statistical Analysis
Analysis variance (ANOVA) one-way is used to interpret the data. ANOVA test is used to compare the data lactation length, lactation yield and average of yield per day. The level of significant is P < 0.05. This analysis is done by using SPSS version 13.0 for Windows program software.
Limitations of the survey
The main limitation of the survey was that a previous and continuous recording of dairy livestock in this country was insufficient for sampling purpose. In addition, there was limited numbers of farms that could be surveyed in sufficient detail to permit quantitative comparisons. The records provided by the animal department were not adequate, so additional information from the farmers was obtained to prepare the sampling list.
RESULT AND DISCUSSION
Category of Lactation
Total dairy cattle under the government scheme for smallholders are around 3,638 heads in year 2004. Figure 1 is a pie chart showing categories of milk yield per lactation for ten months or 305-days with n = 108. The milk yield categories ranged from less than 3 liters to exceeding of 15 liters per day.
The most frequent milk yield tend to be in the category of 6 to 9 liters as shown in the green section of the chart, contribute 41% of the milking cow. Followed by category of 9 to 12 liters with 22%, category 3 to 6 liters 18%, category 12 to 15 liters 7% and only 1% of the population are able to produce more than 15 liters of milk per day. While category 3 liters and below stated 11%. So, the current lactation trend of the milking cow in Sabah is in the range of 6 to 12 liters that make up of 63% of the dairy cattle population. 29% produce less than 6 liters and those exceed 12 liters is 8%.
7
Figure 1: Category of milk yield in percentage
[image:8.612.103.489.413.677.2]Figure 2 is a model showing dairy cattle yield per lactation that obtain from the research. The overall total persistency rate is 92.35% or decreasing rate of 7.65%. Referred to Campbell et al. (2003) such persistency performance is categorized as weak.
Figure 2: Model showing trend of dairy cattle milk yield per lactation <3
>3, <6
>6, <9
>9, <12
>12, <15
>15
Milk yield per day (liter) in category
11.11%
17.59%
40.74% 22.22%
7.41% 0.93%
0 2 4 6 8 10 12 14
1 2 3 4 5 6 7 8 9 10
Lactation month
M
il
k
y
ie
ld
p
e
r
d
a
y
(
li
te
8
Lactation amongst Group/Farm
Data that is available for comparison are Farm A year 1991-1990, Farm B and C year 2004-2005 and Farm D year 2005 only. Table 3 show the average milk yield per day of ten months for four farms.
Table 3: Average milk yield according to farm
Average milk yield (liter) in month Farm
1 2 3 4 5 6 7 8 9 10
A 7.55 8.01 7.99 7.05 6.49 6.06 5.20 4.64 3.85 2.41
B 7.40 10.00 10.82 8.40 7.70 7.70 6.60 5.50 4.60 3.92
C 14.08 16.48 14.76 13.70 12.98 12.05 11.25 9.97 8.61 6.56
D 11.80 13.08 12.72 11.38 9.87 9.46 8.47 7.70 6.84 5.72
Average 9.92 11.63 11.32 10.05 9.14 8.74 7.88 6.87 5.85 4.51
[image:9.612.108.349.483.678.2]Lactation Length
Figure 3 show milking days per lactation according to farm. The longest lactation happen in Farm C with mean 337 ±17 days (n=10) compare with the total mean of 278 ±10 days (n =50), Farm A with 261 ±30 days (n =10), Farm B with 247 ±12 days (n =20) and Farm D with 300 ±11 days (n =10). The Post Hoc Tukey statistic analysis indicated a significant difference between Farm A, Farm B and Farm C, whereas Farm D has no significant difference. Farm A and Farm B having lactation of 118 -432 days and 105-335 days respectively. Only 2 cow each from Farm A and Farm B with lactation length less than 120 days showing sign of lactation failure. From Table 2 (Chamberlain, 1989) indicated 120-360 days of lactation for Sahiwal-Friesian cow compare to this result of 105-436 days. Longer or shorter lactation has there own advantage, whereas shorter lactation benefit in annual group production while longer lactation is better for individual cattle.
Figure 3: Length of milking day per lactation according to farm
A B C D
Farm
100 200 300 400
L
a
c
ta
ti
o
n
l
e
n
g
th
(
d
a
y
9
Lactation Yield
Farm C show the highest average milk yield among the farms with total mean of 3,800.71 ±325 liters followed by Farm D with 2,839.95 ±228 liters and Farm A and B with 2,059 ±498 liters and 1,873.10 ±149 liters (Figure 4). The lowest yield is 400 liters whereas the highest recorded is 5,590 liters. The Post Hoc Tukey statistic analysis indicated that there is a significant difference between Farm A, Farm B and Farm C.
Figure 4: Volume of milk yield per lactation according to farm
Average Daily Production
Figure 5 show the average milk yield per lactation according to farm. The highest average yield is from Farm C with mean 11.19 ±0.67 liters per day and the total mean is 8.64 ±0.43 liters per day, followed by Farm D with 9.39 ±0.62 liters whereas Farm A and B record 7.36 ±1.46 liters and 7.62 ±0.48 liters respectively. The lowest average is 2.66 liters per day and the highest yield recorded is 19.48 liters per day. From Post Hoc Tukey statistic analysis, there is a significant difference between Farm A, Farm B and Farm C.
Comparison between levels of lactation cannot be done because the collected data do not provided enough numbers of lactation for each cow. Such data supposedly available as the dairy industries have started since 1980 in sabah. The comparison of performance between SSF, AFS and NZFS is also unavailable because the data identities indicate the genetic of the cow is not clear. Certain farmer recorded the origin of the cow (cow ID) but not the daily activity such as volume of milk produced. While the other farmers keep record of daily milk yield but without identity of individual cow. So, with insufficient information from the farmers prohibit the comparison of milk yield between different species.
A B C D
Farm
1000 2000 3000 4000 5000
T
o
ta
l
la
c
ta
ti
o
n
(
lit
e
[image:10.612.120.361.185.384.2]10
Figure 5: Average Daily Production according to farm
SUMMARY
There are more than a hundred known cattle farms in Sabah. The majority are only owned by small holders starting from small capital and state government subsidies. From the result obtained show that lactation trend of dairy cattle is around 6 -12 liters of average per day if there is no lactation failure. Around ten percent do not reach 3 liters per day (very poor lactation). There is a significant difference amongst the farms. Lactation length range from105-436 days. Total mean for average daily production is 8.64 liters per day. There is a difference of milk production ability among the cattle population. Only a few is able to produce milk more than the average production rate but some produce below the level.
Overall, the production of the cow has not reach the level of satisfaction. It is a need to improve the quality of nutrition especially cow grass as cow is herbivore. There is no history record that the cattle in Sabah encounter serious disease at the time being. It is also noted that farmers do not keep complete and continuous record. So, certain important information could not be obtained instantly. Record keeping is not very encouraging among the farmers as it is not their priority. A complete and continuous record is essential not only for the reference to those who do research but also for the farmers own benefit. With records of information for references, farmers will be able to identify the weakness and strong point for improvement plan and for other future undertakings. Farmers must be encouraged to practice a proper and continuous record keeping.
A B C D
Farm
5.00 10.00 15.00 20.00
L
it
e
r
p
e
r
d
a
y
11
REFERENCE
• Barrett, M.A. and Larkin, P.J., 1977. Milk and Beef in the Tropics. The English Language Book Society and Oxford, Great Britain.
Bernama, 2004. Sabah on its way to being milk exporter. Daily Express, 21 October.
Campbell, J.R., Kenealy, M.D. and Campbell, K.L., 2003. Animal Science, The Biology, Care, and Production of Domestic Animal. 4th ed.. McGraw Hill, New York
Chamberlain, A., 1989. Milk Production in the Tropics. Longman Scientific and Technical, UK.
Davis, R.R., 1962. Pengurusan Moden Lembu Tenusu. Sharifah bt. Yusof (ptrj.), 1987. Dewan Bahasa dan Pustaka.
Edwards, M.D., 1985. Effect of age at first calving and milking system on the lactation performance of F1 Bos indicus/Bos taurus crossbreds in Sabah. Tropical Animal Health Production.17(4):201-8.
Gillespre, J.R., 1997. Modern Livestock and Poultry Production. 5th ed.. Delmar Publishers, America. ms 779-780
Gravert, H.O., 1987. Dairy-Cattle Production. World Animal Science, C3. Elsevier Science Publishers, Netherlands.
Grossman, M. and Koops, W.J., 2003. Modeling Extended Lactation Curves of Dairy Cattle: A Biological Basis for the Multiphasic Approach. Journal of Dairy Science
Handbook of Australian Livestock, 1989. Australian Meat & Livestock Corporation. 3rd ed.
Harding, F., 1995. Milk Quality. Blackie Academic and Professional, Chapman and Hall, Glasgow. ms 3-23
Hatcher, G., Aaker, J. and DeVries, J., 1984. A Planning Guide for Small Scale Livestock Projects. Heifer Project International, Inc., Akansas.
Hayman, R.H., 1972. Bos indicus x Bos Taurus crossbred dairy cattle in Australia. (i) Crossbreeding with selection among filial generation. Aust. J. Agric. Res. 23: 519 - 531.
Hurley, W.L., 2005. Introduction to Lactation Biology. Department of Animal Sciences, University of Illinois.
http://classes.aces.uiuc.edu//AnSci308/intro.html
Kilgour, R. and Dalton, C., 1984. Livestock Behaviour A Practical Guide. Granada, London.
Lingam, S.P., Lingam, R.V. and Rajagobal, K.M., 1977. Performance of Imported Pure Breed Bos Taurus Dairy Animals in Malaysia.
Veterinary Institute Kluang, Johore, Malaysia, 151-161.
Mahadevan, P., 1966. Breeding for milk production in tropical cattle.
Technical communication No.:17. Commonwelt Agric. Bureaux, England. Mak, T.K., Kassim, B. and Yap, R., 1978. Performance of Australian
12
Mason, I.L., 1996. A World Dictionary of Livestock Breeds, Types and Varieties. 4th ed.. C.A.B International. 273 ms.
Murugaiyah, M., Ramakrishnan, P., Omar S.A.R., Knight, C.H. and Wilde, C.J., 2001. Lactation failure in crossbred Sahiwal Friesian cattle. Journal of Dairy Research,United Kingdom, 68 165±174.
Park, R.D., Bowers, R., Coutts, L. dan Hodgkiss, P.J., 1970. Animal Husbandary. 2nd ed.. Oxford University Press, Great Britain.
Rahway, N.J., 1985. Genus Bos: Cattle Breeds of the World. MSO-AGVET, Merck & Co., Inc.
Rajagobal, K.M., 1975. Crossbreeding for milk production. Symposium on Bridging the Dairy Crop at MIT. Bulletin No.140. Ministry of Agriculture and Rural Development, Malaysia.
Ruvuna, F., Mao, I.L., McDowell, R.E. and Gurnani, M., 1984. Environmental and Genetic Variation in Milk Yield of Native Cattle and Crosses with Brown Swiss in India. Journal of Animal Science, 59 (1):74-85.
Sabaratnam, S., 2006. Milking Success with Jersey Cows. New Sunday Times, 9 April, 36-37.
Sahadevan, N., 1987. Green Fingers. Sahadevan Publication, Malaysia. ms 462-471
Salleh, A. S., 1989. The Development of Dairy Industry in Sabah.
Proceedings of Seminar on Animal Production and Health, June 12-14, 1989, Tawau, Sabah, 21- 31.
Siregar, I.S., 1990. Sapi Perah Jenis, Teknik Pemeliharaan, dan Analisa Usaha. Penebar
Swadaya, Indonesia.Penebar Swadaya.153 ms