http://dx.doi.org/10.4236/jcc.2016.41001
Universal Tracing Interface for Multicore
Processors
Janne Vatjus-Anttila, Mika Hoppari, Lance Fono, Kari Kolehmainen, Subayal Khan Communication Systems, VTT Technical Research Centre of Finland, Oulu, Finland
Received 28 November 2015; accepted 12 January 2016; published 15 January 2016
Copyright © 2016 by authors and Scientific Research Publishing Inc.
This work is licensed under the Creative Commons Attribution International License (CC BY). http://creativecommons.org/licenses/by/4.0/
Abstract
Application developers of today need to produce code which is error-free, and whose performance is optimized for plethora of devices. Performance of application code is studied e.g. by analyzing performance data obtained by executing application with tracing tool. Developers typically have their favorite tools which they prefer to use but unfortunately target devices are based on differ-ent computing platforms that have differdiffer-ent performance probes which cause difficulties for using same tool with different multicore platforms. Universal Tracing Interface for Multicore Processors (UTIMP) aims to provide an unchangeable tracing interface enabling developers to perform re-quired tracing tasks with the UTIMP, utilizing the favorite tool when possible, for different multi-core platforms.
Keywords
Tracing, Performance, Platform, Probe, Toolchain, Code Generation
1. Introduction
Unfortunately, the set of available performance hardware counters and software counters is not same in all multicore processors, meaning that probes differ between platforms and thus it’s not possible to use the same tools in different platforms in similar way without a tool update. And when crucial performance counter is missing update potentially can’t be based on HW counter support!
Open source tools, e.g. perf [3], give the possibility for making required corrections or adding missing support to tool sources but completing such an updating task correctly may be easier said than done. Altogether the original performance optimization task doesn’t really proceed when resources need to be focused on tracing tool updating or learning an alternative tool(s) which naturally extend(s) application time to market and increase(s) developing expenses.
Especially commercial tools [4] can be even more problematic to use on various platforms because source code tends to be unavailable. They either work or don’t work on different multicore platforms and acquiring support from the tool vendor may be the only way to get the tool working on the desired platform. Such support is often expensive as is purchasing licences of other tools which work better on the targeted platform. Due to these problems of various performance tracing and profiling tools, there is a serious call for a universal tracing interface that can be used via handy UI/client and exploit the most suitable probe seamlessly.
Ongoing UTIMP (Universal Tracing Interface for Multicore Processors) development aims to provide a solu-tion to the problem by providing a universal interface for performance tools. It abstracts away the underlying probes and tools and provides an unchanging service interface. Thus, all tools that are modified to support the UTIMP interface can be used via UTIMP client(s) and when developer needs to test his application in a new platform he doesn’t need to change the performance tracing tool which automatically picks the most suitable tool, and probe from a set of applicable tools to requested tracing task.
The rest of the paper is structured as follows. Related work is described in Section 2. Then in Section 3, a de-scription of the UTIMP prototype and its further development plans are presented. In Section 4, example use-case is observed. Conclusions are briefly discussed in final section.
2. Related Work
There are many existing tracing interfaces and a number of specific profiling toolsets but only few of them seem to provide interface for easy integration. Some of the tools are meant to be used in limited group of computing platforms and operating systems or they support only one or a few tracing types e.g. kernel and/or user events tracing. However, main thing is that performance tracing tools for specific and rather versatile usages are availa-ble for multicores and distributed cyber-physical systems which are in theory possiavaila-ble to integrate with UTIMP. Some interesting work done by others is observed in next paragraphs.
StatsD is a network daemon that aggregates and summarizes application metrics. Using StatsD requires de-velopers to instrument their own code with language-specific StatsD libraries. The libraries communicate with a StatsD daemon via UDP datagram. StatsD provides the following very simple protocol definition:
<metricname> : <value> | <type>
The StatsD daemon listens to a predefined network port and it prepares each entry for aggregation. The sim-plicity of the protocol and the standard network interface that StatsD exposes makes it an easy to use, platform independent solution for performance monitoring. Setup of the daemon however is platform specific and addi-tional libraries may need to be independently installed before it works properly on the target system. Further-more, the trace data itself needs to be collected through the developer’s instrumented code or by using a separate tool. Another drawback is that the daemon does not buffer data but does allow sampling events if there is high throughput and this could lead to potentially heavy traffic with large datasets [5][6].
The open source data collection engine Logstash claims to be able to unify arbitrary data from disparate sources and normalise such data into the developer’s chosen destination. Originally built to collect and analyse log files, Logstash’s capabilities have grown to include a number of input, filter and output plugins, ensuring that the developer has a vast selection of monitoring opportunities.
One of Logstash’s greatest assets is its ability to handle a very wide range of known tracing formats (web logs, networking logs, firewall logs, syslogs and Windows events logs to name a few) while it can also handle arbitra-rily formatted data. Furthermore, it can be used to collect metrics from 3rd party tracing tools (including Col-lectD) and application platforms over TCP and UDP.
While Logstash can parse, prepare and deploy a wide variety of traces into the developer’s desired format, it still must be routed to a 3rd party tool for analysis, monitoring and visualisation. There are however, a variety of both proprietary and open source services that utilise Logstash including analysis tools such as Elasticsearch, MongoDB and Riak as well as monitoring monitoring tools like Nagios, Ganglia, Zabbix, Graphite, Datadog and Cloud Watch [8].
The StatsD, CollectD and Logstash provide interface or plugin which resembles the idea of universal interface of UTIMP. The UTIMP aims to provide as universal interface as possible for tools and probes which can be used with several different multicore platforms and for several tracing purposes like application and kernel trac-ing and to obtain several sorts of tractrac-ing data e.g. CPU usage, memory usage, network usage, function call traces etc.
3. UTIMP
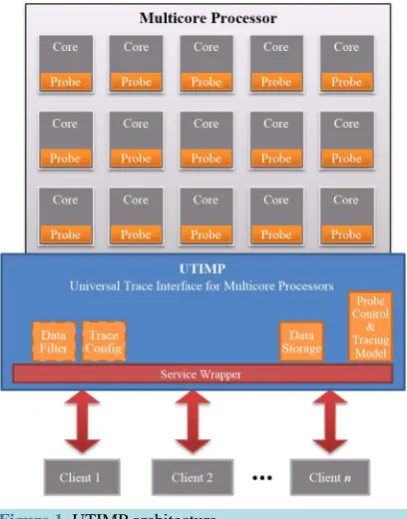
3.1. OverviewAccording our master plan, UTIMP offers a generic interface for one or more clients, such as performance log-ging and visualisation tools, to monitor the activities of a multicore system. The UTIMP collects the tracing data of the individual cores, pre-processes it, and makes it accessible for the clients. Status of UTIMP is best de-scribed with, work in progress, which means that prototype of UTIMP is workable but not yet finalised tool and therefore description of the universal tracing interface is not included in details. The current UTIMP architecture is presented in Figure 1.
[image:3.595.212.416.456.716.2]UTIMP is planned to reside in the multicore processor on the main controller or on one of the cores. Alterna-tively it could run on the controlling host of the multicore system as a whole or reside partially in the target and
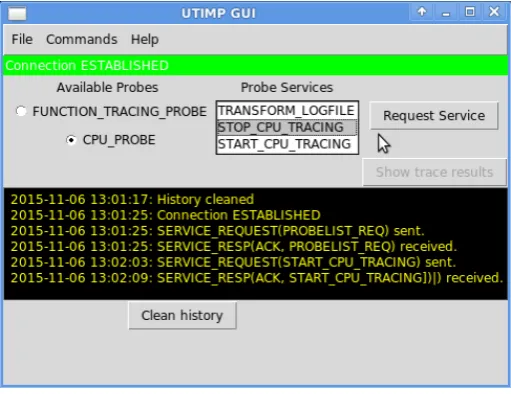
partially the on host or in a cloud providing the service. Exploiting these services happens via separate clients which communicate via sockets with UTIMP server. The UTIMP test client GUI, which enables basic function-ality for trace generation i.e. connect to UTIMP, probe selecting, probe configuration, start tracing, stop tracing, show trace and log of recent tracing events is presented in Figure 2.
The UTIMP functionality is and will be further divided into submodules and components. In different mod-ules the trace data can be filtered, stored, combined, trigger events, and linked to the application state. In addi-tion to trace data related modules there is need for modules which manage parameters of the core specific probes etc.
Components are planned to avoid any unexpected usage of resources, and any undescribed and varying be-haviour. Side-effects like CPU cycles, interrupts or cache effects, or memory usage cannot be avoided but are minimized and defined accurately.
3.2. Modules
The UTIMP consists of several different modules that are each responsible for one core function. Every module is self-monitoring their status, such as memory allocations and changing their behaviour to prevent overhead. At the moment UTIMP contains three kinds of modules: Probe control, Data Storage, and Probe modules. Ongoing development provides more modules enabling new features, for example filtering and configuring functionalities are being sketched and tested. Communication between modules is built on the MPI interface [9]. This enables flexible communication between modules also in heterogeneous multicores and gives the possibility for distrib-uting modules among target, cloud and host nodes.
The Probe Control Module is a generic interface that enables usage of the probes to the rest of the UTIMP components. It allows dynamically configuring parameters of preconfigured individual probes, e.g. sampling frequency or traces to be published. Pre-configuration can be passed via the GUI client or as a text file. In addi-tion, the controller is responsible for dynamically adapting the UTIMP resource usage to minimize the caused overhead. Thus, all other modules report their resource usage to the control module.
The Data Storage Module takes care of UTIMP memory usage. It uses internal logic for storing the data either in memory or disk or for uploading it across network. It also takes care about storing the monitoring data re-ported by probes. The Probes are planned not to store large amounts of data by themselves but instead by send-ing data to the Data Storage Module which is aware of permitted and desired behaviour and resource usage. The Data Storage Module is responsible for not overloading the rest of the system.
[image:4.595.185.441.511.708.2]The Probe Module is present in each core of the multicore processor to capture the traces of interest like memory usage. They are implemented as light-weight as possible to minimise the overhead. Probes expose a generic probe interface for the usage of other UTIMP modules. Probes measure targets and deliver results with associated metadata to other modules for further handling. Probes may only do short-term buffering, sufficient
to guarantee resource sharing and data harvesting un-synchronization and not losing data.
At the time of writing several probes have already been implemented and tested. There are probes for tracing and monitoring CPU load, function calls, and different kinds of user and kernel space events.
The Function Tracing Probe is based on the GNU C/C++ [10] compiler option-finstrument-functions, which makes it useful in any target containing a gcc or gpp compiler. When the flag is used, the compiler takes care of instrumentation and UTIMP records the function trace during the target application execution.
The CPU Probe monitors the load of all CPU cores by using the mpstat tool [11]. Event monitoring probes are monitoring user and kernel space events by using the Performance Application Programming Interface (PAPI)
[12] and the Linux Trace Toolkit next generation (LTTng) interface [13]. The PAPI probe tracks hardware events that occur in User Space while LTTNG probe enables also the Linux kernel and libraries tracing.
Probes send trace data to Data Storage Module which stores the traces as text files. In addition to the tracing data itself trace files include also information of the computing node’s resources, e.g. CPU properties and mem-ory properties.
Figure 3 shows an example of a traced event; single function excerpt of a function trace. Function tracing data is written for each function call. It contains the function name and all information fields selected in the trace configuration. Fields have self-explanatory names that make them human readable and this is handy during de-velopment phase. They provide the required data for various parsing algorithms. For now, light function dura-tion and call count derivative parsing algorithms have been exploited, e.g. max duradura-tion, total duradura-tion, max call count etc. Possible trace fields missing from the excerpt are Exit_time, File_name and Event_type.
3.3. Universal Interface
Current textual UTIMP trace format defines the other end of the interface. Performance extraction tools tend to have their own output formats for the data they provide which does not suit to UTIMP trace fields automatically. In the course of the UTIMP prototype development, different ways were experimented for producing UTIMP traces from different performance and tracing tools.
Most of the performance tools generate output data to files or standard output in textual format which gives the possibility to parse interesting items and write them directly to UTIMP trace format. Linux command line tools like grep and sed for instance provide handy ways for this sort of interface which can be done for just about any textual output format. This is fast way to test and doesn’t even necessarily require the performance tool source code editing. For instance early version of CPU probe was implemented with this method. However, this method is not efficient alternative because the interesting performance data is formatted at least in the performance tool and command line and possibly also in UTIMP if parsed data propagates through it to trace file.
Another considered method was intermediate data format. There are well known file formats like xml, ini, json, csv etc. which could be used to dive the interface in two parts. UTIMP would only have one implementa-tion per file format so it wouldn’t have to be tuned each time new tool is integrated. Some of the performance tools already output these familiar file formats so in best case integrating wouldn’t require work at all to the tool end nor use of command line parsing tools. So this could be universal for some performance tools but not uni-versal interface for all tools. And intermediate file format requires that data formatting is done in writer end reader ends so it is not the most efficient method.
Figure 3. Function trace excerpt which presents single log of
The universal interface to which we have concluded does not rely on command line tools or intermediate file formats although both methods have good features. Our universal interface is UTIMP API which provides C/C++ function interface through which performance data is passed directly from performance tool to UTIMP without unnecessary formatting that produces the inefficiencies and extra overhead. The downside of the method is that source code of the integrated performance tool is necessary in order to build the most efficient perform-ance probe. Development of the API is in progress and while it is still partly un-mature its functionality is not described further. Early version of it has been tested with the Function Tracing Probe which differs from the ba-sic use of API as source code instrumentation with API functions is not needed. Instead new functions, __cyg_profile_func_enter and __cyg_profile_func_exit, for entry and exit function calls generated by the com-piler option are instrumented with UTIMP API function calls.
3.4. Further Development
The current version of UTIMP provides basic functionality of a generic tracing interface and a couple of tools and probes have been integrated into it. However, development still continues and new features will be added to future versions.
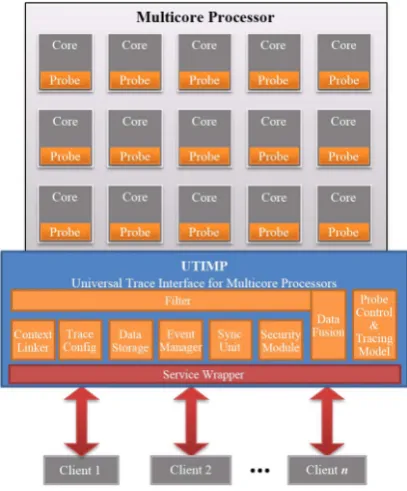
As presented in Figure 4, a lot of new modules are planned and under design in upcoming versions. Those modules will enable new features and services for clients. New features will enable handy trace filtering, remote access and control, context linking, event management, syncing, and security handling. Further development in-cludes also the addition of probes in order to increase tracing support for a larger set of computing platforms.
In addition, existing modules and probes will get upgrades as thus far they have not been optimised. For ex-ample, a probing algorithm will be added to analyse the overheads caused by each tool, to see if there are certain trace services that are inefficient and may need optimizing. E.g. the current compiler based function trace im-plementation overhead can disturb functionality of timing critical applications. The result of the proposed algo-rithm is used in the control module to adjust the responsible probe.
In the long term, one way to control side-effects and overheads is through the installation location and flexi-bility of UTIMP components. For instance, a resource restricted target may prefer a minimal UTIMP installation. Another alternative is to configure UTIMP to minimize certain kinds of overhead. For example if network usage overhead must be minimised, an alternative storing configuration is selected and the generated trace is stored temporarily in the target device and passed to clients after tracing is complete.
Figure 4. In future a lot of new functionality will be
[image:6.595.211.415.451.697.2]Further development of remote features is especially in our interests and a cornerstone of our development vi-sion. Client-server socket communication, which is part of implemented features, offers the first step towards remote tracing and comprises a basis for distributed performance monitoring system which is a definitive re-quirement due present remote tracing needs [14].
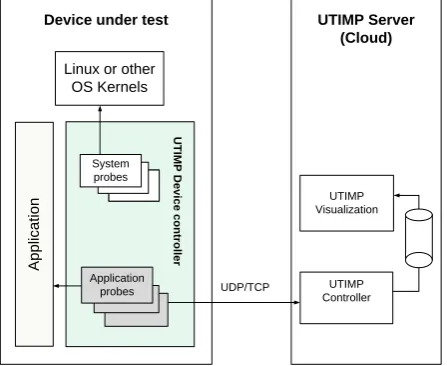
Eventually we plan to explore yet unexploited possibilities of distributed performance evaluation by imple-menting the UTIMP as a distributed software system consisting of a device controller (subsystem) consisting of probes for extracting performance data and a server sub-system (cloud based) for visualization. According to this vision, UTIMP can evolve to serve performance evaluation needs of current local and distributed multicore processor systems as well as boost technologies required in the forthcoming and already appearing IoT and cloud era. Figure 5 highlights the architecture of the envisioned distributed UTIMP system.
Another tempting framework for new client variants are integrated development environments (IDE) which provide appropriate functionality for productive software development, debugging as well as optimization ac-cording visual profiling and tracing results. Integrating the IDE to some wrapper providing socket connection to a remote UTIMP can be implemented as a plugin for IDEs providing the plugin feature. For example, such a plugin feature for Android Studio which is currently under development, allows the IDE to receive trace data from Android devices using modified UTIMP probes [15].
4. Use Case Example
In this use case UTIMP is used to generate a function trace out of an image processing target application, Bit plane encoder/decoder [16], as part of Legacy Code Tool chain (LCTC) that detects possible bottlenecks from a generated trace, creates a graphical model of detected problem function, generates OpenMP parallelised code from a refined model to improve performance of the target application and enables testing, including execution measurement feedback as SOAP [17] messages to the model, of the parallelised application. The work flow of LCTC is visualised in Figure 6. In the figure, modelling related phases are highlighted.
Parallelisation is based on OpenMP 3.0 [18] and in particular to the exploitation of OpenMP tasks. An Overall sketch of LCTC prototyped in the PAPP [19] project is depicted in Figure 7. LCTC was used in an Ubuntu 10.04 Virtual Box image on a Windows 7 host machine.
LCTC consists of a few tools which include UTIMP, Utimp Parser and M-Net [20] domain specific language (DSL). DSL is developed and applied with the Meta Edit+ [21] domain specific modelling tool i.e. Meta Edit+ is part of LCTC also.
The purpose of LCTC is to enable effective target application optimization. To enhance the overall optimiza-tion cycle some work phases were automated, e.g. graphical funcoptimiza-tion models are automatically generated and require just minor layout refining from the user. M-Net out of the box functionality did not include such an im-port generator so M-Net was extended with one among other extensions which were mainly needed for tool
Application
Linux or other OS Kernels UTIMP Visualization UTIMP Controller UDP/TCP
UTIMP Device controller
System probes
Application probes
Device under test UTIMP Server
(Cloud)
Figure 5. A high-level representation of the main compon-
[image:7.595.202.426.512.695.2]Figure 6. Optimization work flow.
Figure 7. UTIMP integration to legacy code toolchain.
chain integration. In the end, all phases starting from building a tracing version of the target application to the testing of parallelised target application can be done via DSL generators.
Steps performed in the use case were as follows. The UTIMP configuration file was defined in the M-Net and passed to UTIMP and a tracing version of the image processing target application decoding case was started. A UTIMP function trace, resulted from executed decoding case, was then parsed with Utimp Parser and the most time consuming functions were sought. A screen capture from parser tool is presented in Figure 8.
From the parsing results we first picked the Decoder Engine function which obviously was a decoding top level function. Our interest was limited to parallelizing loops and the picked function as well as its sub functions included plenty of those but were too complex for the code generator. Interest was refocused to the function from which Decoder Engine function was called and it was imported to Meta Edit+ with M-Net DSL generator.
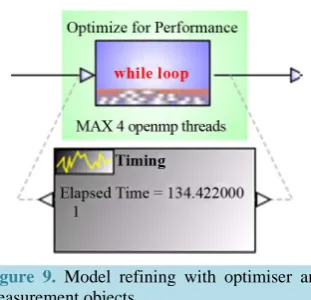
After automatized import phase, a task needs to be selected for parallelisation. It is done with the Optimizer object by placing it under selected task. The graphical M-Net task model highlighted a “while loop” task as a suitable OpenMP optimization target. The Optimizer object was used to optimize the highlighted task, i.e. while loop which included the Decoder Engine function call. Figure 9 shows a clip of the task graph after placing the Optimiser object and Measurement object used for timing over the “while loop” task.
Figure 8. UtimpParser parsing result extracted
from decoding case function trace file.
Figure 9. Model refining with optimiser and
measurement objects.
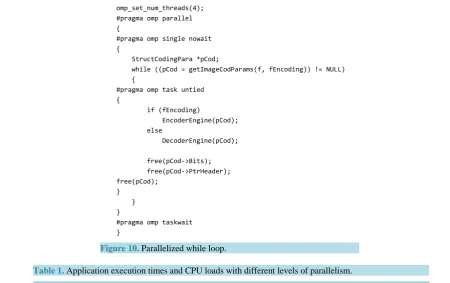
When refining of the graphical model was done, a Code generator was utilized. The “while loop” excerpt of the parallelised code generated from the instrumented task graph is presented in Figure 10. The rest of the code instrumentation, not included in the excerpt, enables timing of the while loop, feedback i.e. passing timing val-ues to the Measurement object and inclusion of the necessary header files.
The parallel code was generated and tested via the M-Net generators which updated the source code with par-allelised code and started application build- and run scripts. The code was runnable and different versions of the code were generated and tested. Timing data feedback to the M-Net task model revealed the best code version and level of parallelisation that gave best speedup in comparison to sequential code variant.
The sequential version of the target application, reads in several image files in a while loop, and processes them one by one. Our parallelised version changed this sequential processing to parallel processing. After LCTC optimization, a set of tests with 20 input images were made to collect results for a final comparison. Input im-ages included 8 MB and 1 MB imim-ages, 10 of both sizes. Imim-ages were first encoded and then decoded back. Im-ages resulting from the decoding were equal with original input imIm-ages which validated the functionality of each tested OpenMP version. Execution times of the parallelised versions as well as the sequential version were measured for the decode direction. Each measurement was repeated 5 times and averages were calculated to in-crease reliability of measurement results. The performance gain reached with the use of OpenMP in decoding case can be observed from Table 1.
The best speedup in comparison to the sequential case was reached with a two thread variant of the while loop, i.e. speedup was 48.09 s - 32.62 s = 15.47 s (~ ×1.5 performance) which equates to about a 32% reduction to the decoding execution time. The generated code provided some speedup but 3 and 4 thread variants could not ex-ploit fully the quad core laptop resources, which in this case was likely to be caused by a problem in the virtual machine configuration. Even so, presented use case gave an example of applying UTIMP to application per-formance optimization as part of LCTC.
5. Conclusions
[image:9.595.235.391.177.327.2]Figure 10. Parallelized while loop.
Table 1. Application execution times and CPU loads with different levels of parallelism.
Measurement
Code variants
Sequential OMP 1 thread OMP 2 threads OMP 3 threads OMP 4 threads
Decode time 48.09 s 49.71 s 32.62 s 34.19 s 43.46 s
CPU load 98% 98% 182% 226% 230%
In its current state, UTIMP already provides a basic interface for tracing to which a couple of tools have been integrated, e.g. a working function call tracing service can be used to produce informative traces. The use case example showed that the UTIMP prototype can be used to collect traces and parse out time-consuming code which needs optimization. Further development of UTIMP is under work and applying it to largely used linux/ unix variants like Android and iOS has already begun.
Acknowledgements
This work is supported by the European Commission, Tekes—the Finnish Funding Agency for Technology and Innovation, and VTT under the grant agreement ARTEMIS-2012-1-295440 PAPP.
References
[1] Increased Complexity in Embedded Software Systems (2014). http://www.ni.com/white-paper/52165/en/
[2] Andrews, J. (2015) System Performance Analysis and the ARM Performance Monitor Unit (PMU).
https://community.arm.com/groups/soc-implementation/blog/2015/02/19/system-performance-analysis-and-the-arm-pe rformance-monitor-unit-pmu
[3] Linux Kernel Profiling with Perf (2015). https://perf.wiki.kernel.org/index.php/Tutorial
[4] List of Performance Analysis Tools (2015). https://en.wikipedia.org/wiki/List_of_performance_analysis_tools
[5] StatsD—README.md. (2015). https://github.com/etsy/statsd/blob/master/README.md
[6] Jackson, K. (2012) Open Stack Cloud Computing Cookbook. Packt Publishing Ltd., Olton, Birmingham. [7] List of Front-Ends (2015). https://collectd.org/wiki/index.php/List_of_front-ends
[9] Squyres, J. (2011) Why MPI? Cisco Blog/High Performance Computing Networking 2011. http://blogs.cisco.com/performance/why-mpi
[10] GNU gcc Manual (2015). https://gcc.gnu.org/onlinedocs/gcc/
[11] MPSTAT Manual Page. http://sebastien.godard.pagesperso-orange.fr/man_mpstat.html
[12] Browne, S., Dongarra, J., Garner, N., Ho, G. and Mucci, P. (2000) A Portable Programming Interface for Performance Evaluation on Modern Processors. International Journal of High-Performance Computing Applications, 14, 189-204. http://dx.doi.org/10.1177/109434200001400303
[13] Desnoyers, M. and Dagenais, M.R. (2006) Low Disturbance Embedded System Tracing with Linux Trace Toolkit Next Generation. Proceedings of theEmbedded Linux Conference, San Jose, 11-12 April 2006, 1-4.
[14] Iosup, A., Ostermann, S., Yigitbasi, N., Prodan, R., Fahringer, T. and Epema, D. (2010) Performance Analysis of Cloud Computing Services for Many-Tasks Scientific Computing. IEEE TPDS, Many-Task Computing, November 2010.
[15] Creating Plugins for Android Studio.
http://yvonne.idescout.com/2015/08/writing-plugins-for-android-studio.html
[16] CCSDS 122.0-B-1 Recommended Standard. http://public.ccsds.org/publications/archive/122x0b1c3.pdf
[17] The gSOAP Toolkit for SOAP and REST Web Services and XML-Based Applications. http://www.cs.fsu.edu/~engelen/soap.html
[18] Version 3.0 Complete Specifications (2008). http://openmp.org/wp/openmp-specifications/
[19] Portable and Predictable Performance on Heterogeneous Embedded Manycores. http://www.papp-project.eu/
[20] Yrjönen, A. and Merilinna, J. (2009) Extending the NFR Framework with Measurable Non-Functional Requirements.
Proceedings of the 2nd International Workshop on Non-Functional System Properties in Domain Specific Modeling Languages, Denver, 4 October 2009.http://sunsite.informatik.rwth-aachen.de/Publications/CEUR-WS/Vol-553/ [21] White Paper, “Domain-Specific Modeling with Metaedit+: 10 Times Faster Than UML”.