Copyright©2016 by authors, all rights reserved. Authors agree that this article remains permanently open access under the terms of the Creative Commons Attribution License 4.0 International License
Abstract
Ants are social insects and generally experimentally tractable. For these reasons, ants are favored by researchers regarding their own crowd behavior. Based on the data gathered from our previous ant evacuation experiments, “selfish evacuation behavior” was not observed in the ants’ experiments under stress conditions. To extend our understanding of the topic, we constructed a cellular automaton model to simulate the behaviors of ants in stress situations. Ant body size, shape, and actual speed gathered from previous ant evacuation experiments, were taken into account in our model. In previous ants’ experiment of our work, a filter paper with the repellent substance was located on the opposite side of the experimental chamber from the exit. Inspired by this experiment, parameter D was introduced in our model, which represented the drift to move forward (toward the exit, away from the repellent substance). Every ant (An) in the room had the same D value. In our model, N ants were initially distributed randomly in the room and the sequential update rule was adopted. Considering of the temporal evolution of the number of ants escaping within each exit size, we presented experimental result of each exit width and used our model to simulate ants escaping through that exit width. Subsequently, some factors affecting evacuation efficiency were also studied.Keywords
Computer Application, Numerical simulation, Cellular Automaton Model, Evacuation1. Introduction
Ant is a kind of social insect and ant traffic behavior attracts more and more researchers to work on the topic. Previously, some features of ant traffic were revealed through ant experiments [1-4]. Ant traffic was also investigated by using numerical simulation, which had shown many important results. Chowdhury et al. [5] found that the ants average speed varied non-monotonically when ant density changed, that is, not decreasing monotonically with density increasing when using cellular-automaton model. The model motivated by ants’ motions was
investigated further by Nishinari et al [6]. The spatiotemporal organization of ants was revealed in detail and the formation of clusters was presented. Subsequently, John et al. [7] proposed a bi-directional model of ant traffic and found ant traffic differed from vehicular traffic. Then the cellular automation models of uni-directional and bi-directional ant traffics were generalized and interesting collective phenomenon was shown [8].
In this paper, we constructed a cellular automaton model to simulate ants escaping through an exit with different exit sizes, and compared the temporal evolution of the number of ants escaping within each exit size with ant experimental result of each exit width obtained from our previous work [9]. Then some factors affecting evacuation efficiency were also discussed.
2. Model
[image:1.595.324.536.572.737.2]In order to simulate the evacuation process of ants, we built a model (Fig. 1) based on a bias-random model [10, 11] to conduct further research on ant movements. According to the data we had gathered on ant head widths and body lengths, a cell was determined to be 0.5 cm × 0.5 cm, and every ant occupied two continuous cells (Figs. 2 and 3).
Figure 2. Cellular automaton model of ants escape in stress situation (when encountering filterpaper soaked in citronellaoil). The oval area represents a single ant, occupying two cells, and the arrows or crosses indicate the directions in which it is allowed to move or prevented from moving, respectively. (A) The nth confined ant, An, has four choices for movement, including the option to remain in place. (B), (C), and (D) The An has three choice for movement. (E), (F), and (G) The An has two choices for movement. (H) The An has no choice but must remain in place.
Figure 3. Cellular automaton model of ants escape in stress situation (when not encountering filterpaper soaked in citronellaoil). The oval area represents a single ant, occupying two cells, and the arrows or crosses indicate the directions in which it is allowed to move or prevented from moving, respectively. (A) The nth confined ant, An, has four choices for movement, including the option to remain in place. (B), (C), and (D) The An has three choice for movement. (E), (F), and (G) The An has two choices for movement. (H) The An has no choice but must remain in place. (I) The An has five choices for movement, including the option to remain in place. (J), (K), and (L) The An has four choice for movement.(M), (N), and (O)The An has three choices for movement.(P) The An has two choices for movement.
We simulated the movement of ants in a room that was divided into L × W cells, where W was the width and L was the length (W = 14, L = 16). Each cell was empty (designated 0), occupied by a wall (designated 1), or occupied by one ant (designated 2). In the initial state (at iteration step q = 0), the ants were distributed randomly in the room. The room had an exit with the width of n (n = 1, 2, 3, 4, 5, or 6) cells. According to the experimental observations, ants showed little probability of backing away when they encountered filterpaper soaked in citronellaoil. Therefore, the model did not allow backward steps in this situation.
As shown in Fig. 2, at each time step during movement, an ant, might encounter one of eight situations; an arrow represents an available direction for the ant, a cross represents an unavailable direction. However, ants might
move in a direction away from the exit in the evacuation experiments, so a probability of backward steps had been added to the model when ants did not encounter the filter paper with citronella oil. This was shown in Fig. 3, where an ant could meet one of sixteen situations. Each ant moved to the nearest neighbor cell according to the configurations and the moving probabilities. Pt,x, Pt,-x, Pt,-y, and Pt,y represented the probabilities of moving forward, backward, left, and right, respectively, based on [12], and Pt,0 indicated the probability that the ant would remain in place.
These variables were defined as follows: As shown in Fig. 2,
For (A),
P
t x,D
1
4
D
−
= +
,P
t y,P
t y,−P
t,01
4
D
−
[image:2.595.114.488.267.501.2]For (E), ,
1
2
t x
D
P
= +
D
−
, ,01
2
t
D
P
=
−
, the probability of moving to the occupied cell is zero.For (F) and (G), the probabilities of moving toward the available cell or remaining in place both are
1
2
. For (H), the probability of remaining in place is 1. As shown in Fig. 3,For (A),
P
t x,D
1
4
D
−
= +
,P
t y,P
t y,−P
t,01
4
D
−
=
=
=
For (B), ,
1
3
t x
D
P
= +
D
−
, , ,01
3
t y t
D
P
=
P
=
−
, theprobability of moving to the occupied cell is zero.
For (C), ,
1
3
t x
D
P
= +
D
−
, , ,01
3
t y t
D
P
−P
−
=
=
, theprobability of moving to the occupied cell is zero.
For (D), , , ,0
1
3
t y t y t
P
=
P
−=
P
=
, the probability ofmoving to the occupied cell is zero. For (E),
P
t x,D
1
2
D
−
= +
,P
t,01
2
D
−
=
, the probability of moving to the occupied cell is zero.For (F) and (G), the probabilities of moving toward the available cell or remaining in place both are
1
2
. For (H), the probability of remaining in place is 1. For (I),Pt x, D 15D−
= + , t x, t y, t y, t,0
1
5
D
P
−P
P
−P
−
=
=
=
=
For (J), , 1 4
t x D
P = +D − , , , ,0
1
4
t x t y t
D
P
−P
P
−
=
=
=
, theprobability of moving to the occupied cell is zero.
For (K), , 1
4
t x D
P = +D − , , , ,0
1
4
t x t y t
D
P
−P
−P
−
=
=
=
,the probability of moving to the occupied cell is zero.
For (L), , , , ,0
1
4
t x t y t y t
P
−=
P
=
P
−=
P
=
, the probabilityof moving to the occupied cell is zero.
For (M), ,
1
3
t x
D
P
= +
D
−
, , ,01
3
t x t
D
P
−P
−
=
=
, theprobability of moving to the occupied cell is zero.
3. Results and Discussion
In our computer model, the ant was simulated by a bias-random walker. At a given time step q, every ant (An) could move forward, move left, move right, move back or remain in place; every ant (An) had a probability of taking a backward step only if it did not encounter the filter paper with citronella oil. We set a preference for ants to occupy the cell ahead of them if it was empty. The particles, which occupied two cells, were slender in order to more accurately represent ant shapes.
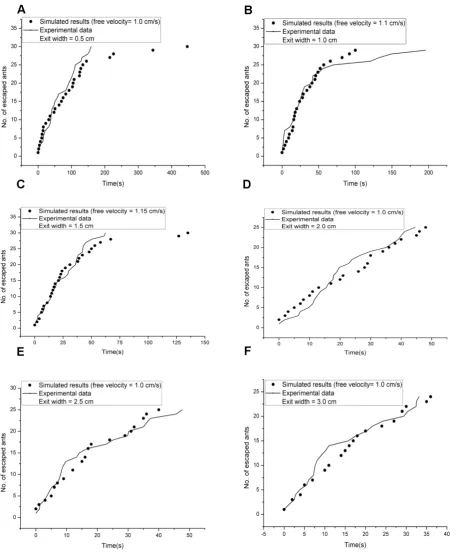
In our model, 30 ants were initially distributed randomly in the room and the sequential update rule was adopted. All the ants were numbered from 1 to N randomly and updated in turn during each time step. If an ant arrived at the exit cell, it was considered to have escaped from the room. The above procedures were repeated until all ants had escaped. The Gaussian distribution (μ = 0.9573, σ = 0.5362) of ant speeds was obtained from the experiments we conducted in a unidirectional channel and applied in our model. The units of μ and σ both are cm/s. On the basis of the value range from (μ-3σ) to (μ+3σ), we chose a unit value of 0.05 cm/s in our model. The general shape of the temporal evolution of the number of ants escaping within each exit width was qualitatively similar for the six experimental repetitions, so we presented one experimental repetition of each exit width and used our model to simulate ants escaping through that exit width. To learn whether our model could apply to the evacuation of ants, we used the numbers of escaped ants over the same period of time from experiments and simulations in paired sample t-test for statistical analysis. P-values were 0.29, 0.59, 0.48, 0.70, 0.39, and 0.38 for exit width = 0.5 cm, 1.0 cm, 1.5 cm, 2.0 cm, 2.5 cm, and 3.0 cm, respectively.
Figure 4. The simulated results for two exit widths. The temporal evolution of the number of ants escaping through the exit according to our model agrees with that of the experimental data, and the model estimates free speed in the evacuation experiment.
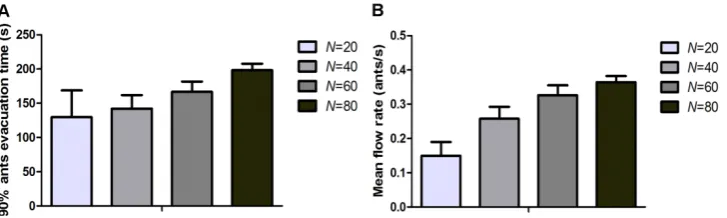
The initial number of ants before evacuation (N) was discussed firstly. It was found that the 90% ant evacuation time increased with N increasing, however, the mean flow rate also increased with increasing N (Fig. 5). For example, when N = 80, 90% ant evacuation time was the highest and
Figure 5. The evacuation time and mean flow rate of different N values (D = 0.5, v = 1.0 cm/s, d = 0.5 cm). A and B represent 90% ant evacuation time and mean flow rate respectively. Error bars correspond to the standard deviation.
[image:5.595.111.502.386.498.2]Figure 6. The evacuation time and mean flow rate of different d values (D = 0.5, v = 1.0 cm/s, N = 30). A and B represent 93% ant evacuation time and mean flow rate respectively. Error bars correspond to the standard deviation.
Figure 7. The evacuation time and mean flow rate of different v values (D = 0.5, N = 30, d = 0.5 cm). A and B represent 93% ant evacuation time and mean flow rate respectively. Error bars correspond to the standard deviation.
Subsequently, the effect of exit size (d) on evacuation efficiency was studied. The results were shown in Fig. 6. It was revealed that 93% ant evacuation time decreased but mean flow rate increased with increasing exit size (d). Fig. 6 showed that minimum of 93% ant evacuation time was reached when d = 7.0 cm while mean flow rate was the highest when d = 7.0 cm. It was also discussed how ant speed (v) affected evacuation time and mean flow rate, shown in Fig. 7. The 93% ant evacuation time was found to increase with decreasing ant speed (v), however, the mean flow rate increased when ant speed (v) increased. Consequently, relatively large d and v would improve the evacuation efficiency.
4. Conclusions
The experimental results of our previous work [9] for temporal evolution of the number of ants escaping in the
stress condition were found to be consistent with the CA simulation, implying that an ant, in a situation with a repellent agent in a single-exit room, did not choose the shortest path for escape but behaved like a bias-random walker. The effect of initial number of ants before evacuation (N), exit size (d), and ant speed (v) on evacuation efficiency were also investigated. Our work contributes to the understanding of ant traffic and egress behavior in stress situations.
Acknowledgments
REFERENCES
[1] John A, Schadschneider A, Chowdhury D, Nishinari K.
Trafficlike collective movement of ants on trails: Absence of a jammed phase. Physical review letters. 2009; 102(10): 108001.
[2] Soria S, Josens R, Parisi D. Experimental evidence of the “Faster is Slower” effect in the evacuation of ants. Safety science. 2012; 50(7):1584-8.
[3] Boari S, Josens R, Parisi DR. Efficient Egress of Escaping Ants Stressed with Temperature. PloS one. 2013; 8(11):e81082.
[4] Oettler J, Schmid VS, Zankl N, Rey O, Dress A, Heinze J. Fermat’s Principle of Least Time Predicts Refraction of Ant Trails at Substrate Borders. PloS one. 2013; 8(3):e59739. [5] Chowdhury D, Guttal V, Nishinari K, Schadschneider A. A
cellular-automata model of flow in ant-trails: Non-monotonic variation of speed with density. Journal of Physics A: Mathematical and General. 2002; 35(41):L573-L7.
[6] Nishinari K, Chowdhury D, Schadschneider A. Cluster
formation and anomalous fundamental diagram in an ant-trail
model. Phys Rev E. 2003; 67(3):036120_1-_11.
[7] John A, Schadschneider A, Chowdhury D, Nishinari K.
Collective effects in traffic on bi-directional ant trails. Journal of theoretical biology. 2004; 231(2):279-85.
[8] John A, Kunwar A, Namazi A, Chowdhury D, Nishinari K, Schadschneider A. Traffic on bi-directional ant-trails. Pedestrian and Evacuation Dynamics 2005: Springer; 2007. p. 465-70.
[9] Wang S, Lv W, Song W. Behavior of Ants Escaping from a Single-Exit Room. PLoS One. 2015; 10(6):e0131784. PubMed PMID: 26125191. Pubmed Central PMCID: 4488427.
[10]Muramatsu M, Irie T, Nagatani T. Jamming transition in pedestrian counter flow. Physica A. 1999 May 15; 267(3-4):487-98. PubMed PMID: WOS: 000080493800015. English.
[11]Muramatsu H, Nagatani T. Jamming transition in
two-dimensional pedestrian traffic. Physica A. 2000 Jan 1; 275(1-2): 281-91. PubMed PMID: WOS: 000084528200020. English.