Adoption MIS in Middle Level Training Institutions in
Kenya
Timothy Serem Kiptoo
*, Benjamin Kyambo, Fredrick M. Awuor
Faculty of Information Science and Technology, Kisii University, P.O. Box 408 – 40200 Kisii Kenya Corresponding Author: gobetim@yahoo.com
Copyright © 2014 Horizon Research Publishing All rights reserved.
Abstract In today’s competitive environment, the only
major challenge is effective management of information. The only sure way of achieving this is by handling gathered information in an efficient and effective manner using technology. These technologies come with their own challenges that may hinder organizations from fully adopting them. This study was done to establish the factors that influence the adoption of computer-based information systems in selected technical, industrial, innovation, entrepreneurial and training institutions in Kenya. Specifically, the study sought to establish the relationship between internal factors, external factors and personal factors on the adoption of computer-based information systems in middle level institutions in Kenya. The research design used in this study was case study with a target population of 160, Census method of sampling was used and questionnaires were used to collect data. Data was analyzed both qualitatively and quantitatively using descriptive and inferential statistics. The findings revealed that the institution has invested a lot of resources in management information systems and there is a significant relationship between external factors (22.30%), personal factors (21.20%) and internal factors (21.40%) on the adoption of computer-based management information systems in middle level institutions in Kenya. Results of the hypothesis revealed that there was a significant relationship between the dependent and the independent variables at 5% level of significance. The study concluded that institutions understand the need to adopt MIS and have even made attempt to facilitate its adoption. However there exists a gap in the usage of this equipment in the management of information. The study recommends an assessment on training on MIS, posting information on shared databases and lastly engaging the services of an IT company with necessary technical capacity at the initial stages of management information system (MIS) adoption.Keywords
Information, MIS, Service Delivery, Middle Level Institutions.1. Introduction
Terry (2005), defined Management information systems as any telecommunication and computer related equipment or interconnected systems or subsystems of equipment that is used in the acquisition, storage, manipulation, management, movement, control, display, switching, interchange, transmission or reception of voice or data and includes software. Sophisticated techniques must be used in acquisition of information which involves collection from within and outside the organization. The techniques used, should be able to overcome various challenges encountered in information collection and once information has been acquired it must be guarded since information is delicate. This therefore means that there is need to use high technology in its management.
Information can be manipulated from time to time to suit organizations needs. While in the organization, information will from time to time move within and without the organization. During this movement of information, (Rogers 2003), noted that there is need to monitor it closely to prevent it from falling into competitors hands. Information must be presented in the right format and time to the right audience and in order to achieve these then sophisticated techniques must be used. He further observes that, to be successful, management information systems must be designed and operated with due regard to organization and behavioral principles as well as technical factors.
Managers must be informed enough to make an effective contribution to system design and the information specialists must become more aware of managerial functions and needs so that jointly, more effective management information systems are developed. This is important because it will enable all system’s stakeholders to participate in the development of systems and subsequent adoption of computer based management information system on quality service delivery in middle level institutions to be used in managing information. It may be noted that organizations are dynamic and constantly changing. These changes are brought by competition, faster pace and even increased globalization (Rodgers, 2007).
that has been processed and communicated in such a way as to be useful to the recipient or the intended. He further asserts that information is part of Management Information system. On the other hand the term information has encompassed many aspects of computing and technology, and it has become very recognizable. IT professionals perform a variety of duties that range from installing applications to designing complex computer networks and information databases. A few of the duties that IT professionals perform may include data management, networking, engineering computer hardware, database and software design, as well as the management and administration of entire systems. Managers in organizations use produced information together with the information in their heads to plan, control, make decisions, or modify the produced information so as to share the new knowledge with others in the organization. Therefore, to achieve these organizations need to adapt ways to manage this information. This is aided by the adoption of computer based management information system. In the past, information was handled using manual systems that were considered inflexible, slow and needed large filing cabinets.
According to Rodger (2007), organizations have goals that they strive to achieve and these goals must be achieved within a specific time frame. These goals are subdivided into three, namely; production, financial and marketing. Production goals in organizations focus on quality and quantity. All organizations want to increase productivity while maintaining quality and produce goods or offer services at the right time. Organizations also have financial goals that focus on return on investment. All organizations want to make good returns from their investments while minimizing costs at whatever means. Marketing goals focuses on market share, marketing what has been produced, sales volumes, customer satisfaction, customer value creation and customer lifetime. Goals should be problem-centered and future oriented. It should be geared towards solving a certain problem at hand and also should be able to focus, solve and even guide on future course of action. To achieve good results in all aspects, organizations are expected to employ technology in the way information is managed. To achieve this, organizations must put in place computer based management information systems to be used for effective and efficient management of management information system resources to enhance quality information. Information management refers to tools and techniques for collecting, managing and disseminating knowledge within the organization is of increasing importance in today’s high-technology business environment.
GOK (2007) asserts that, middle level training institutions, plays a major role in providing relevant data about the usage and application of management Information system. These include involvement of all relevant stakeholders in the development of a comprehensive national skills training strategy. Middle level institutions are expected to bring all interested parties on board in order to ensure that its overall goal is achieved. Further, the vision of MOE is to have a globally competitive education, training and research for
Kenya’s sustainable development. To achieve this, the government must put in a lot of resources. Resources are scarce in all organizations and middle level training institutions like any other organization are surviving with little resources allocated by the government or from any other sources. These resources must be effectively managed for maximum returns. Middle level institutions must therefore invest in viable projects. To do this, a lot of factors are considered before a sound decision is made. This therefore means that organizations must have reliable information from reliable sources which must be guarded effectively and by all means. As these organizations grow the amount of information they hold increases significantly. In order to manage this information, middle level institutions require advanced and in some cases sophisticated technologies. Old and obsolete manual systems of managing information may not offer much help in information management in these institutions but rather need computer-based information system that prove to offer quality delivery of service.
2. Statement of the Problem
In today`s business environment, information systems are part and parcel of the day to day delivery of quality services. Despite the fact that information systems are expected to provide quality service delivery, middle level institutions have not fully implemented them. This is evidenced by the many delays in service delivery, poor attitude towards information systems and even increasing costs in information management. The purpose of this study was to investigate the factors that affect the adoption of computer-based management information systems on quality service delivery in middle level institutions.
2.1. Research Objectives
General objectives for this study were to investigate factors that affect the adoption of computer-based management information systems on quality service delivery in middle level institutions. Specifically, the following objectives were investigated:
To investigate the influence of external factors on adoption of computer-based management information systems on quality service delivery in middle level institutions.
To establish the influence of personal factors on adoption of computer-based management information systems on quality service delivery in middle level institutions.
To investigate the influence of internal factors on adoption of computer-based management information systems on quality service delivery in middle level institutions.
respondents had adequate knowledge on Information systems and understood the questions that were asked. The reviewed literature included: information literacy, information as a resource, internal factors and adoption, infrastructure and adoption, organizational policies and adoption, economic status and adoption, goals and adoption, leadership, government policies and adoption, stakeholders and adoption, competitors and adoption, economic factors and adoption, personal factors and adoption, literacy levels and adoption, motivational levels and adoption, perception and adoption and also reviewed previous studies.
3. Methodology
The research design adopted in this study was case study. Saunders (2003), noted that a case study research design portrays a good profile of persons, events or situations. This study was adopted in this research in order to establish all relevant aspects of all staff of Ol’lessos Technical Training Institute in respect to MIS adoption. Target population refers to all the members of a real or hypothetical set of people, events or objects to which the study wishes to generalize the results of research (Kothari, 2004). The target population of this study comprised of all teachers and non teaching staff at Ol’Lessos Technical Training Institute (OTTI) who are 160 (one hundred and sixty) members. Since the target population of this study of 160 (One hundred sixty) was small, census method was used to obtain the information required. Information therefore was collected from the teachers and the non teaching members of staff. Based on this and taking into account the small size of the population, the data was collected from the whole population (Kothari, 2004). The Census method was adopted because it has the advantages such as the researcher is able to bring the real information from the respondent, more convenient to the researcher as all the respondents were reached. It is also useful in saving time as the researcher was able to reach the respondents at their convenient place and get immediate response without waiting for replies. The information can be easily tabulated in the tables to represent the collected data in more clear way and the procedure can be cost effective in the final analysis of the project process. The researcher used questionnaires as the main mode of data collection. The use of questionnaires was justified because they were an effective way of collecting information from a population in a short period of time and at a reduced cost. The questionnaires also facilitated easier coding and analysis of data collected (Kothari, 2004).The questionnaire contained both closed and open ended questions. The closed ended questions ensured that the respondents were restricted to certain categories in their responses. The open ended questions were used where the research objective was to explore other possible responses that would differ from respondent to respondent. The questionnaires were first edited and coded to ensure completeness and accuracy. The data were analyzed through the use of descriptive statistics
such as mean, median, standard deviation, frequency tables and percentages. The computer application package for social sciences SPSS (Statistical Package for Social Sciences) version 19.0 was used to aid in the analysis. Inferential statistics was also used in the analysis where multiple regression analysis was used.
The multiple regression model used was as follows: Ý=β0+β1 χ1+β2χ2+ β3χ3+Σіϳ. Data have been presented using Tables and figure graphs, frequency tables and bar charts.
Validity and reliability was done to establish the standardization of the research instruments that were be used in the study. Validity was tested through expert judgment of research supervisors and statisticians. To ensure reliability, piloting was carried out on a population that has similar homogeneous characteristics; the pilot study included 80 (eighty) teachers and non teaching staff in Rift Valley Technical Training Institute in Eldoret Town. The pilot study helped in modifying various items in order to rephrase, clarify and clear up any ambiguities in the questionnaire. Measures were taken to ensure informed consent of respondents. In order to protect the rights and privacy of all respondents, they were approached with an introductory letter. Research was also done in such a manner that respondents were assured of their anonymity and the confidentiality of their responses. Research respondents were further guaranteed that their individual identities will not be disclosed.
4. Data Presentation and Analysis
Questionnaires were completed by 150 employees of Ol’Lessos Technical Training Training. From the findings the gender make up of the respondents showed that 56.67% were female (n=85) whereas 43.33% were male (n=65). From the findings, the age brackets showed that 20.00% fall in age 15-29 (n=30), 56.67% are in 30-39 (n=85), 13.33% fall in 40-49 (n=20), 6.67% fall in 50-59 (n=10) and 3.33% are above 60years (n=5). It is evident that most employees fall in between 30-39 years of age. All employees consider themselves literate since there is a 0% illiteracy (n=0), 3.33% have primary education (n=15), 10.00% have secondary education (n=15), 33.33% have tertiary education (n=50), 53.33 have university education (n=80) and none had other qualifications since n=0.
while a small proportion of respondents 20(13.33%) strongly disagreed. From the response, it is evident that there are government policies that play a role in the adoption of MIS in middle level institutions.
On whether there are NGOs and charitable organizations that support MIS implementation, 25(16.67%) of the respondents strongly agreed while 45(30.0%) agreed. On the other hand, 16(10.67%) were undecided while 20(13.33%) disagreed and 44(29.33%) strongly disagreed with that view. On whether there are private enterprises supporting implementation of MIS, 35(23.33%) and 48(32.0%) strongly agreed and agreed respectively whereas 18(12.0%) and 47(31.33%) disagreed and strongly disagreed respectively. A small proportion of respondents (1.33%) were undecided.
Majority of the respondents felt that the government supports MIS adoption. When asked, 45(30.0%) strongly agreed and 75(50.0%) agreed that the government supports MIS adoption. A small percentage of the respondents felt that the government was not supporting MIS with 5(3.33%) disagreeing and 15(10.0 %) strongly disagreeing. 10(6.67%) are undecided.
It is evident from the findings that majority of the respondents felt that information systems will ease their work. 93(62.00%) strongly agreed while 37(24.67%) agreed. On the other hand few respondents were of the opinion that MIS don’t ease their work. 3(2.00%) and 6(4.00%) disagreed and strongly disagreed respectively while 11(7.33%) were undecided. When asked whether information system will interfere with job security, minority indicated that it will interfere while majority were of the contrary opinion. 15(10.00%) and 22(14.67%) strongly agreed and agreed respectively that it will interfere with their job security whereas 65(43.33%) and 33(22.00%) disagreed and strongly disagreed respectively. 15(10.00%) were still undecided.
When asked whether MIS will improve the image of the institution, majority felt that it will improve as evidenced by 87(58.00%) and 49(32.67%) of the respondents who strongly agreed and agreed respectively whereas 5(3.33%) and 3(2.00%) disagreed and strongly disagreed and 6(4.00%) were undecided. Employees were further asked whether they saw the importance of information systems, 62(41.33%) and 56(37.33%) strongly agreed and agreed respectively where as 22(14.67%) and 2(1.33%) disagreed and strongly disagreed respectively while 8(5.33%) were undecided.
Majority of the respondents were of the opinion that information systems is flexible to interact with. 64(42.67%) strongly agreed and 57(38.00%) agreed whereas 10(6.67%) and 12(8.0%) disagreed and strongly disagreed respectively while 7(4.67%) were undecided. It is evident that respondents were of the opinion that interacting with ICT is not frustrating. When asked so, 8(5.33%) and 20(13.33%) strongly agreed and agreed respectively that ICT use is frustrating whereas 72(48.00%) and 30(20.00%) disagreed and strongly disagreed respectively while 20(13.33%) were undecided.
The findings showed that majority of the respondent believed that organization’s policies favor information
systems. 38(25.33%) and 84(56.0%) strongly agreed and agreed respectively. Minority 13(8.67%) and 7(4.67%) disagreed and strongly disagreed respectively that organisation’s policies favor information systems. A small proportion of respondents 8(5.33%) were undecided. From the findings, it is evident that OTTI has policies that guides the implementation and use of MIS.
When asked whether there is sufficient ICT infrastructure in the institution, 15(10.0%) strongly disagreed while 24(16.0%) agreed. 65(43.33%) disagreed and 11(7.33%) strongly disagreed. 35(23.33%) of the respondents were undecided. From the findings, it is evident that there is insufficient infrastructure in the institution. When asked whether the administration is fully supporting the implementation of MIS, 69(46.00%) agreed while 37(24.67%) strongly agreed. On the other hand 14(9.33%) and 17(11.33%) disagreed and strongly disagreed respectively while 13(8.67%) were undecided. It is clear that OTTI administration fully support the implementation of MIS.
63(42.00%) and 56(37.33%) strongly agreed and agreed respectively on the availability of qualified ICT personnel in the institution whereas 9(6.00%) and 12(8.0%) disagreed and strongly disagreed respectively while 10(6.67%) were undecided. This is a clear indication that the institution has qualified personnel as far as ICT is concerned. When asked on whether MIS will consume much of the institute’s resources, 51(34.00%) and 28(18.67%) disagreed and strongly disagreed respectively while 28(18.67%) were undecided. It is evident that most employees believe that MIS do not consume much of the institute’s resources.
67(44.67%) and 58(38.67%) disagreed and strongly disagreed when asked if there are other projects to invest in other than MIS whereas 13(8.67%) and 7(4.67%) strongly agreed and agreed respectively while minority at 5(3.33%) were undecided. Most of the staff members do not believe that there are other important projects to invest in other than in MIS. This indicates that they see MIS as a very important investment. The study found out that the independent variables, namely the external factors, personal factors and internal factors have some significant effect on the dependent variable the adoption of Computer-based Management Information Systems on quality service delivery in middle level Institutions.
4.1. Multiple Regression Analysis
Besides using descriptive statistics, the researcher was interested to ascertain whether there was any relationship between dependent and independent variables. Thus multiple regression analysis was employed not only to establish the existence of relationships between the variables but also to determine the strength of causal relationships between dependent and independent variables. The multiple regression model used was as follows:
Where:
Ý= is the dependent variable (Adoption)
χ1, χ2, χ3 are independent variables i.e χ1=External factors,
χ2=Personal factors and χ3=Internal factors
β0, β1, β2, β3 are the regression coefficients
And
Σіj is the error component with the mean Zero.
[image:5.595.57.298.232.298.2]The data was analyzed using SPSS program version 19.0. After running the statistical test mentioned above, the findings yielded the multiple regressions results as shown in Table 1.
Table 1. Model Summary for dependent and independent variables.
Model Summary
Model R R Square Adjusted R Square Std. Error of the Estimate
.725(a) .525 .515 .42782
The table signifies that there is a strong positive none-linear correlation between the dependent variable Y and independent variables. R2is a measure of how much of the variability in outcome is accounted for by the predictors. In Table 1, the value of R2 has increased to 0.525 or 52.50% of
[image:5.595.58.296.399.560.2]variation in Adoption.
Table 2. Regression coefficients
Coefficientsa
Model
Unstandardized
Coefficients Standardized Coefficients t Sig.
B Std. Error Beta
(Constant) 3.511 .378 9.278 .000
External
Factors -.195 .043 -.261 -4.526 .000
Personal
Factors -.320 .087 -.216 -3.661 .000
Internal
Factors -.165 .064 -.157 -2.555 .011
a. Dependent Variable: Adoption
All the variables in the study were significant as shown in Table 2. Stepwise selection method was adopted in the analysis where each independent variable was entered in sequence and its value assessed. This method was based on the criteria that if adding the independent variable contributes to the model then it is retained, but all other variables in the model were again re-tested to see if they were still contributing to the success of the model and if found not to contribute significantly they were removed. Thus, this method was to ensure that the end result was the smallest possible set of predictor variables included in the model. In this case, all the three independent variables contributed to the success of the model.
ANOVA
The researcher carried further analysis to ascertain the variability of relationships between the dependent and independent variables. The analysis of variance(ANOVA) tests whether the model was significantly better at predicting the outcome than using the mean as a ‘best guess’. Specifically, the F-ratio represents the ratio of improvement in prediction that results from fitting the model (labeled ‘Regression’ in Table 3 relative to inaccuracy that still exists in the model (labeled ‘Residual’) in Table 3.
If improvement due to fitting the regression model is much greater than the inaccuracy within the model, then the value of F will be greater than 1.
In essence, Table 3 reports an ANOVA, which assessed the overall significance of the model.
The researcher was interested in testing the hypothesis:-
H0:= There is no significant relationship between
independent variables namely the external factors,,
personal factors , and internal factors against the dependent variable namely the adoption of Computer-based Management Information Systems on quality service delivery in middle level Institutions.
Versus
H1:= There is a significant relationship between
[image:5.595.313.550.444.557.2]independent variables namely theexternal factors, personal factors , and internal factors against the dependent variable namely the adoption of Computer-based Management Information Systems on quality service delivery in middle level Institutions.
Table 3. Anova for Dependent and Independent Variables
ANOVAb
Model Squares Sum of df Square Mean F Sig.
1
Regressio
n 36.827 4 9.207 50.302 .000a
Residual 33.312 182 .183
Total 70.139 186
a. Predictors: (Constant), ExternalFactors, PersonalFactors, InternalFactors
b. Dependent Variable: Adoption
Decision and Conclusion
Since the p-value in the model, p=0.000<0.05, we reject the H0 and accept H1 at 5% level of significance and
conclude that indeed at least the independent variables namely theexternal factors, personal factors and internal factors have some significant effect on the dependent variable the adoption of Computer-based Management Information Systems on quality service delivery in middle level Institutions.
Table 4. Model Summary for Sub-variable External and its Predictors.
Model Summary
Model R R Square Adjusted R Square Std. Error of the Estimate
1 .472a .223 .190 .451
a. Predictors: (Constant), Private enterprises support MIS implementation, There are government policies on MIS, The government supports MIS implementation, NGOs and charitable organizations support MIS implementation, Government policies interfere with MIS, There are funds from external sources towards MIS.
R square measures how much variability in the dependent variable the predictors account for. The R2 in this model was
found to be 0.223, which means that there is some significant relationship between external factors (22.30%) and adoption. This signifies that there is a positive none-linear correlation between external factors and the predictors.
The β value for a variable shows how much the value of the dependent variable changes when the value of the independent variable increases by 1, when other independent variables are held constant. A positive coefficient means that the predicted value of the dependent variable increases when the value of the independent variable increases. For example, the β value for there are funds from external sources towards MIS is 0.087 which is a sample estimate of the population parameter. It shows that when one unit of funds from external sources is added, then adoption of MIS is enhanced by 8.67% when all others are constant.
[image:6.595.313.554.139.207.2]From Table 4, all external factors’ subvariables except government policies on MIS and private enterprise support on MIS are statistically significant with the p-values being less than 0.05
Table 5. Anova for the Subv-variable ‘External’ and its Predictors
ANOVAb
Model Sum of Squares df Mean Square F Sig.
1
Regression 8.340 6 1.390 6.822 .000a
Residual 29.134 143 .204
Total 37.473 149
a. Predictors: (Constant), Private enterprises support MIS implementation, There are government policies on MIS, The government supports MIS implementation, NGOs and charitable organizations support MIS implementation, Government policies interfere with MIS, There are funds from external sources towards MIS.
b. Dependent Variable: Adoption
Decision and conclusion
Table 5 shows the variability of the dependent variable and its predictors. Since the p-value in the model, p=0.000<0.05, we reject H0, at 5% level of significance and
conclude that indeed at least the independent variable external factors have some significant effect on the dependent variable namely the adoption of Computer-based Management Information Systems on quality service
delivery in middle level Institutions.
4.3. Personal Factors
Table 6. Model Summary for Sub-variable personal and its Predictors
Model Summary
Model R R Square Adjusted R Square Std. Error of the Estimate
1 .460a .212 .190 .451
a. Predictors: (Constant), All employees see the importance of information systems, Information system will ease our work, Information systems will interfere with my job security, Information systems will improve the image of our institution
R square measures how much variability in the dependent variable the predictors account for. As shown in Table 6, the R2 in this model was found to be 0.212, which means that
there is some significant relationship between personal factors (21.2%) and adoption. This signifies that there is a positive none-linear correlation between personal factors and the predictors.
The β value for a variable shows how much the value of the dependent variable changes when the value of the independent variable increases by 1, when other independent variables are held constant. A positive coefficient means that the predicted value of the dependent variable increases when the value of the independent variable increases. For example, the β value for Information system will interfere with my job security is 0.008 which is a sample estimate of the population parameter. It shows that when one unit of Information systems is added then adoption of MIS is enhanced by 8% when the other independent sub variables are kept constant.
[image:6.595.58.297.484.587.2]It is also evident that sub variables of personal factors except information systems’ interference with job security have the p-values being less than 0.05 hence statistically significant.
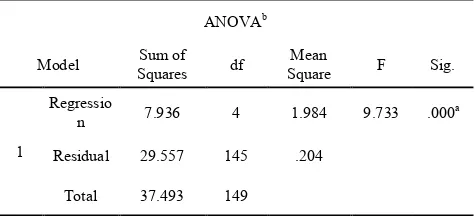
Table 7. Anova for Subvariable ‘Personal’ and its Predictors
ANOVAb
Model Squares Sum of df Square Mean F Sig.
1
Regressio
n 7.936 4 1.984 9.733 .000a
Residual 29.557 145 .204
Total 37.493 149
a. Predictors: (Constant), All employees see the importance of information systems, Information system will ease our work, Information systems will interfere with my job security, Information systems will improve the image of our institution
b. Dependent Variable: Adoption
[image:6.595.314.552.550.658.2]alternative accepted. Decision and conclusion:
Since the p-value in the model, p=0.000<0.05, we reject H0, at 5% level of significance and conclude that indeed at
least the independent variable personal factors have some significant effect on the dependent variable namely the adoption of Computer-based Management Information Systems on quality service delivery in middle level Institutions.
[image:7.595.58.297.574.685.2]4.4. Internal Factors
Table 8. Model Summary for sub-variable internal and its Predictors.
Model Summary
Model R R Square Adjusted R Square Std. Error of the Estimate
1 .463a .214 .187 .452
a. Predictors: (Constant), The government supports ICT, Organisation`s policies favor information systems, There are qualified ICT personnel in our institution, The administration is fully supporting the implementation of MIS, There is sufficient ICT infrastructure in the institution
R square measures how much variability in the dependent variable the predictors account for. As shown in Table 8, the R2 in this model was found to be 0.214, which means
that there is some significant relationship between internal factors (21.4%) and adoption. This signifies that there is a positive none-linear correlation between internal factors and the predictors.
The β value for a variable shows how much the value of the dependent variable changes when the value of the independent variable increases by 1, when other independent variables are held constant. A positive coefficient means that the predicted value of the dependent variable increases when the value of the independent variable increases. All other subvariables of internal factors except organisation’s policies and there are qualified ICT personnel in institutions have a p-value less than 0.05 hence, statistically significant.
Table 9. Anova for Sub-variable ‘Internal’ and its Predictors
ANOVAb
Model Squares Sum of df Square Mean F Sig.
1
Regressio
n 8.024 5 1.605 7.847 .000a
Residual 29.450 144 .205
Total 37.473 149
a. Predictors: (Constant), The government supports ICT, Organisation`s policies favor information systems, There are qualified ICT personnel in our institution, The administration is fully supporting the implementation of MIS, There is sufficient ICT infrastructure in the institution
b. Dependent Variable: Adoption
From Table 9, the analysis of variance reveals a
significance of 0 which is less than 0.5 therefore the hypothesis was rejected at 5% level of significance and the alternative accepted.
Decision and conclusion
Since the p-value in the model, p=0.000<0.05, we reject H0, at 5% level of significance and conclude that indeed at
least the independent variable namely the internal factors have some significant effect on the dependent variable namely the adoption of Computer-based Management Information Systems on quality service delivery in middle level Institutions.
5. Summary and Conclusion
From the study it is evident that external factors are related to adoption 22.30%. this indicates that adoption depend on external factors 22.30%. The study found out that some sub variables of the variable external factors do not significantly influence adoption and these include government policies and private enterprise support while funds from external sources, government policies interference, government support and charitable organizations support significantly influence adoption of MIS. Since the P-value in the model for external factor is less than 0.05 then the hypothesis is rejected. This signified that there is a significant relationship between external factors and adoption of computer-based MIS on quality service delivery in middle level institutions in Kenya.
The study found that one subvariable of the variable personal factors is not significant to adoption this is “information systems interference with job security” while “information systems will ease our work”,IS improving the image of the organization and all employees see the importance of information systems are significant. Since the P-value in the model for external factor is less than 0.05 then the hypothesis is rejected. This signifies that there is a significant relationship between personal factors and adoption of computer-based MIS on quality service delivery in middle level institutions in Kenya.
Moreover, the study found that some subvariables of the variable internal factors are not significant to adoption these include “organisation’s policies favor information systems” and “there are qualified ICT personnel in the institution” while “there are sufficient infrastructure” the administration fully supports implementation of MIS” and the government supports ICT are significant. Since the P-value in the model for external factor was less than 0.05 then the hypothesis is rejected. This signifies that there is a significant relationship between internal factors and adoption of computer-based MIS on quality service delivery in middle level institutions in Kenya.
purchase of relevant MIS equipments and machines, and putting policies in place to facilitate MIS adoption. However there exists a gap in the usage of these equipments in management of information notably arising from lack of adequate training on the utilization of the available machines, the MIS equipments fitness for the purpose and lack of proper integration criteria between the manual and the digitized procedures for information management.
6. Recommendations and Future Work
The study recommends the following:
An assessment on the trainings on MIS needs to be undertaken by the middle level institutions as well as coming up with a complete plan with both hardware and software requirements and information systems with databases interlinked for all user departments such that one can obtain all information concerning a particular user from any point.
Posting of most of information and services on the internet or shared database needs to be considered so that members of staff can be updating themselves on new technologies in IT.
To ensure smooth implementation, the training should engage the services of an IT company with the necessary technical capacity at the initial stages of implementation so as to develop a comprehensive MIS system.
Future work in MIS could consider the following:
Proper MIS needs assessment study for middle level institutions in the management of information.
Influence of Information Communication Technology in middle level institutions.
Automation in other areas of Information Communication Technology affecting information usage.
New emerging technologies which affect Information management.
How Cloud Computing can be incorporated in the management of middle level training institutions.
REFERENCES
[1] Al-Ghatani, S. S. (2003) Computer Technology Adoption in Saudi Arabia: Correlates of Perceived Innovation Attributes. Information Technology for Development 10(1), 57-69. [2] Castells, M. (2000) End of Millennium - The Information Age:
Economy, Society and Culture. Malden: Blackwell Publishers.
[3] Caldeira, M. M., & Ward, J. M. (2002). Understanding the successful adoption and use of IS/IT in SMEs: an explanation from Portuguese manufacturing industries. Information Systems Journal , 12, 121 - 152.
[4] Choi, T & Hong Y. (2002). Unveiling the structure of supply networks: case studies in Honda, Acura and DaimlerChrysler. Journal of Operations management, 20( 5), 420-480. [5] Choe, J., (2003). The effect of environmental uncertainty and
strategic applications of IS on a firm’s performance. Information and Management, 40, 257-268.
[6] Davis, F.D., Bagozzi, R.P., & Warshaw, P.R., (1992). Extrinsic and intrinsic motivation to use computers in the workplace. Journal of Applied Social Psychology, 22(14), 1111 - 1132.
[7] Davis, F.D., (1989). Perceived usefulness, perceived ease of use, and user acceptance of information technology. MIS Quarterly 13(3), 318–346.
[8] Delone, W.H., & Mclean, E.R., (2003). The DeLone and McLean model of information systems success: a ten-year update. Journal of Management Information Systems 19(4), 9–30.
[9] Delong, W.H., & Mclean, E.R., (1992). “Information systems success: The Quest for the dependent variable” Information systems research, 3(1), 60-80.
[10] Devon County Council LEA. ICT Straategy for Schools 2003-2006.
http://www.devon.go.uk?ict_strategy_for_schools_pdf. Accessed 5/2/13
[11] Dillon,A., (2001).User acceptance of information technology. In W. Karwowski (ed).Encyclopedia of human factors and ergonomics. London: Taylor and Francis.
[12] Dillon, A., & Morris, M.G., (1996). User acceptance of information technology: Theories and models. Annual Review of Information Science and Technology, 31(1), 3-32. [13] Doolin, B (2004). Power and resistance in Implementation of
Management Information Systems. Information Systems Journal, 14(4), 300-340.
[14] Douglas, Y. (2003). Understanding Competitive advantage in the hospital Industry: Evaluatiing Strategic Competencies. Strategic Management Journal, 24(4), 300-320.
[15] Doyle (2001). Information systems for you. 3rd edition.
Stanley Thornes ltd. UK.
[16] Doyle (1992). Computer Studies for you. Stanley Thornes ltd. UK
[17] Harper, G. R., and Utley, D. R. (2001). Organizational Culture and Successful Information Technology Implementation. Engineering Management Journal 13(2), 11-15.
[18] Huang, J.H, Lin, Y.R., & Chuang S.T., (2007). Elucidating user behaviour of mobile learning: A perspective of the extended technology acceptance model. The Electronic Library, 25(5), 586 – 599.
[19] Thong, J., Hong, W., Wong W-M, & Tam, K-Y., (2001/2002). Determinants of user acceptance of digital libraries: an empirical examination of individual differences and system characteristics. Journal of Management Information Systems 18(3), 97–124.
Institute for Higher Education Leadership and Management, 27-28 November, 2008, Melbourne, National Centre for Vocational Educational Research (NCVER): Adelaide, South Australia.
[21] Kenya government, (2007). Vision 2030: A globally competitive and prosperous Kenya Nairobi: Government printers.
[22] Kenya government, (2006). MOE strategic plan. Nairobi: Government printers.
[23] Kothari, C. (2004). Research Methodology Methods and Techniques. New Delhi: New Age International (p) Ltd. [24] Laudon, K.C., & Laudon, JP., (2003). Essentials of
management Information systems, Prentice Hall, New Delhi. [25] Leidner, D., & Kayworth., T. (2006). A Review of culture in information technology systems. Toward a theory of information technology culture conflict. MIS Quartely. 30(2), 357-399
[26] Long, M., (2010). TAFE funding and the education targets. Monash University –ACER: Victoria, Australia.
[27] Martin, L.H., (1964). Australian universities commission: Committee on the future of tertiary education in Australia. Government printer: Canberra, Australia.
[28] Miller, K., (2011). Welcome from the director. Perkins Collaborative Resource Network: Washington, DC., International Journal of Humanities and Social Science 1(10), Retrieved from http://cte.ed.gov/ Accessed 5/2/13.
[29] Misko, J., & Robinson, C. (2000). Competency-based training in Australia, in A.
[30] Arguelles & A. Gonczi (Eds.) Competency-based education and training: A world perspective. Editorial Limusa: Mexico. [31] Misko, J., & Halliday-Wynes, S. (2009). Tracking our success: How TAFE institutes evaluate their effectiveness and efficiency. National Centre for Vocational Educational Research (NCVER): Adelaide, South Australia.
[32] Moodie, G., (2003). The missing link in Australian tertiary education: Short cycle higher education. International Journal of Training Research, 1(1), 44-63.
[33] Moodie, G., Wheelahan, L., Billett, S., & Kelly, A., (2009). Higher education in TAFE: An issues paper. National Centre for Vocational Educational Research (NCVER): Adelaide, South Australia.
[34] Mugenda, O.M, & Mugenda, A. G, (1999). Research methods: quantitative and qualitative approaches, Nairobi, Act press. [35] McMahon, C. & Bruce, C. (2002) Information Literacy
Needs of Local Staff in Cross-Cultural Development Projects,
Journal of International Development, 14, 113-127.
[36] Nchunge, M., Sakwa, M. and Mwangi, W.(2012). User’s Perception on Ict Adoption For Education Support in Schools: A Survey of Secondary School Teacher’s in Thika District Kenya International Journal of Humanities and Social Science 2(10) [Special Issue – May 2012]
[37] Nyandiere, C. (2006). Increasing role of computer‐based information systems in the management of higher education institutions. Proceedings of the Seventh Annual Strathmore University ICT Conference. Strathmore University Press: Nairobi
[38] Obara, P.,Lelei.J., & Borura, C.(2010). Information Systems Implementation in State Corporations. A Critical Evaluation of the Process and Challenges in Kenyan Parastatals. African Journal of Business & Management (AJBUMA) http://www.aibuma.org/journal/index.htm 1(20), 237-260. Accessed 2/1/13.
[39] Pan, S. & Gary, S.C.(2005), Information systems Project abonadonment: A stakeholders analysis. International Journal of Information Management. 25(2), 160-180.
[40] Passey. D., Rogers. C.,Machell. J., McHugh.G., and Allaway.D., (2004) The Motivational Effect of ICT on Pupils. www.dfes.gov.uk/ictinschools Accessed 2/2/13
[41] Pejova, Z. (2002) Information Literacy: An Issue which Requests Urgent Action in Developing Countries and Countries in Transition. Paper presented at the UNESCO, the U.S. National Commission on Libraries and Information Science, and the National Forum on Information Literacy, for use at the Information Literacy Meeting of Experts.http://www.nclis.gov/libinter/infolitconf&meet/pape rs/pejova-fullpaper.pdf Accessed 2/2/13.
[42] Plotnick, E. (1999) Information Literacy, Definition of Information Literacy http://www.ericdigests.org/1999-4/info rmation.html. Accessed 2/12/13.
[43] Rogers, E. M., (2003). Diffusion of innovations (5th ed.). New York, NY: Free Press. Sabherwal, R., Jeyara,j. A. & Chowa, C., (2006). Information systems success: individual and organizational determinants. Management Science 52(12), 1849–1864.
[44] Saunders, et al. (2003) Research methods for business students (3rd edition) Harlow,FT Prentice Hall.
[45] Thong, J.Y.L., Yap C-S & Raman, K.S., (1996). Top management support, external expertise and information systems implementation in small businesses. Information Systems Research 7(2), 248–267.