Statistics Model for Meteorological Forecasting
Using Fuzzy Logic Model
Nitaya Jantakoon
Department of Applied Statistics, Faculty of Science and Technology, Rajabhat Maha Sarakham University, Thailand
Copyright©2016 by authors, all rights reserved. Authors agree that this article remains permanently open access under the terms of the Creative Commons Attribution License 4.0 International License
Abstract
The key atmospheric variables that impact crops are weather and rainfall. Extreme rainfall or drought at critical periods of a crop’s development can have dramatic influences on productivity and yields. The analysis of effect of rainfall is needed to evaluate crop production in Northeastern Thailand. Two operations were performed on the Fuzzy Logic model; the fuzzification operation and defuzzification operation. The model predicted outputs were compared with the actual rainfall data. Simulation results reveal that predicted results are in good agreement with measured data. Prediction Error and Root Mean Square Error (RMSE) were calculated, and on the basis of the results obtained, it can be suggested that fuzzy methodology is efficiently capable of handling scattered data.Keywords
Rainfall Prediction, Statistics Model, Meteorological Forecasting, Fuzzy Logic Model1. Background and Objectives
Meteorological forecasting is one of the most essential and demanding operational tasks carried out by meteoric services all over the world (Guhathakurata, 2006). In the past, Thailand was severe drought and flooding. These problems are expected to increase steadily and damage to the economy, agriculture, and subsistence. To mitigate this, effective planning and management of water resources is necessary. Forecasting the rainfall at different time scales is important to both short-term and long-term planning in agricultural production for successful crop selection and crop rotation planning. An accurate and timely rainfall forecast is crucial for reservoir operation and flooding prevention because it can provide an extension of lead-time of the flow forecast, larger than the response time of the watershed, in particular for small and medium-sized mountainous basins. In the short term, this requires a good idea of the upcoming season. In the long term, it needs realistic projections of scenarios of future variability and change (Abraham et al., 2001). Rainfall prediction is a very complex problem. Simulating the response using conventional approaches in modeling rainfall
In this research work, the focus is on the development of fuzzy logic model for meteorological forecasting in the Northeastern Thailand using fuzzy logic approach.
2. Methods
2.1. Description of Study Area
Northeastern Thailand called Isan is located on the Korat Plateau, bordered by the Mekong River (along the border with Laos) to the north and east, by Cambodia to the southeast and the Prachinburi Mountains south of Nakhon Ratchasima. To the west it is separated from Northern and Central Thailand by the Phetchabun mountain range. This area experiences Savanna climate which marks humid hot and dry weather alternatively with medium rain volume. There are 3 seasons including winter, rainy season and summer. Summer is between February and May. It is influenced by southeast monsoon from South China Sea and the Gulf of Thailand. Rainy season is between May and October with an influence of depression. Winter is between October and February. The region is influenced by northeast monsoon. Northeastern Thailand consists of 20 provinces which involve 25 meteorological stations.
2.2. Fuzzy Logic
[image:2.595.70.537.405.741.2]Fuzzy logic is a set of multiple-valued logics, which means there are more than two true values. It has variables which approximates the value between 0 and 1 based on reasoning. The term "fuzzy logic" was introduced by Lotfi A. Zadeh in 1965. The advantage of fuzzy logic is extended to image processing by Hamid Tizhoosh and others. Many difficulties realized frequently like uncertainty and vagueness during image analysis. These can be simplified by using fuzzy mathematical morphology. In fuzzy logic, values of variables are expressed by linguistic terms, the relationship is defined in terms of IF-THEN rules and the outputs are also fuzzy subsets which can be made crisp using defuzzification techniques. First the crisp values of system variables are fuzzified to express them in linguistic terms. Fuzzification is a method for determining the degree of membership that a value has to a particular fuzzy set. This is determined by evaluating the membership function of the fuzzy set for the value. A Fuzzy set is mathematical theory for describing the interested variables from uncertain factors or variables like seasonal inflows. The relationship between input and output variables is defined from fuzzy rule, according to human processes in thinking and decision. In addition, fuzzy rules are relatively easy to explain and understand.The key idea in fuzzy logic is the allowance of partial belongings of any object to different subsets of the universal set instead of belonging to a single set completely (Center and Verma, 1998).
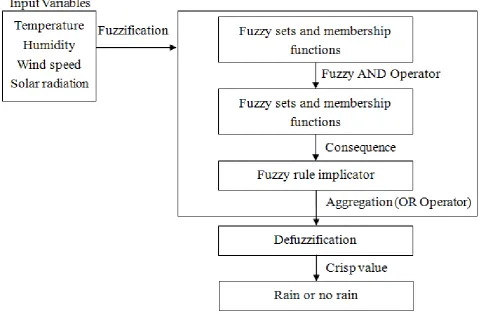
Figure 2. Fuzzy logic procedure of meteorological forecasting
2.3. Fuzzy Logic Modeling of Meteorological Forecasting A fuzzy logic model is also known as a fuzzy inference system or fuzzy controller. System inputs include the temperature, humidity, wind speed and solar radiation. Output is the rainfall data. There are four steps for developing fuzzy model as the following. The first step is to transform the crisp inputs into fuzzy variable through the membership function, called fuzzification process. The number and type of membership functions are constructed based on statistical data and experience of engineers, generally upon the considering problem. This study used the triangular membership function for describing the input and output variables. The second step, the fuzzy rule bases are created using the 5-min historical data of all parameters and fuzzy operator. The historical data were collected from each meteorological station. These fuzzy operators AND and OR are applied to combine the input variables. The third step is to apply the input membership functions and the rule bases to obtain the output of membership functions. This step is done by the implication method which obtaining a fuzzy set of output when given a single number of each inputs. Then the output membership functions of each rule are jointed to one output fuzzy set, called aggregation process. Finally, the process is defuzzification that a fuzzy set of output is converted into a single crisp value. The most common defuzzification method is the “centroid” evaluation, which returns the center of area under the curve.
In this work, a small number of linguistic terms (e.g., high, medium, low) referred to as fuzzy sets, are assigned to each variable (e.g., temperature). These fuzzy sets overlap and cover the necessary range of variation for that variable. The degree of membership (from 0 to 1) of a real valued input (e.g., temperature) to a particular fuzzy set A (e.g., high) is given by a membership function. This transformation of real valued inputs into a degree of membership in a particular fuzzy set is called fuzzification. Fuzzification of linguistic variables involves classification of parameters into linguistic labels and assigning membership functions for each of the variable. The four parameters used in this system are temperature, humidity, wind speed and solar radiation. Each of these parameters is classified into linguistic labels as shown in table 1.
Table 1. Linguistic labels for fuzzy variables No. Parameters Linguistic Labels
1 Temperature Very high TM, High TM, Medium TM, Low TM, Very low TM
2 Humidity Very high HU, High HU, Medium HU, Low HU, Very low HU
3 Wind speed Very high WS, High WS, Medium WS, Low WS, Very low WS
4 Solar radiation Very high SR, High SR, Medium SR, Low SR, Very low SR
[image:3.595.312.553.628.747.2]Table 2. Linguistic values and their ranges Linguistic Values Notations Numerical Ranges
Very Low VL [0, 0.3]
Low L [0, 0.4]
Medium M [0.3, 0.7]
High H [0.4, 0.8]
Very High VH [0.7, 1.0]
( )
( )
( )
( )
( )
( )
( )
"VL" var 0.3 "L" 0.0 var 0.4 var "M" 0.3 var 0.7 "H" 0.4 var 0.8 "VH" 0.7 var 1.0
if x
if x
Var x x if x
if x if x < ≤ <
= = ≤ <
≤ <
≤ <
(1)
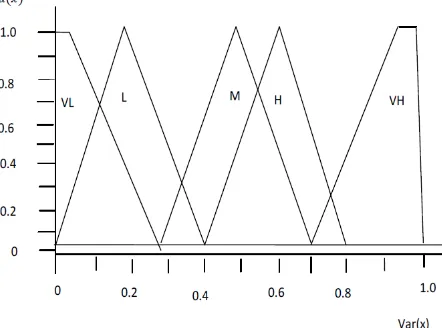
The linguistic expression for the variables and their membership functions are evaluated from the following triangular membership functions and it is defined by a lower limit a, an upper limit b, and a value m, where a < m < b.
( )
0, , 1, A x a x ax a x m
m a x b m ≤ −
= − < ≤
≥
2.3.1. Fuzzification
[image:4.595.64.285.557.721.2]The mathematical approach to derive the membership functions and fuzzy levels of a fuzzy variable were shown in Fig. 3 and Table 2. For example, value of x of a fuzzy variable yields two membership functions (μ1) 0.3 and (μ2) 0.7 and fuzzy levels L and M (point of intersections), respectively. Construction of appropriate production rules that are comprised of antecedent and consequent parts of IF. Then algorithms with logic based on past experiences of the decision makers. IF (TP is low) and (HU is high) and (DP is Very high) and (WS is high) and (PR is very low), then (RF is high).
Figure 3. Graph of membership function
Table 3. Values of rainfall parameters and their membership function Rainfall
parameters Fuzzy set value(y)
m
( )
ytemperature Low 0.3 0.35
Humidity High 0.7 0.76
Wind speed High 0.8 0.88
Solar radiation Very low 0.1 0.15
2.3.2. Min-Max Composition
From the rule definition, the AND operator is used. To evaluate the antecedent, the Mamdani min function is applied to determine the firing level ( α) of the rule as follows:
( ) ( ), ( )
A B y Min A y B y y Y
m ∩ = m m ∈
(
) (
)
(
) (
)
[
]
0.3 , 0.7 ,
0.8 , 0.1
0.35,0.76,1.0,0.88,0.15 0.15 TP HU Min WS SR Min m m α m m = = = = = = =
The value of the antecedent is multiplied by the weight factor to give a value which represents the degree of support (firing strength) for the rule FVi =αi iw where wi =1 therefore FVi=αi.
At the aggregation stage, output fuzzy sets of each rule (produced by implication method) are aggregated to form a single fuzzy set. The fuzzy max function (OR operator) presented in equation is used for aggregation
( ) ( ), ( ) .
A B y Max A y B y y Y
m ∪ = m m ∈
Suppose there are N rules for rainfall parameters and the fuzzy implication of each rule is represented as FV. Then is the fuzzy implication (firing strength) of the ith rule where
1,2,. , .
i= N Thus the final fuzzy value is the result of the aggregation operator
1, 2, , N .
FV Max FV FV= FV
2.3.3. Defuzzification
Defuzzification involves conversion of the linguistic variables to numerical or crisp values; this work adopts the centroid defuzzification method. This is given as follows:
1 1 n i i i n i i y Z α α = = =
∑
∑
2.4. Error Measures
The following error measures were calculated to ascertain the efficiency of the fuzzy rule-based model.
2.4.1. Prediction Error (PE)
ˆ
y y PE
y
− =
The predictive model is identified as a good one if the PE is sufficiently small i.e. close to 0.
2.4.2. Root Mean Square Error (RMSE)
RMSE is a good measure of prediction accuracy. It is frequently used to measure the differences between values predicted by a model and the values actually observed from the thing being modeled. These individual differences are also called residuals:
(
ˆ)
2i i y y RMSE
N
−
=
∑
where yi are observed values, yˆi are predicted values for rainfall and N is the number of observation.
3. Results
3.1. Formula and Equation
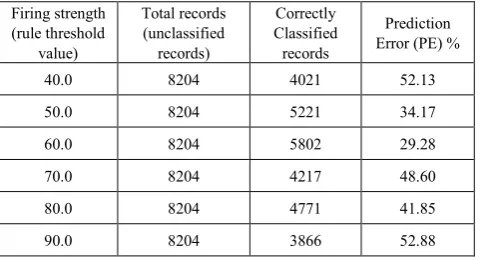
The parameters used for the prediction of rainfall are: temperature, humidity, wind speed and solar radiation. The values of these parameters were arranged as a string separated by comma to form a single record. These records were further normalized and fuzzified to be used to generate the rules used for prediction by the fuzzy logic system. Table 4 presents a summary of the result from fuzzy logic system. This table consists of firing strength for an acceptable rule, total records column is obtained from 2010 rainfall record data, correctly classified record column shows how many records from the total records were classified correctly and the prediction error of the classification.
Table 4. Values of rainfall parameters and their membership function Firing strength
(rule threshold value)
Total records (unclassified
records)
Correctly Classified records
Prediction Error (PE) %
40.0 8204 4021 52.13
50.0 8204 5221 34.17
60.0 8204 5802 29.28
70.0 8204 4217 48.60
80.0 8204 4771 41.85
[image:5.595.59.303.608.738.2]90.0 8204 3866 52.88
Table 5. Actual Values versus Predicted Values
Rainfall Condition Fuzzy Logic
Actual Predicted
Very low RF 8162 8093
Low RF 29 22
Medium RF 9 5
High RF 1 0
Very High RF 3 2
3.2. Prediction Error
In this study, we attempted to forecast the rainfall based on Fuzzy Inference System technique. As evident from Table 5, there have been few deviations of the predicted rainfall value from the actual. The performance evaluation of the Fuzzy Logic model was done by calculating Prediction error (PE) and Root Mean Square Error (RMSE). As the PE, RMSE values on data were comparatively less; the prediction model is reliable and efficient and can be used for rainfall prediction.
3.3. Acknowledgments and Legal Responsibility
The work of Nitaya Jantakoon was supported by a grant from the Research and Development Institute and Faculty of science and Technology, Rajabhat Maha Sarakham University, Thailand. The author is thankful to Dr. Hung T. Nguyen, and Dr. Vladik Kreinovich for valuable discussions.
REFERENCES
[1] Abraham, A., Philip N. and Joseph B. (2001). Soft Computing Models for Long Term Rainfall Forecasting. In: 15th European Simulation Multi conference (ESM, August/September 2001). Modeling and Simulation 2000, Kerckhoffs, E.J.H. and M. Snorek (Eds.). Czech Republic, Prague. 1044-1048.
[2] Ngamsantivong, T. and Buntao, N. (2013). Yager’s Combination of Probabilistic and Possibilistic Knowledge: Beyond t-Norms. Journal of Uncertain Systems. 7(3), 186-189.
[3] Buntao, N. and Kreinovich, V. (2011a). Uniqueness of Reconstruction for Yager’s t-Norm Combination of Probabilistic and Possibilistic Knowledge. International Journal on Intelligent Systems. 27(1), 16-22.
[4] Buntao, N. and Kreinovich, V. (2011b). How to Combine Probabilistic and Possibilistic (Expert) Knowledge: Uniqueness of Reconstruction in Yager’s (Product) Approach. International Journal of Innovation Management, Information and Production. 2(1), 1-9.
[6] Guhathakurta, P (2006). Long-range monsoon rainfall prediction of 2005 for the districts and sub-division Kerala with artificial neural network. Current Science. 90:773-779. [7] Wong, K.W., Wong P.M., Gedeon T. D. and Fung C.C. (2003).
Rainfall prediction model using soft computing technique. Soft Comput. Fusion Foundat. Methodol. Appli.7:434-438. [8] Karamouz, M., Zahraie B. and Eghdamirad S. (2004).
Seasonal rainfall forecasting using meteorological signals.
Proceedings of the 1st Conference of Iran Water Sources Management. Nov. 15-16, Technological Faculty, Tehran University, pp: 60-72.
[9] Suwardi A., Takenori K. and Shuhei K. (2006). Neuro-fuzzy approaches for modeling the wet season tropical rainfall. J. Agric. Inforam. Res., 15: 331-334.