17
Norbahiah Misran(1) , M. Y. Ismail(2) and M. T. Islam(1)
1 Institute of Space Science, Universiti Kebangsaan Malaysia.
Electrical, Electronic and System Engineering Department, Faculty of Engineering, Universiti Kebangsaan Malaysia.
2Wireless and Radio Science Centre (WARAS)
Universiti Tun Hussein Onn Malaysia 86400 Parit Raja Batu Pahat Johor
email: [email protected]
Abstract
This paper presents the design of a low RCS reflectarray at 8.52 GHz by replacing the solid metal sheet behind the antenna with a band stop frequency selective surface. A 50 element linear array of omni-directional elements was used to simulate the far field pattern of a reflectarray with
f/D=0.325 in the plane of the elements to assess the effect of an imperfect aperture distribution on
the gain and sidelobe levels. It is found that the reflection loss variation across the aperture does not have a significant effect on the radiation pattern of the antenna, because for the layout that was studied, only a few of resonant loops were predicted to give a significantly different loss than the others in the array. Simulated and measured results show that the ‘in-band’ reflection phase response of the structure with metal ground plane and with a periodic FSS ground plane is very similar, however the periodic ground plane reduces the ‘out of band’ reflectivity by more than 4 dB, thereby decreasing its RCS profile to these signals.
Keywords:reflectarray, frequency selective surface, radar cross-section, radar.
18
1. INTRODUCTION
The word radar, first used by the US Navy
in 1940, is derived from ‘radio detection and
ranging’ thus conveying these two purposes of detection and location (Kingsley and Quegan, 1992). It is a system or technique for detecting the position, movement and nature of a remote object by means of radio waves reflected from its surface. The word radar is also used to denote the apparatus for implementing the technique. Radar involves the transmission of pulses of electromagnetic waves by means of a directional antenna. Some of the waves are reflected by the objects that intercept them, and these reflections are detected by the radar receiver, processed electronically and converted into a visible form by means of a cathode-ray tube or solid state display (Kingsley and Quegan, 1992).
The radar cross-section (RCS) (White, 1998) of a target is a direct measure of its visibility to radar, and therefore it is an important factor to consider in the design of commercial and defence systems. In addition, the radar antennas themselves often present a high RCS, and therefore a reduction in their visibility is often required to remain undetected for as long as possible. For example, this is very important for antennas which are located in the front end of missile systems and aircraft, particularly when these structures are designed to be stealthy such as the US B-2 stealth bomber (White, 1998).
Reflectarray antenna is a type of antenna that consists of a flat array of periodic elements on grounded substrate that produces a progressive phase shift when illuminated by a primary source (Pozar et al, 1997). It was first created to replace the parabolic reflector antenna. This type of antenna is cheaper and easier to manufacture than conventional parabolic reflector but it suffers with limited bandwidth. The simplest proposed method to overcome this limitation is by varying the dimensions of each re-radiating element about its nominal size.
A reflectarray when used as a high gain radar antenna exhibits a very high RCS at angles close to boresight at all frequencies, because of the metal sheet which is located underneath the substrate (i.e. background of the
antenna). In this paper, the performance of a concentric ring reflectarray element backed by a solid metal ground plane and backed by a frequency selective surface (FSS) (Misran et al, 2003a) is compared. Report from open literatures show that one way to reduce the RCS for a reflectarray antenna is by rotating the antenna itself (Hum et al, 2004) however, this can only be done for tunable reflectarray antenna applications. Another method to control RCS is by varying the air layer thickness between the ground plane and reflectarray element which was only reported recently (Chang, 2006).
The objective of this work is to demonstrate that the reflectarray, when backed by an FSS, does reduce the RCS of the structure by limiting its reflection band (8.5 GHz – 9.9 GHz) to a narrow range of frequencies close to the operating frequency of the antenna. Simulated and measured results are compared to highlight the reduction in the radar visibility of the structure, which is designed for operation at 8.52 GHz (X-band). Predicted far field radiation patterns of a stealthy 50 element linear reflectarray are presented, to investigate the effect of the FSS ground plane which is shown to give a reflection loss which varies with ring size.
2. ANTENNA RADAR CROSS-SECTION
THEORY
RCS is a measure of a target’s ability to reflect radar signals in the direction of the radar receiver. In many applications, antennas are mounted on the surface of other complex shaped structures, and these then become part of the overall radar target. Many antennas especially aperture type reflectors, become large contributors to the total visibility of the target, therefore, to design low-observable objects, the RCS of the antenna must be minimized (Gary, 1990).
19
reflected power is a function of the shape, size and the surface reflectivity, but for metallic objects, shape usually is the primary consideration.
The RCS, of general shapes depends
firstly on the physical cross-section at area of
the target, Ae and secondly on the gain, G; and
it is given by the product of these two factors:
= 10 log AeG (dBm2)
(1)
The gain is a measure of whether a target concentrates or spreads the power it intercepts in the particular direction of interest, whether it changes the polarisation, and whether it absorbs any power rather than reradiating it. For flat plate antennas, such as the reflectarray antenna,
the RCS at wavelength is defined as (Misran,
2003a; Skolnik, 1980);
= 4Ae2/2 (m2)
(2)
From the RCS equation in (2), a flat metal plate viewed broadside can appear 1000 times larger than the same size metal sphere. Therefore, the RCS of a reflectarray antenna, which is essentially a flat conducting sheet, is very high over a narrow range of angles when the structure is illuminated by a radar system.
Although the operating bandwidth of a reflectarray is typically only a few percent (Pozar et al, 1997; Misran et al, 2002; Misran et al, 2003b) at other frequencies, the metallization on the backside of the substrate surface presents a high boresight radar cross-section. In this paper a significant reduction in the RCS of a reflectarray antenna is demonstrated by replacing the solid conducting ground plane with a band stop FSS which is designed to reflect energy over the operating frequency of the reflectarray.
3. HELP LOW RCS REFLECTARRAY ELEMENT DESIGN AND
PERFORMANCE
A dual resonant periodic surface consisting of a concentric ring array above a ground plane (Misran et al, 2002; Misran et al, 2003) was employed to design the broadband low RCS
reflectarray. The objective was to demonstrate that replacing the solid ground plane with an FSS array as shown in Figure 1, has very little impact on the phase variation with loop size and reflection loss around the operating frequency of the antenna. This occurs when the periodic structure is designed to resonate at 8.52 GHz, but at other frequencies the surface is largely transmissive and therefore the RCS is significantly lower.
A concentric ring (Cahill and Parker, 1981)
array of inner to outer (I/O) radius ratio 0.86
(outer ring radius=3.25 mm and inner ring radius=2.8 mm) was modeled using
Micro-stripesTM (Micro-stripes, 2006), without a
ground plane. The elements which were arranged on a 10 mm square lattice and printed
on a 1.524 mm substrate (r=3.54 and
tan=0.0018) are predicted to resonate at 9.0
20
Figure 1 Periodic cell of reflectarray element (a) with solid ground plane (b) with FSS
ground plane. d1 & d2= mean diameter of outer
and inner ring respectively. I/O = d2/d1= 0.86,
d3=7.0 mm, a =10 mm, r = 3.54, t = 1.524 mm
Figure 2 Computed frequency swept reflection phase response for a concentric ring array without ground plane and a single ring FSS of
radius 3.9 mm.
Whenthe concentric ring array and the FSS
ground plane of loop radius 3.9 mm are stacked together (Figure 1(b)), the computer model simulates that this structure resonates at 8.13 GHz and 9.80 GHz as shown in Figure 3. These resonant frequencies differ when nested rings of the same dimensions are positioned above a
[image:4.595.302.512.173.363.2]solid ground plane, in which the outer and inner loops resonate at 8.52 GHz and 9.9 GHz respectively, as plotted in Figure 3. Therefore, the diameter of the rings which are used in the FSS ground plane must be modified in the simulator software to shift the resonant frequencies upwards.
Figure 3 Predicted swept frequency phase response for a concentric ring array positioned
above a solid ground plane and a ring FSS ground plane.
The dimensions of the periodic ground plane was optimised using the Transmission Line Matrix (TLM) computer model by observing the surface current plot for the two arrays which is presented in Figure 4 to Figure. In this simple design approach, the periodicity of the elements on the upper and lower surface was fixed to 10 mm and the concentric ring inner and outer radius was 3.25 mm and 2.8 mm respectively; therefore, the only variable was the ground plane ring size. The surface
current plot obtained from Micro-stripesTM was
observed for the concentric ring array and also the ring FSS which serves as the ground plane. When the ground plane and the outer ring of the former resonate at 8.52 GHz, the surface plots give the maximum surface current.
[image:4.595.75.277.379.574.2]21
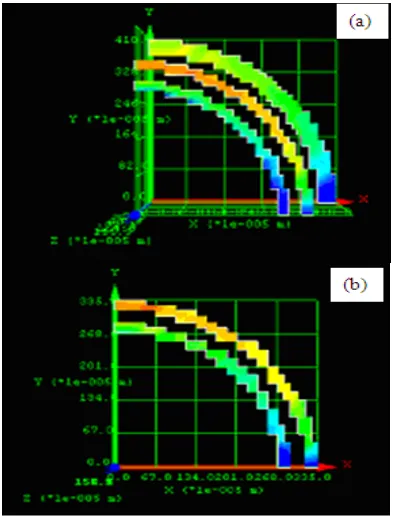
Figure 4 (a) Current distribution at 8.52 GHz for concentric ring array backed by a 3.9 mm
ring radius of FSS ground plane (b) Current distribution at 8.52GHz for concentric ring array backed by solid ground plane. (Red=0 dB, yellow=-10 dB, green=-30 dB, blue=-40
[image:5.595.312.519.108.366.2]dB)
Figure 5 (a) Current distribution at 8.52 GHz for concentric ring array backed by a 3.7 mm ring radius of FSS ground plane (b) Current
distribution at 8.52GHz for concentric ring
array backed by solid ground plane (Red=0 dB, yellow=-10 dB, green=-30 dB, blue=-40 dB)
Figure 6 (a) Current distribution at 8.52 GHz for concentric ring array backed by a 3.5 mm ring radius of FSS ground plane (b) Current
distribution at 8.52GHz for concentric ring array backed by solid ground plane.(Red=0 dB,
[image:5.595.87.287.418.664.2]22
Figure 7 (a) Current distribution at 8.52 GHz for concentric ring array backed by a 3.3 mm ring radius of FSS ground plane (b) Current
distribution at 8.52GHz for concentric ring array backed by solid ground plane.(Red=0 dB,
[image:6.595.303.510.75.259.2]yellow=-10 dB, green=-30 dB, blue=-40 dB) Figure 4 to Figure 7 show that the current distribution on the concentric ring array can be modified by the size, and hence, the resonance of the ground plane rings. When the ring radius is 3.3 mm, the resonant frequency of the concentric ring array is shifted from the operating frequency of 8.52 GHz since the amplitude of the current in the two rings is shown to be quite low. This is because of the coupling effect between the concentric rings and the FSS rings at the back of the array. However, Figure 4 to Figure 7 show that the current distribution across the surface of the concentric ring elements is similar over a range of ground plane ring sizes between 3.5-3.9 mm, but the current which flows in the ground plane loops is different for each ring radius, thus indicating a strong resonant response from the concentric ring elements. Loops of radius 3.5 mm give the highest surface current amplitude at 8.52 GHz. Figure 8 confirms that this reflectarray element resonates at the same frequencies when the solid ground plane is replaced by an array containing the 3.5 mm radius rings.
Figure 8 Simulated reflection phase versus frequency referenced to a perfectly conducting screen for a concentric ring array printed above solid ground plane and 3.5 mm radius ring FSS
ground plane.
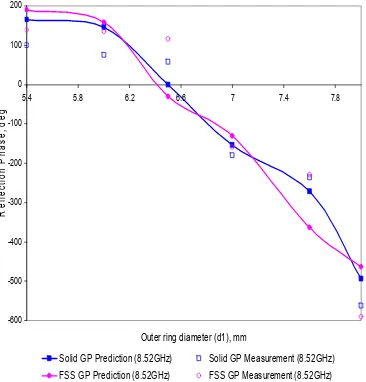
The reflection phase versus the outer ring radius has been computed at normal incidence and the results are compared in Figure 9 with the predicted response at 8.52 GHz when the periodic screen is positioned above a solid conducting ground plane. The predicted linear phase slope of the two structures is very similar, and therefore, as shown in Figure 9, the linear phase change with ring radius (3-3.5
[image:6.595.305.488.488.679.2]mm) for both is 330.
Figure 9 Simulated and measured reflection phase versus ring size referenced to a perfectly
conducting screen at 8.52 GHz. -180
-140 -100 -60 -20 20 60 100 140 180
7 7.5 8 8.5 9 9.5 10 10.5 11
Frequency, GHz
R
ef
le
ct
ed P
ha
se,
de
g
Solid GP FSS GP
-600 -500 -400 -300 -200 -100 0 100 200
5.4 5.8 6.2 6.6 7 7.4 7.8
Outer ring diameter (d1), mm
R
e
flec
tion P
has
e,
de
g
23
The reflection phase of the reflectarray elements relative to a metal sheet was measured using the waveguide simulator (Hannan and Balfour, 1965). The concentric ring patterns were printed on a double sided copper clad
1.524 mm thick substrate with r=3.54 and tan
=0.0018. Two sets of samples were fabricated; one with the copper backing left intact, and on the other the FSS ring pattern shown in Figure
1(b) was etched. The S11 response at 8.52 GHz
was measured and although the measurements were made close to the cut-off frequency of the input coaxial to waveguide transition, this simple experimental procedure yielded results which, as shown in Figure 9, are in a good agreement with the computer model. Although the Q factor of the phase plot is higher than predicted, the measured linear phase range (radius=3.25-3.55 mm) of the reflectarray elements with the solid metal and FSS ground
planes was found to be approximately 290 and
330 respectively, which is in good agreement
with the computer model. The Q factor or
quality factor is particularly useful in determining the qualitative behavior of a
system. A system with a high Q response falls
off more rapidly as the frequency moves away from resonance (Wikipedia, 2007).
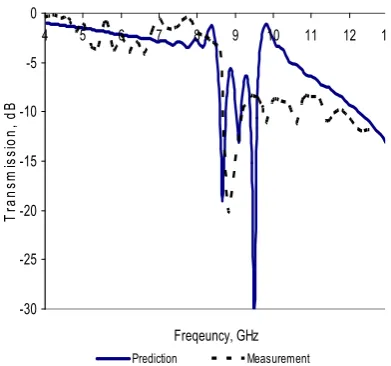
[image:7.595.315.525.176.318.2]To demonstrate that the FSS ground plane can reduce the RCS of the flat plate antenna, the plane wave transmission coefficients of this structure were computed at normal incidence over the frequency range 4-13 GHz. In Figure 10 the first resonance (-20 dB) at 8.52 GHz (outer ring resonance), corresponds to the operating frequency of the antenna, where the phase response of the elements is computed in Figure 9. However, outside this range, the reflection loss through the antenna is significantly lower, particularly in the band 4-8 GHz, in which the equivalent reflection loss of the reflected signal relative to a flat plate (conventional reflectarray antenna) is typically 4 dB.
Plane wave transmission coefficients were measured in the range 4.0-12.5 GHz by
inserting a 30 cm 30 cm FSS grounded
reflectarray surface between pairs of standard gain horns as shown in Photo 1. In Figure 10, the experimental results, which are shown to be
in good agreement with the Micro-stripesTM
predictions, highlight the potential RCS reduction that can be achieved, particularly below the operating frequency of the antenna. Above this range, scattering from the structure increases as the frequency approaches the higher order resonances of the two-layer ring array.
Photo 1 Experimental set up for measuring the transmission response of a low RCS
reflectarray antenna.
Figure 10 Measured and simulated transmission through the concentric ring reflectarray with 3.5 mm radius ring FSS
ground.
4. FAR-FIELD PATTERN CALCULATIONS
The predicted reflection loss of the ring elements in the range 3-3.5 mm is -1.5 dB,
-30 -25 -20 -15 -10 -5 0
4 5 6 7 8 9 10 11 12 1
Freqeuncy, GHz
T
ra
n
sm
is
si
o
n
, d
B
[image:7.595.323.519.384.567.2]24
however, beyond the linear phase range, the loss for the low RCS configuration is shown to be up to 7.5 dB higher as shown in Figure 11. This increase in reflection loss could potentially result in the deterioration of the reflectarray antenna radiation pattern parameters such as the antenna gain and the beamwidth.
Figure 11 Computed reflection phase and reflection loss versus outer ring radius referenced to a perfectly conducting screen at 8.52 GHz for a concentric ring array backed by
solid ground plane and FSS ground plane.
The impact of lossy elements on the radiation pattern of a reflectarray antenna has therefore been investigated. In this work the effect on the antenna gain (Balanis, 1997), sidelobe levels and beamwidth has been predicted using the NEC-Win Pro (NEC-Win, 2006) computer model. For radar applications, it is essential to minimise the power which is transmitted in the sidelobes (Cheng, 1993) since energy transmitted outside the main beam leads to a reduction in the gain (Balanis, 1997) and most importantly increases the susceptibility of the radar to jamming. Beamwidth and gain are related parameters, which define the focussing power of the reflector antenna. Generally the gain of the radar antenna should be high to improve the accuracy of the target detection.
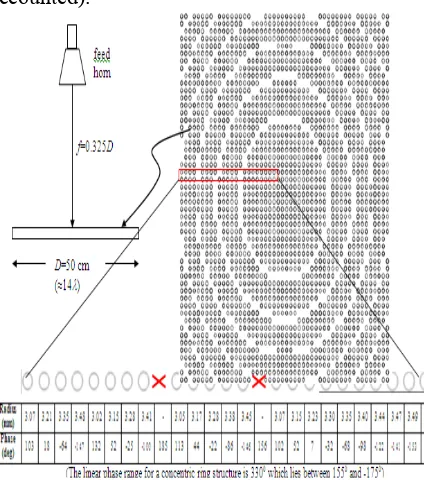
In this work, the layout of a 50 element
(hence f/D ratio is 0.325 with element spacing
of 10 mm) the size of antenna linear array of grounded concentric rings has been plotted using software developed by Wylie (2003) which based on array tracing generates the size and the reflection phase of each ring for a given
antenna f/D ratio and frequency. The layout at
8.52 GHz for a concentric ring reflectarray
design with an f/D ratio value of 0.325 (Pozar
et al, 1997) is shown in Figure 12. Whenever the radius of each element is calculated, Figure 11 can be used to determine the loss at each position in the linear array. The phase and the reflection loss associated with each loop element was then transformed to provide the amplitude and phase of the voltage sources of a 50 element dipole array which was modelled using NEC-Win Pro as shown in Figure 13. The separation of the dipoles was the same as the spacing between the rings i.e. 10 mm. This linear dipole arrangement can be used to give the far field radiation pattern of a 50 x 50 element array in the Y-Z plane shown in Figure 12.
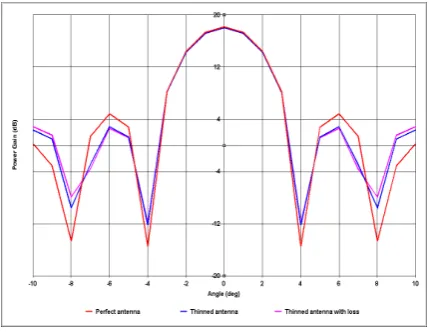
Figure 14 shows the predicted far field radiation patterns in the Y-Z plane, where the perfect antenna pattern represents an ideal reflectarray with a solid ground plane, which gives maximum directivity when the elements are excited with equal amplitude and phase. Wylie model (Wylie, 2003) shows that 4 of the 50 concentric rings are required to produce a
reflection phase of more than 3300, which is
beyond the available phase range shown in Figure 14. Therefore, in the NEC-Win Pro model, the elements were removed to give the thinned antenna radiation pattern shown in Figure 14. Each element in the thinned antenna (8% of the elements are removed) is excited by voltage source of 1 Volt, and therefore since this is assumed to be an ideal antenna, the variation in reflection loss (as shown in Figure 11) is not accounted for.
The computed results for the thinned array in Figure 14 show that the far-out sidelobes are
slightly higher especially at 45o from boresight.
In this design, the elements are symmetrical across the antenna so the radiation pattern is
also symmetrical. The gain, G of an array
antenna is calculated using the expression below: -600 -500 -400 -300 -200 -100 0 100 200
2.6 2.8 3 3.2 3.4 3.6 3.8 4
Outer ring radius (mm)
R ef le ct ion P has e (d eg ) -2 0 2 4 6 8 10 R et ur n l oss (d B )
[image:8.595.76.279.189.388.2]25
G (dB) = 10 log10 (Number of elements)
(3)
[image:9.595.313.531.71.221.2]Therefore the gain of a 50 x 50 element dipole array is approximately 34 dB. The gain of the uniformly excited 50 element linear dipole array is predicted to be 18.20 dB whereas the NEC-Win Pro gives a value of 18.06 dB for the thinned array (no loss accounted).
Figure 12 Screen shot of a 50 x 50 concentric ring thinned array at 8.52 GHz.
Figure 13 50 element dipole array modeled in NEC-Win Pro operates at 8.52 GHz in free
space. (Dipole length=20 mm, wire radius=0.25 mm, element separation=10 mm,
[image:9.595.92.304.194.434.2]voltage source excitation).
Figure 14 Predicted radiation pattern for a perfect antenna, a thinned antenna without loss
and a thinned antenna with loss at 8.52 GHz. (Loss is calculated for reflecting element
above solid ground plane).
Since each concentric ring has a loss which depends on the loop diameter, the effect of the resulting amplitude distribution needs to be accounted for to predict the far field antenna pattern. The loss associated with each element in the layout of the reflectarray shown in Figure 12 was determined from the predicted plots given in Figure 11. These values were used to provide the required amplitude distribution which was mapped onto the voltage source excitation of the dipoles in the NEC-Win Pro model for the thinned array. When the predicted radiation pattern of this structure was compared to the previous models, the high far-out sidelobes were found to be similar in amplitude to the thinned antenna array with uniform amplitude distribution.
The maximum gain of this antenna is predicted to be 18.07 dB. For these three models (perfect antenna, thinned antenna with and without loss), the beamwidth is predicted
to be 4o. The reflection loss variation for the
[image:9.595.86.305.480.594.2]26
[image:10.595.73.288.147.313.2]of four rings, this increases to 30.26 dB below the main beam as shown in Figure 16. Null filling is a consequence of the phase errors which occur because of the removal of the four rings.
Figure 15 Predicted radiation pattern for a perfect antenna, a thinned antenna without loss
and a thinned antenna with loss at 8.52 GHz highlighting the main beam and first two sidelobes. (Loss is calculated for reflectarray
element above solid ground plane).
The predicted pattern of the thinned array with loss is compared to the low RCS antenna in Figure 16 and 17, where it is shown that the gain is reduced slightly to 18.05 dB, but the beamwidth is unchanged. The reflection loss of the reflectarray element with a periodic ground plane was modelled by observing the variation of the reflection loss with the radius of the concentric rings. However, this variation which is plotted in Figure 11, is very small except beyond the linear phase where the outer ring radius is 3.7 mm. For the layout given in Figure 12, the reflection loss of only 4 out of the 50 rings exceed 2 dB, hence the similarity between the computed results. Figure 11 shows that the low RCS reflectarray has small phase ripple in the linear range where the outer ring radius varies between 3-3.5 mm. The effect of the phase errors was modelled using NEC-Win Pro which predicts a further reduction in gain to 17.80 dB. The phase non-linearity, which results when the solid ground plane is replaced with an FSS ground plane, has a larger impact on the antenna gain than the amplitude
distribution which results from the variation in reflection loss.
[image:10.595.299.509.262.455.2]Figure 17 shows that the near in sidelobe level of the three antennas is predicted to be very similar but in Figure 16 the effect of phase errors is shown to significantly increase the far out sidelobe levels. The first null for the thinned antenna with the solid ground plane is predicted to be 30.27 dB below the main beam, whereas with the FSS ground plane with the phase errors included in the model, this is predicted to be 3.5 dB higher. However, the loss variation and phase error does not change the antenna beamwidth.
Figure 16 Predicted radiation pattern for a thinned reflectarray antenna with loss, a low RCS antenna with loss (solid ground plane) and a low RCS antenna after accounting for
phase errors at 8.52 GHz.
Figure 17 Predicted radiation pattern for a thinned reflectarray antenna with loss (solid ground plane) a low RCS antenna with loss and
[image:10.595.299.510.513.645.2]27
5. CONCLUSIONS
In this paper, a technique for reducing the RCS of a reflectarray antenna has been investigated where the solid metal sheet behind the substrate is replaced by bandstop FSS ground plane. The performance of a concentric ring reflectarray element backed by the two types of conducting surfaces is compared. Simulated and measured results show that the ‘in-band’ reflection phase response of the two structures is similar. However, the ‘out of band’ reflectivity of the reflectarray antenna is reduced by 4 dB or more when the metal ground plane is replaced by an FSS, thereby decreasing its RCS profile to these signals. The reflection loss of the FSS backed reflectarray element was found to vary more with loop size compared to a solid metal backed structure. A 50 element linear array of omni-directional elements was used to simulate the far field pattern of a reflectarray with
f/D=0.325 at 8.52 GHz in the plane of the
elements. In this way, the effect of an imperfect aperture distribution on the gain and sidelobe levels can be assessed. The computer model showed that, reflection loss variation across the aperture does not have a significant effect on the radiation pattern of the antenna, because for the layout that was studied, only a few of resonant loops were predicted to give a significantly different loss than the others in the array. However, the predicted results show that the non-linear phase variation of the FSS backed reflectarray element, which is shown in Figure 11 is more important and the resultant degradation in the aperture distribution of this plate antenna was found to reduce the gain by 0.4 dB relative to a reflectarray antenna with uniform amplitude and phase distribution across the aperture. Furthermore, the predicted far out sidelobe levels of the low RCS reflectarray is shown to be up to 10 dB higher, and there is evidence of null filling because of the phase errors which cause defocusing of the beam. Nevertheless, the predicted patterns are in general similar to those which are generated by a reflectarray with a solid ground plane, but outside the operating frequency band (below 8.5 GHz and above 9.9 GHz), the visibility of the antenna to radar is significantly lower.
REFERENCES
[1] Balanis, C.A., (1997) “Antenna Theory: Analysis and Design”, John Wiley and Sons, New York.
[2] Cahill, R., and Parker, E.A., (1981) “Concentric ring and Jerusalem Cross arrays as frequency selective surfaces for a
450 incident diplexer”, Electronics Letters,
vol. 18, pp. 313-314.
[3] Chang, T.N., (2006) “Gain Enhancement
for Reflectarray”, PIERS Online, 2, (6),
pp. 601-604.
[4] Cheng, D.K.,(1993) “Fundamentals of Engineering Electromagnetics”, Addison-Wesley Publishing Company, Inc., USA. [5] Gary, E.E., (1990) “Antenna Measurement
Technique”, Artech House, Inc.
[6] Hannan, P.W., and Balfour, M.A., (1965) “Simulation of a phased-array antenna in
waveguide”, IEEE Trans. Antennas
Propag., 13, (3), pp. 342-35.
[7] Hum, S.V., Okoniewski, M., and Davies, R.J., (2004) “A reconfigurable antenna based on an electronically tunable
reflectarray”, Proceedings of the 16th
International Conference on Wireless Communications (Wireless 2004), vol. 2, pp. 532-541.
[8] Kingsley, S.P., and Quegan, S., (1992) “Understanding Radar Systems”, McGraw-Hill, England.
[9] MICRO-STRIPESTM is a Trademark
software product of FLOMERICS, www.flomerics.com Online. (Accessed 24 July 2006)
[10] Misran, N., Cahill, R., and Fusco, V.F., (2002) “Reflection phase response of microstrip stacked ring elements”,
Electron. Lett., 38, (8), pp. 356-357. [11] Misran, N., Cahill, R., and Fusco, V.F.,
(2003) “Design optimisation of ring elements for broadband reflectarray
antennas”, Proc. IEE Microwaves
Antennas and Propagation, 150, (6), pp. 440-444.
[12] Misran, N., Cahill, R., and Fusco, V.F., (2003) “RCS reduction technique for
reflectarray antennas”, Electron. Lett., 39,
28
[13] NEC-Win Pro V1.1,
www.nittany-scientific.com Online. (Accessed 24 July
2006).
[14] Pozar, D.M., Targonski, S.D., and Syrigos, H.D., (1997) “Design of millimeter wave
microstrip reflectarrays”, IEEE Trans.
Antennas Propag., 45, (2), pp. 287-295. [15] Skolnik, M.I., (1980) “Introduction to
Radar Systems”, Second Edition, McGraw-Hill Kagakusha, LTD.
[16] Wikipedia, www.wikipedia.com. Online.
(Accessed 15 August 2007).
[17] White, M.O., (1998) “Radar cross-section: measurement, prediction and control”,
IEE Electron. & Comm. Eng. J., pp. 169-180.
[18] Wylie, D.G.W, (2003) “The design of a software program to generate a
reflectarray antenna layout”, BEng.