INTEGRATING TECHNOLOGY INTO CLASSROOM
INSTRUCTIONS FOR REDUCED MISCONCEPTIONS IN
STATISTICS
I N T E G R A T I N G T E C H N O L O G Y I N T O C L A S S R O O M I N S T R U C T I O N S
F O R R E D U C E D M I S C O N C E P T I O N S I N S T A T I S T I C S
Maizam Alias
Tun Hussein Onn University of Malaysia, Malaysia
Abstract
Misconceptions in statistics among students of non-statistics major are quite common. This paper will present the humble efforts of the author in trying to reduce misconceptions among her statistics students using technology. The examples were drawn from the teaching and learning of statistics to Master of Technical and Vocational Education students in the Tun Hussein Onn University of Malaysia. EXCEL spreadsheet, power point presentation slides and concept mapping tool were integrated into classroom instructions for the topic of descriptive statistics. Increased class-room interactions were observed through out the learning process and a decrease in the percentage of students committing the identified misconceptions were recorded. Overall, the experience was a rewarding one for the author as well as the students.
INTRODUCTIONS
Statistics is an important tool not only in research but also in everyday usage. Statistics knowledge is not only relevant to those who intent to become statisticians but also to others such as teachers, engineers, businessman etc. Therefore, some training in statistics is provided in almost all higher degree programmes including engineering, teacher training, medicine etc.
Understanding of statistical concepts however does not come easily to many students and as such more and more educators are embarking on research on statistics teaching and learning (Callaert, 2006; Tempelaar, 2006; Rumsey, 2002 and Keeler & Steinhorst, 2001). Hard to eradicate misconceptions have been found among all levels of education including higher degrees as well as among teachers and lecturers who teach statistics and research methods (Krauss & Wassner, 2002 in Batanero, n.d.). Misconceptions have been found among university students on associations and correlations (Morris 1999, Estapa & Sanches Cobo, 2001), hypothesis testing (Lecoutre & Lecoutre 2001 in Batanero n.d) and probability (Keeler & Steinhorst,
2001).
INSTITUTIONAL CONTEXT
Statistics is one of the subjects taught to the Masters of Technical and Vocational Education students in the Tun Hussein Onn University of Malaysia (UTHM). The students who were enrolled into this programme came from diverse undergraduate background such as engineering, business studies and information technology. Statistics is taught during the second semester, with two hours of lecture and three hours in the laboratory. Teaching and learning activities include lectures, practices on using statistical package and spreadsheets, mini-projects and individual and group presentations by students.
THE PROBLEM
Although statistics is not something new to the education students but their previous learning emphasis appears to be on calculations and memorization of formulae. In general these students are apprehensive of statistics and most of them perceive statistics as nothing more than numbers and formulae. These students also believe that they understand statistics if they are able to state and insert numbers into formulae which is erroneous because statistics is not about plugging in numbers into formulae, but a process for gaining information (Chance, 1997 in Rumsey, 2002) and doing statistics is not equivalent to understanding statistics (Gal, 2000 in Rumsey, 2002). For example, student's ability to calculate standard deviation does not demonstrate a student's ability to understand what the standard deviation is and what it measures or how it is used. Furthermore, students also feel that the usefulness of statistics education is limited to getting correct answers in tests and examinations. Typical of Asian students, these students are also quite passive in class.
This article will focus on the initiatives taken by the author in trying to eradicate some of the misconceptions students have related to descriptive statistics. Examples will be drawn from the teaching and learning of the topic on associations and correlations because this topic often generates the most interesting misconceptions among students. Teachers also often overestimate students' ability to understand the various concepts under this topic. While teaching this topic to her education students the author frequently observes the following mistakes being made such as mistakes in the,
(i) interpretations of correlation coefficients such as
a. Treating negative correlations as if there are no correlations b. Ignoring the negative sign in negative correlations
c. interpreting a high correlation as being statistically significant and a low correlation as not significant
(ii) computation of coefficient correlations
a. Computing correlation coefficients for two sets of data that come from two independent sources.
(iii) treatment of correlated variables such as
a. treating one variable as the cause and the other as the effect
The misconceptions are not limited to the above but those are the most common ones. Studies on misconceptions among western students indicated that there are three main types of misconceptions specific to correlation coefficient namely determinist conception, unidirectional conception and causal conception (Batanero, Estapa, Gordino & Green, 1996 in Estepa & Sanches Cobo, 2001). Determinist conception refers to students' belief that correlated variables should be linked by a mathematical function, unidirectional conception refers to the belief that an association only exists if the sign of the coefficient is positive and perceive a negative correlation as a sign of independence. In the causal conception, a person believe that that there is a cause and effect relationship between the variables. Morris (1997a) Morris (1997b) found that some students believe that a negative correlation coefficient means a weaker correlation compared to a positive correlation. These misconceptions are similar to what have been found in UTHM.
Current computer technology due to its multimedia capabilities has the potential be a useful tool in the teaching and learning of statistics. Morris (1997) design a computer assisted learning courseware (LINK) to address this particular issue. He found that technology in the form of students' self-paced learning courseware is helpful. In this article, the author would like to share some of the efforts made to eradicate these misconceptions using readily available technology and applications namely, the computer, EXCEL spreadsheet, power-point presentation slides and concept mapping tool. The technology supported initiatives are active power-point presentation slides, interactive excel spreadsheets and technology supported concept mapping.
INITIATIVE 1: ACTIVE POWER-POINT PRESENTATION SLIDES
Instead of giving notes to students on the meaning of correlation coefficients, short problems were posed to students to think about and to give their responses to. Figure 1 illustrates one such problem. In this slide, students were given one correlation coefficient problem and asked to interpret and to explain the reason for their answers. As the task appeared to be relatively simple students were eager to participate in the activity. Many volunteered to give their interpretations and the reasons for these interpretations and active discussion were thus generated among students. As expected, some students gave the correct answers with wrong reasons and some got them totally wrong.
Problem 1
• Student A reports that lie obtains a correlation
o f + 0 . 8 between parents' income and students
CGPA in his study.
• What does this mean?
[image:4.594.162.428.205.429.2]• What are the variables being studied?
Figure 1 Problem on meaning of positive coefficient
The author withheld the correct answer at this junction and more problems were to follow (Figure 2 and Figure 3). Students continued to eagerly give their interpretations and justifications and all the while no correct answers were given.
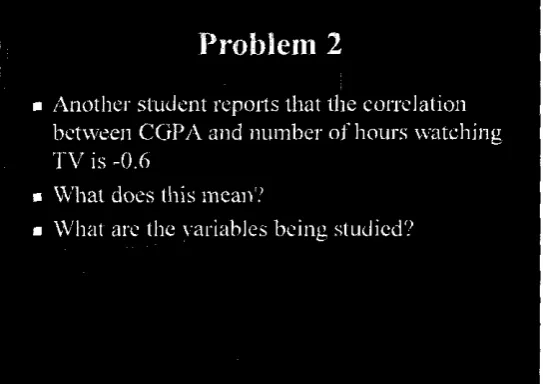
Problem 2
• Another student reports that the correlation
between CGPA and number of hours watching
T V is -0.6
• What does this mean?
[image:4.594.157.429.490.682.2]• What are the variables being studied?
After a few of such activities, the author brings the students back to first problem and started to discuss the correct answer. Those who got the right answers were naturally happy but those who got them wrong appear to be very surprised that they were wrong and insisted for explanations. At long last, the passive students have become active. And by doing these activities, the students are forced to confront their long-held misconceptions and to make the appropriate alignments with their current knowledge schemes.
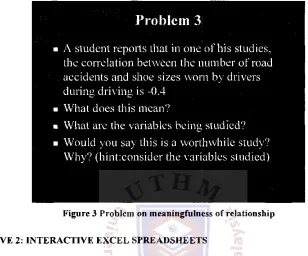
Problem 3
• A student reports that in one of his studies,
the correlation between the number of road
accidents and shoe sizes worn by drivers
during driving is -0.4
• What does this mean?
• What are the variables being studied?
[image:5.594.124.432.165.421.2]• Would you say this is a worthwhile study?
Why? (hint:consider the variables studied)
Figure 3 Problem on meaningfulness of relationship
INITIATIVE 2: INTERACTIVE EXCEL SPREADSHEETS
One of the assumptions for using either the Pearson method or the Spearman rank method for estimating linear associations between variables is the linearity of relationship. However, many students did not understand what linearly related means. A scatter diagram is a good way to visually describe such a relationship. Many students also fail to understand the meaning of low correlations, positive correlations and negative correlations. For learning to occur, students must be presented the materials that are meaningful to them, usually starting from the concrete concept and progressing to the more abstract materials/concept. Correlation coefficient is something that is abstract because it is a "number with a meaning". The relationship between data and their representations must be clearly illustrated to help students understand the meaning of correlation coefficient.
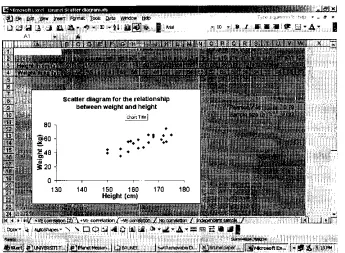
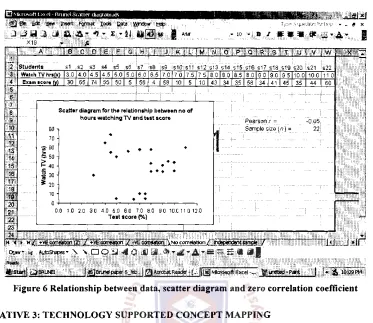
For the spreadsheet activity, students were asked to gather data on their friends' height and weight and to key in these data into a spreadsheet into two rows. Next students were guided to construct the scatter diagram based on these data. Finally they computed the correlations coefficient for the data. They were then asked to change the data according to instructions to see changes that occur in the scatter diagram and the correlation coefficients. By doing these exercise students could see the relationship between source of data, data, graphical representation of the data and the coefficient associated with the data. The multiple representations help to reinforce the meaning of the correlations coefficients. Figure 4, 5 and 6 show such spreadsheets.
Ej Mirrosoti i xccl isrunfi -ittor divKjr.ini xls
• • I E
- 10 • • / i I 9 ^ L: - A '
Ele 6Ut Mew Insert Format Iools Qata UfCKlow Mo j j ^ i j a A - •*> - * a ® 1
A 1 - f .
B I C ! r, H M .. | .. • I | . | H | L "^TnT 0 I . P ± G . I b i I : U I V I vT ^
correiatlon^-VE correiadcri J^ No owrdaton / .1 -Raw- * AgtoShapes- X \ D O J 4 0 l i i i
Raady Sum=34834.789274
SlUMVERSmT.
L-!...._. i >;r~
[image:6.595.123.468.95.348.2]MKn«.n PJI... A
sFigure 4 Relationship between data, scatter diagram and positive correlations coefficient
Mil rosofl i xc H I'mjiici ift'T > li.iqr.nri.xls
a>30e Edt tfew insert Farmat Iools cats ffirdow tie£
J J W i J H J l ' I ' l l U [3]« 1
S
m'- J a l J d . . * * * - - A - K
A | B i ~ i n | F- j I- | G 1 H | I I jTk |L ; M i N i O ; P | G | R | S | T j U j V W|" X T
N < • ~|jJ I Hf*
Dta«- k AutoShapss- \ > O O i J 4 0 A i a i 3» • - A * = -S g * t § |
[image:6.595.117.472.106.590.2]Ready Sum*1364,701097 <fcsuri| Jlaihli!inetE...'-|u>BRUKB | ^RemoyjfcleDi-. | ajBruialpapg... [||ji| Microsoft Ex... $ mated - Pare | jjjjfIStST"
E f Microsoft Excel - Brunei Scatter diacjram.xls
B e Edt Sew Insert Format look Cats fflndow Help
j j y j d a a - ^ - 1 ' i i ( a ® # |
A
b i mmm m
» _ ff x
•A- I
B |C I O I e I F I 6 H • I J ! K I L i M ( N 1 O I P j Q I R I S I T I U I V j W
S t u d e n t s s1 s2 S3 s4 s5 s6 :s7 is9 i s 1 0 i s 1 1 I s 1 2 i s 1 3 s14 s15 516 s17 s18 s 1 9 s 2 0 s 2 1 s22 Watch TVhr«(») 3 , 0 4 . 0 4 . 5 4 . 5 5 . 0 5 . 0 6 . 0 6 . 5 7 . 0 7.0 7.5 7 . 5 8.0 8 0 8 5 _ 8 0 _9 0__9_0__9_5_ jm_0 I t H ^ 11 I
E m m i c o r e (y) 30 65 74 55 50 5 56 4 58 10 5 10 4 3 34 35 58 34 4 1 4 S | 3 S l 4 4 60
Scatter d i a g r a m for the relationship b e t w e e n n o o f h o u r s w a t c h i n g T V a n d t e s t s c o r e
70
r 60
[image:7.596.107.480.90.413.2]i 50 : 40 | 30
-: 20 -10 •
0
-0 -0 1.-0 2.-0 3 -0 4.-0 5 -0 6.-0 7 -0 8.-0 9 -0 1-0.-0 11 -0 12,-0
T e s t s c o r e ( % )
P e a r s o n r = S a m p l e size (n) =
- 0 . 0 5 :
22:
M 4 t m? +VE correlalloiVg) /'*VEOT€lailon"~y^-VEi^elalionANo correlation/"'inciei^ : Draw* * AytoShapes* \ V • O SI-4 0 iffl M ^ » al " A » = - 5 • S §
.jtfeStdft, jJBRUe [^Bruidp^lUifoJffiAcr^ |f unWed - Pant
j • i r
[« jj) 10:09PM
Figure 6 Relationship between data, scatter diagram and zero correlation coefficient
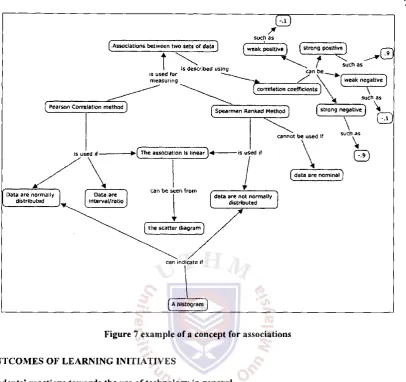
INITIATIVE 3: TECHNOLOGY SUPPORTED CONCEPT MAPPING
Concept maps have been found to be useful in a variety of applications, in the teaching of the different sciences and also for mathematics. A concept map drawn by a learner can be used as a diagnostic tool as well as a discussion tool for creating a better understanding (Brinkmann, n.d). However, creating a concept map is not an easy task; it is an art as well as a science, involving an iterative process that leads to a map that is often unique to one particular person. The number of iterations required is dependent not only on a person's expertise in the subject but also on their concept mapping skills.
For a novice learner, with limited subject matter knowledge as well as limited concept mapping skills, constructing a map manually may be a very discouraging experience. In this case, the use of technology can motivate students to persist in producing a good concept map that reflects their understanding and knowledge of the subject matter in question. Thus the map will be a better indicator of their current subject understanding and therefore can be used as a diagnostic tool as well as a discussion tool among students and lecturers.
such as
t z t
is used for measuring
is described using
t
/ such as
[correlation coefficients ]
weak negative
"A
such as
[Pearson Correlation method j
cannot be used If
Is used If 4 is used If
Data are normally
distributed data are not normally distributed
Spearman Ranked Method] ( strong negative] \
Q
uch as
\ C D
[ d a t a a r e nominal]
[image:8.595.93.500.87.469.2][a histogram]
Figure 7 example of a concept for associations
OUTCOMES OF LEARNING INITIATIVES
Students' reactions towards the use of technology in general
Data on students' reaction towards the initiatives was gathered using an eight-item questionnaire. Students («=38) were asked to give their level of agreements to given statements on a rating of 1 to 4. A rating of 1 indicates that the student strongly disagrees with the statement and a rating of 4 indicates that he or she strongly agrees with it.
The mean score obtained on the questionnaire was 3.26, with a standard deviation, s = 0.29. A one sample
t-test was used to t-test whether this mean is statistically different from that of a chosen criterion. The chosen criterion in this case was 2.5 which is the mid-point between 1 and 4. The results showed that there is a statistically significant difference between the mean score on the questionnaire and that of the criterion,
p=.00 and t =16.14, df= 37 with the mean score higher than the criterion.
Students' positive reactions to the intervention were further supported by their responses in their weekly journal. One such journal indicated a student positive reaction towards the concept mapping activities;
Indication of learning transfer
Magnitude of learning transfer was inferred from students' statistics performance in their final semester examination. The final semester examination paper consisted of 25 closed ended (multiple choice) items and five open ended questions. The emphasis of these items is on understanding and therefore, students not only have to provide their answers but they also have to explain why they choose to use certain methods and not others. Previous examination results from 2002 to 2006 on the descriptive items from 16% to 65%. On the other hand, the mean score for the descriptive statistics items in this particular semester whereby the intervention was used was 80%. The overall performance on statistics was also much better with scores ranging from 41 to 89 in contrast to previous semester performance ranging from 20 to 85.
Lesson learnt by the author
Seeing students becoming more engaged is highly rewarding indeed but all the activities are not without its challenges. For the first initiative, the use of power point presentation slides does help in the authoring of the materials. However, a lot of careful and creative thoughts are needed to design suitable materials for the power point presentation slides to illicit the desired responses. Some of the questions that guide the design include "what type of questions should be askecf?" and "what kind of problems should be posed that will promote the desired thinking process" and "what are the desired thinking process?" In other words, the active power point slides require more thoughts and efforts from the teacher to make them more effective because as Rossman and Chance (2004) say, students' misconceptions need to be anticipated before they can be addressed.
The interactive EXCEL spreadsheet requires the least amount of outside class preparations for the teacher. However, it does require a lot of class-time because data gathering and entry were carried out in class. The teacher needs to be patient and not try to use a short cut by providing data in a disc for example. The author observed that the sequential act of data gathering, data entry and data analysis did appear to help foster the link between reality (data) and their representations- resulting in understanding.
The concept mapping exercise on the other hand does not require many efforts form the teacher but appears to be most challenging to students. They kept asking whether their concept map is correct. Students are not used to an open ended problem with no one correct answer and finished concept maps by different students are rarely identical. Therefore, that creates high anxiety among some students. But this anxiety itself appear to have a positive effect whereby students seem to be more motivated to come up with "the correct answer" by working collaboratively with their friends. Thus, in constructing the concept maps, students appear to benefit in many ways. First they were forced to think about the concept that they are constructing and in the process, their lack of understandings of a concept are revealed providing opportunity for self evaluation. The final concept map is also useful for students-teacher discussions as well as for a class-discussion which leads to a better understanding of concepts for all. Concept mapping not only provide an opportunity for discussion, it also provides an opportunity for evaluation. What a teacher needs to do is to be open minded enough to see many possibilities in students' work.
CONCLUSION
REFERENCE
Batanero, C. (n.d) Statistics Education as a Field for Research and Practice, University of Granada, Spain, ICME 10, Regular Lecture
Brinkmann, A. (n.d) Knowledge Maps-Tools for Building Structure in Mathematics Callaert, H. (2002). Understanding statistical misconceptions. ICOT6 2002.
Chance, B.L (1997) Experiences with Authentic Assessment Techniques in an Introductory Statistics Course Journal of Statistics education. Online www.armstat.org/publications/ise/v5n3/chance.html
Estapa, A. & Sanches Cobo, F.T (2001). Empirical Research on the Understanding of Association and
Implications for Training of Researchers in Batanero, C. (ed) Training Researchers in the Use of
Statistics, 37-51. International Association for Statistical Education and International Statistical Institute. Granada, Spain
Keeler, C. & Steinhorst, K. (2001). A New Approach to Learning Probability in the First Statistics Course.
Journal of Statistics Education. 9(3). Retrieved 20 April 2007 from http://www.amstat.org/ publications/ise/v9n3/keeler.html
IHMC (n.d). IHMC CMap tools. Retrieved April 10 form http://cmap.ihmc.us/
Krauss & Wasner (2002) Learning Program for Correlation, pp 1035-1041. Retrived April 23 2007 from
http://www.stat.auckland.ac.nz/~iase/publications/2/Topic7zh.pdf
Morris, E. J. (1997a) An investigation of students' conceptions and procedural skills in the statistical topic
correlation. CITE Report No. 230. Centre for Information Technology in Education. Institute of
Educational Technology. The Open University.
Morris, E. I. (1997b). A Formative Evaluation of the Program, Link. CITE Report No. 238. Centre for
Information Technology in Education. Institute of Educational Technology. The Open University. Rumsey, D. J. (2002). Statistical Literacy as a goal for introductory statistics course. Journal of Statistics
Education, 10(2). Retrieved April 20 2007 from http://www.amstat.org/ publications/ ise/v!0n3/ rumsey2.html
Rossman, A. J & Chance, B. L (2004) Anticipating and Addressing Student Misconceptions. Paper presented at the ARTIST Roundatable Conference on Assessment in Statistics . Lawrence University, August 1-4, 2004.