Energy Consumption and Energy Saving
Measures in Poultry
Catherine Baxevanou
1,*, Dimitrios Fidaros
1, Thomas Bartzanas
1, Constantinos Kittas
21Center for Research and Technology – Hellas, Institute for Research and Technology, Greece
2Department of Agriculture Crop Production and Rural Environment, School of Agricultural Sciences, University of Thessaly, Greece
Copyright©2017 by authors, all rights reserved. Authors agree that this article remains permanently open access under the terms of the Creative Commons Attribution License 4.0 International License
Abstract
Livestock buildings are energy consumers and aggravate the environment directly through their emissions and indirectly through the natural sources consumption. The contribution of energy consumption in the total production cost increases as the mechanization level and the conventional energy cost arises. In the present work the total energy consumption in poultries and its distribution according to the type of energy and the type of application is approached in two ways: a) The operational rating through the process of energy audit and, b) The asset rating where the thermal needs of the chambers are calculated using a source analytical explicit model in hourly time step. In terms of final energy consumption the energy per unit area ranges between 30 and 130 kWh/m2 and in terms of primary energy between 70 and 180 kWh/m2, depended on the chamber insulation, location and automation level. The insulation can contribute mostly in mountainous area and the automation level in lowland units. An insulation thickness of 4 to 5cm is recommended for lowland farms and 6cm for mountainous farms. Further insulation cannot offer benefit since ventilation heat losses represent significant percentage of the total heat losses and can be reduced with automatic ventilation control.Keywords
Energy Consumption, Poultry, Energy Saving, Insulation, Energy Audit1. Introduction
Livestock buildings in general and poultry facilities specifically are energy consumers [1]. Although the energy consumption represents a small percentage of the production cost, the latter increases with the increasing level of automation and mechanization. For that reason and because of the rise of energy prices and the need for sustainable development (energy consumption leads to natural sources consumption) the reduction of energy consumption and CO2
emission from livestock facilities is priority for EU.
In poultry facilities energy is consumed for internal climate adjustment (heating, cooling, ventilation, lighting and humidity control) and for the operation of production equipment (feeding, sanitation, and eggs’ production). In broiler houses the energy consumption in production equipment is restricted to food and water supply devices. The interest in energy consumption in poultry began in the mid-70s due to energy crises. During this period the concepts of primary energy and life cycle analysis were introduced in the relevant literature in early form [2]. The work of this period is summarized in a review paper [3] where tables with energy consumption along with general directions for energy saving measurements in broiler houses are presented. The energy consumption results are based on energy audits in 2 broiler farms of 10,000 birds in Saskatchewan of Canada by M. R. L. Bantle at 1987. According to those energy audits the annual LPG consumption for a well-insulated broiler house was 188,000 kWh which became 214,000 kWh for a poorer insulated chamber. The electrical annual energy consumption was 24,000 kWh and 20,000 kWh respectively. This study has already identified the problem of high ventilation rates of up to 6 times larger than recommended. Finally another basic problem is addressed which is the definition of the examined system boundaries [3].
consumption is expected to vary between 12-16 MJ/bird or 60-80 kWh/m2/year depending on the location of the poultry farm and on the level of the used technology.
In [8] a methodology for energy audits in poultry facilities is presented. In the present work this methodology is used in 8 poultry farms (26 chambers) and further developed in order to calculate energy indices in terms of final and primary energy consumption. For the calculation of energy indices an operational rating approach is used. Then an analytical model is developed in order to estimate the distribution of energy consumed in the different application in an asset rating approach. According to the conclusions from the two approaches, the heating is a major energy consumer, even in the case of lowland farms, followed by the cooling and ventilation where electrical energy is consumed.
As a method for reduction of energy consumption is proposed the wall insulation and the use of automation for ventilation, heating and cooling control.
2. Materials and Methods
Estimations about the consumption and distribution of energy according to the application can be derived by two methods, which are combined in the process of an energy audit. The first approach, which is the first stage of the energy audit, is an operational rating approach, which means that the energy consumption is calculated directly using the data of the energy bills and of the production data. This approach cannot give information about the distribution of the energy consumption among different chambers in the same farm, or among different applications, neither can guide to the allocation of the most energy consuming activities. For that reason the calculations are repeated through an asset rating approach where an analytical model, developed specially for broiler poultry facilities, is used. In this analytical tool it is assumed that desired internal microclimate is always achieved and the ventilation rate is only the required. Since neither of those assumptions is true in practice the results between the two approaches is expected to vary, especially in the old chamber constructions. For that reasons the asset rating results are appropriately calibrated in order to be used for the calculation of energy consumption distribution.
2.1. Operational Rating
In [8] the steps of energy audit in poultries are described. The first three phases (site visit, data collection, measuring and recording) and part of the fourth (data elaboration), constitute the operational rating approach. The basics of the first three phases are presented in briefly.
a) Site visit. During this visit, auditor:
i) records the installed equipment which consumes energy (the kind of the equipment, the power, the number of identical devices, the efficiency
performance coefficients, the position where is sited inside the farm and finally the operational characteristics),
ii) interviews the farm manager (information about the breeding regime and details about the operation techniques, information about the date in which the unit was built, what renovations have been done since then and what interventions are planned), iii) records the construction characteristics (geometrical
characteristics, size and position of openings, construction materials and insulation etc.) and iv) records the basic characteristics of the surrounding
area (obstacles on the horizon that may cause shading, local wind regime, availability of water and electricity networks, etc.)
b) Collection of data includes: i) plans of the chambers and of the surrounding area, ii) specifications sheets and/or manuals of installed equipment, iii) existing measurements of energy consumption, iv) energy consumption in terms of electrical consumption bills and fossil fuels invoices (the acquisition of energy bills is necessary element of the energy audit), v) production data (capacity of each chamber, annual production in terms of birds’ number and average bird weight) and vi) local climatic regime (yearly variation of temperature, humidity and wind velocity and direction)
c) Measurements and recording: Instantaneous measurements of internal microclimate characteristics (temperature, relative humidity, light levels and CO2 concentration) that give indication about the ability of Electro-Mechanical (EM) equipment to achieve the desired microclimate, differential pressure across fans and evaporative pads, gas fuel analysis, local wind velocities etc that give information about the EM equipment efficiency, differential temperature and thermography that give information about the existence of insulation and finally longtime monitoring of electrical energy and fossil fuels consumption.
The energy consumption is taken through the energy bills (electrical consumption bills and fossil fuels invoices). For the calculation of energy indices, in step d of the energy audit procedure, are necessary the production data (number of birds per year and average weight of produced birds), as well as chambers geometry data (area available for the birds in each chamber).
2.2. Asset Rating
the model will be used for the calculation the operational period of each device that has been recorded during the step (a) of the energy audit and for the examination of energy saving scenarios.
The feeding equipment operates automatically securing food and water at demand. It is assumed that it operates for 6 hours per day [9]. The calculation of energy consumed for lighting takes into account the installed power and the daily operational schedule according to the standard timetable used by the farmer: During the first three days 1 hour darkness, in the 4th day 2 hours darkness, then gradual increase of dark cycle by 1 hour per day until the 6 hours and maintenance of this program until the 30th day. Finally the darkness period is reduced by 1 hour per day until the 0 hours in the day of slaughter.
During winter, ventilation is used not only to supply the necessary fresh air but also to remove the locally produced CO2 and the locally produced humidity in order to keep the air clean and the relative humidity in desirable levels. Respectively during the summer ventilation is used for cooling too.
max , 2,
V•dem= V•fr rV•CO V•season
(1)
Where Vdem is the requested ventilation in [m3/(h.bird)], Vfr is the required fresh air (the air flow that will provide the necessary oxygen amount for the bird needs), VrCO2 is the air flow that will secure the removal of the CO2 produced by the birds’ metabolism and finally Vseason is the air flow that secure the humidity removal during the winter and the cooling during the summer. The air flow that provides the necessary oxygen and the CO2 removal is taken by tables according to the age and the weight of birds [10]. The heat and humidity produced by birds are also taken by tables according to the age [11].
For the calculation of heat and cooling needs firstly, the average heat transfer coefficient, Um, of the poultry chamber is calculated according to the building materials and building geometry [12, 13]. Then an energy balance is drawn up taking into account the losses through the building shell (due to convection and conduction), the ventilation losses (the fresh air needs to be conditioned) and the heat gains from the birds’ metabolism. This way the heating and cooling losses are defined using an explicit method in hourly base adopting the following assumptions[ 14, 15]: a) Ignore the dynamic phenomena related to heat storage (due to small area/volume ratio and the low specific heat capacity of the construction materials), b) the heat gain coefficient is taken unity, c) the direct and indirect solar gains are not taken into account (direct solar gains do not exist because during the operation period the openings are closed and so all the structural elements are opaque, the existence of insulation eliminates the indirect solar gains) and d) are not taken into account the heat gains from the
equipment operation. For the calculation of cooling and heating needs were taken into account:
a) the timing of each breeding (each year there are 5 breeding periods of 42 day each, spread in all over the year),
b) the table of the desirable internal temperature and humidity for each breeding day according to the age of birds,
c) the local external climatic conditions [16]
The asset rating approach, along with the information taken by the operational rating approach, is used both for the conduction of the phases d to g of the energy audit procedure [8] (data elaboration, calculation of energy indices, allocation of energy consuming processes and proposals of the energy performance). Those phases are briefly presented here.
a) Elaboration of collected data:
i) allocation the installed power according to the consumption type (heating, cooling, feeding, lighting etc),
ii) determination of operating hours of each device, and iii) calculation of the distribution of energy
consumption per chamber and consumption type b) Calculation of Energy Indices per production unit, per
area square meter
c) Comparison and allocation of the
i) High energy demanding equipment and processes and
ii) Inefficient energy equipment and processes d) Proposals for improvement of energy consumption
3. Energy Consumption
3.1. Energy Audits Characteristics
Energy audits were conducted in 8 broiler farms (26 chambers) located in lowland and in mountainous area in Central Greece. Specifically 3 farms (11 chambers) where located in Arta, a low land area at sea level with an average latitude of 39o 06’, where the heating degree days are 1313 (HDD with base temperature 18.3oC) and the cooling degree hours are 3399 (CDH with base temperature of 26oC). The other 5 farms (15 chambers) where located in the area of Ioannina, a mountainous area with average elevation more than 500 m and latitude 39o 33’, with HDD=2037 and CDH=1694. In the Tables 1a and 1b the characteristics of those farms are given.
Table 1a. Farms’ characteristics
Characterization Position chambers [-] Number of Chambers area [m2]
Big farm Lowland 7 7723
Small farm Lowland 3 3740
New technology Lowland 1 1404
Big farm Mountainous 7 6345
Old and new
technology Mountainous 3 1641
Old technology Mountainous 2 1933
Small farm Mountainous 1 1253
New technology Mountainous 1 1264
Table 1b. Farms’ capacity and productivity
Characterization Capacity [no of birds] production Annual [birds/year]
Annual production
[kg/year]
Big farm 115170 532733 1472816
Small farm 61000 324100 776544
New technology 25000 119218 273009
Big farm 88000 347666 828140
Old and new
technology 24000 128253 326071
Old technology 30000 157331 384486
Small farm 20000 102994 251277
New technology 20000 101509 249619
The new technology farm chambers are characterized by appropriate insulation in roof and in the walls with average Um=0.58 W/(m2K) for lowland farms and Um=0.55 W/(m2K) for mountainous farms and automatic ventilation and cooling systems.
[image:4.595.56.552.79.430.2]The old technology chambers considered as chambers with poorly insulated walls corresponding to average Um=1.03 W/(m2K) for lowland farms and Um=1.0 W/(m2K) for mountainous farms and manual operated ventilation and cooling systems. In the Figures 1-4 the installed power is given for the lowland and mountainous farms.
Figure 1. Distribution of total installed power in lowland farms
Figure 2. Distribution of total installed power in mountainous farm
[image:4.595.306.552.438.597.2]Figure 3. Distribution of electrical power in lowland farm
Figure 4. Distribution of electrical power in mountainous farm
3.2. Energy Indices
[image:4.595.57.299.554.711.2]In general the average yearly energy consumption of the examined farms lies in the limits suggested by international literature for broiler houses e.g. between 60 to 80 kWh/m2, with the lowland farms achieving better than the expected score and the mountainous farms to be a little bit worse than that. This variation is limited in the calculation of primary energy index due to the mixture of energy consumption. Indeed the thermal and electrical energy consumed in the
lowland farms are comparable although in the mountainous farms the thermal energy is fourfold of the electrical energy. The mountainous farms consume energy for heating and the lowland farms for cooling.
In the Table 3 the same energy indices are given in chamber level, grouping chambers with respect their technology level.
Table 2. Energy indices in farm level
Farm Location Energy Index weight [kWh/kg] Final Energy per Final Energy per area [kWh/m2] Primary Energy per weight [kWh/kg] Primary Energy per area [kWh/m2]
Lowland Farms
Thermal Energy 0.14 27.23
Electrical Energy 0.12 24.23
Total Energy 0.26 51.46 0.50 98.85
Mountainous Farms
Thermal Energy 0.41 75.92
Electrical Energy 0.09 16.73
Total Energy 0.50 92.65 0.69 128.22
All farms
Thermal Energy 0.31 57.66
Electrical Energy 0.1 19.54
Total Energy 0.41 77.2 0.62 117.2
Table 3. Energy indices in chamber level Chamber
location/
technology level Energy Index
Final Energy per
weight [kWh/kg] Final Energy per area [kWh/m2] Primary Energy per weight [kWh/kg] Primary Energy per area [kWh/m2]
Lowland – new technology
Thermal Energy 0.13 23.35
Electrical Energy 0.12 23.03
Total Energy 0.25 46.38 0.5 91.31
Lowland – old technology
Thermal Energy 0.21 37.93
Electrical Energy 0.16 29.61
Total Energy 0.37 67.54 0.69 125.69
Mountainous – new technology
Thermal Energy 0.31 67.7
Electrical Energy 0.07 14.91
Total Energy 0.38 82.61 0.57 114.32
Mountainous – old technology
Thermal Energy 0.41 76.81
Electrical Energy 0.07 12.56
From the indices it comes out that the insulation can play important role mainly in the mountainous farms and the automation level affects mainly the lowland farms. Nevertheless all energy indices are better for the new technology farms except from the electrical energy consumption per area in the mountainous farms, but this can be attributed to the fact that mountainous old technology chambers actually fail in achieving appropriate internal microclimate.
It should be noted that the above values are mean values of the examined farms and chambers. In individual cases, it was found that the minimum final energy consumption is 30 kWh/m2 and the maximum is 90 kWh/m2 while in terms of primary energy consumption 70 to 130 kWh/m2.
[image:6.595.58.299.285.447.2]3.3. Energy Consumption Distribution
Figure 5. Distribution of electrical energy in lowland farms
Figure 6. Distribution of electrical energy in mountainous farms
The thermal energy is consumed mainly for heating, while the electrical energy is consumed for many others applications (feeding, cooling, ventilation, heating and lighting). In the Figures 5 and 6 the sharing of energy consumption among these applications is given for lowland and mountainous farms.
4. Energy Saving Measures
For the estimation of the insulation effect at chambers’ heating demand, the explicit analytical model developed for the energy audit second phase was used. Two typical chamber’s sizes were examined in lowland and mountainous area. According to the energy audits a typical small chamber have area 600 m2 (13x46.15) with side height 3.25 m and roof inclination 10o, while a big chamber have 1200 m2 area (15x80) with the same height and roof. In all the considered cases the load was 15 birds/m2. The typical chamber was consisted of a reinforced concrete floor with 15 cm width, water proofing layer covered by cement coating and straw litter. For the roof, two technologies were examined polyurethane roof slabs and panels of extruded polystyrene. For the walls also two options were examined, concrete blocks insulated with polystyrene slabs and polyurethane panels. The combination of polyurethane panel for roof and walls characterizes the new-constructed chambers while the combination of insulated concrete walls with polystyrene and the roof coated by extruded polystyrene correspond to old renovated chambers.
For the small chamber it is considered that 40 m2 of the perimetrical wall was covered by evaporative pads while for the big chamber the evaporative pads cover 50 m2. Another 5% of the perimetrical wall is covered by windows which remain closed during the chickens’ breeding. During the 10 first days of each breeding it is considered that all the birds are gathered in the half chamber which is divided from the rest room with a plastic curtain.
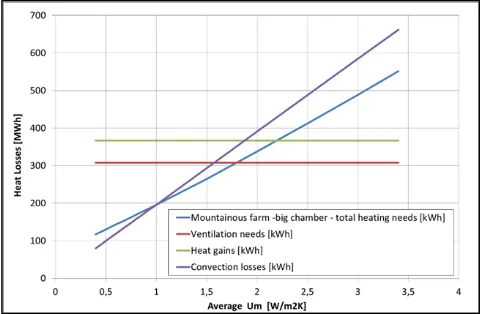
[image:6.595.56.299.475.636.2]The heating demand is constituted by the heating losses by transfer through the chamber shell (convection and conduction) and the heating losses due to ventilation needs. Those losses are reduced due to internal heating gains via birds’ metabolism. In the Figures 7-10 the heating losses and its analysis is given for small and big chambers in lowland and mountainous areas.
Figure 7. Heat demand for small chamber in lowland farm
Figure 8. Heat demand for big chamber in lowland farm
Figure9. Heat demand for small chamber in mountainous farm
[image:7.595.311.551.80.237.2]Figure10. Heat demand for big chamber in mountainous farm From the above figures it comes out that in a lowland area for an elementary insulated chamber most of the heat losses are due to ventilation. While in a mountainous area the ventilation losses are comparable with the convection losses especially for small chambers. In order to find the critical insulation thickness for small and big chambers in the Figures 11 and 12 is given the total heat demand versus the insulation thickens for the case of new constructions.
Figure 11. Total heat demand vs insulation thickness for big chamber
[image:7.595.58.298.174.333.2] [image:7.595.195.538.364.521.2] [image:7.595.57.551.544.710.2]From the above it comes out that for lowland chambers, an insulation thickness of 4 to 5 cm is appropriate for small and big chambers since thicker insulation cannot offer further significant benefits. It is worth to be marked that the chamber ventilation is proven ‘energetically expensive’ for both heating and electrical energy consumption. For mountainous chamber it is proposed a little bit thicker insulation of 6 cm in order to achieve proper insulation levels.
5. Conclusions
The energy consumption in Greek broiler houses in average terms is comparable and close to the values suggested by the international literature, although it varies according to the installation position of the unit and the technology used. The average final energy consumption varies from 46.38kWh/m2, in lowland farms with new technology, to 89.37kWh/m2 for old technology mountainous farms. Nevertheless the maximum and the minimum energy indices of individual chambers can vary from 30 to 130kWh/m2. In terms of energy per produced mass meat it varies from 0.25 to 0.48kWh/kg.
Significant differences are observed between mountainous and lowland farms due to different mixture of energy they use. In the lowland farms the half of the consumed energy is electrical while in the mountainous farms this percentage is reduced to 20%. Since electrical energy is an ‘expensive energy’ the energy indices in terms of primary energy show that the average energy consumption varies from 91 to 126kWh/m2 while extreme values like 70 or 180kWh/m2 are observed in particular cases. In terms of energy per produced carcass the most expensive case is the lowland farms with old technology with primary energy consumption of 0.69kWh/kg which is reduced to 0.5kWh/kg for new technology chambers. The respective values for mountainous farms are 0.62 and 0.57kWh/kg.
The high electricity demand of the lowland farms is due to increased cooling needs and the difference observed between the old and new technology farms is due to automation level of the used equipment. Insulation can offer important energy savings especially in mountainous farms. It is recommended insulation thickness of 4 to 5 cm for lowland farms and 6 cm for mountainous farms. Further insulation cannot offer significant benefits since a significant percentage of heat losses are due to ventilation needs, especially to lowland farms. The second recommendation is the careful control of ventilation system since it is responsible not only for the excessive electrical energy consumption but for thermal energy consumption too.
Acknowledgements
The work has been carried out under Greek National Research Program: SYNERGASIA 2011, the NSRF 2007-2013, Project: "Assessment of techniques and
technologies for reducing the environmental footprint of poultry facilities”
REFERENCES
[1] European Forum, Livestock housing for the future, France, 2009.
[2] P. Southwell, T.M. Rothwell. Analysis of output/input energy ratios of food production in Ontario, School of Engineering, University of Guelph, Guelph, Ont., 1977.
[3] E.M. Barber, H.L. Classen, P.A. Thacker. Energy use in the production and housing of poultry and swine – an overview, Canadian Journal of Animal Science, Vol. 69, 7-21.
[4] G.T. Tabler. Applied broiler research farm report: Production results before and after renovation, .Avian Advice, Vol. 9, No.4, 4-5.
[5] M. Rajaniemi, J. Ahokas. A case study of energy consumption measurement system in broiler production, Agronomy Research Biosystems Engineering Special Issue 1, 195 – 204. [6] I. Kilic. Analysis of the energy efficiency of poultry houses in
Bursa region of Turkey, Journal of Applied Energy Research, Vol. 44, No. 1, 165-172.
[7] M. De Vries, I.J.M. De Boer. Comparing environmental impacts for livestock products: A review of life cycle assessments, Livestock Science, Vol. 128, 1-11.
[8] C. Baxevanou, D. Fidaros, Th. Bartzanas , C. Kittas. Energy consumption in poultries – energy audits in Greece, International Conference of Agricultural Engineering, AgEng 2014, C0623, 1-8, 2014.
[9] M. Ibarra. Farm energy audit report to: John Sample, Sample poultry farm, EnSave, Report, 2009.
[10]M. Czarick, B. Fairchild. Poultry Housing Tips: Oxygene, The University of Georgia, College of Agricultural and Environmental Science/Athens, Georgia 30602-4356, Online available from http://www.poultryventilation.com
[11]H.G. Barott, J.C. Fritz, E.M. Pringle, H.W. Titus. Heat production and gaseous metabolism of young male chickens, The Journal of Nutrition, Vol. 15, No. 2, 145-167.
[12]EN ISO 6946 E2: 2009, Building components and building elements – Thermal resistance and thermal transmittance – Calculation method, 2009.
[13]EN ISO 10077:2012, Thermal performance of windows, doors and shutters -- Calculation of thermal transmittance -- Part 2: Numerical method for frames, 2012.
[14]EN ISO 13370 E2, Thermal performance of buildings -- Heat transfer via the ground -- Calculation methods, 1998. [15]EN ISO 13790:2008, Energy performance of buildings --
Calculation of energy use for space heating and cooling, 2008. [16]Technical Guidance of Technical Camber of Greece TOTEE