Causes of the Convergence Slowdown in the Countries of
Central and Eastern Europe, 2008-2014
Wojciech Bieńkowski
1, Wojciech Grabowski
2,*1Department of Economics and Management, Lazarski University, Poland 2Department of Economics and Sociology, University of Lodz, Poland
Copyright©2017 by authors, all rights reserved. Authors agree that this article remains permanently open access under the terms of the Creative Commons Attribution License 4.0 International License
Abstract
In this paper we analyze the growth and realconvergence process of the Central and Eastern European countries which joined the European Union in May 2004, namely Poland, the Czech Republic, Slovakia, Hungary, Lithuania, Latvia, Estonia and Slovenia (henceforth CEEC-8), vis-à-vis the European Union (EU) as a whole, individual EU members, and OECD countries (non-EU members). The analyses cover the period from 1995 to present. Results of testing beta-convergence indicate that in the period 2008-2014 the countries of the CEEC-8 group converged to Mediterranean countries but did not converge to rich countries of the European Union or non-EU OECD countries. We estimate parameters of the dynamic panel model to identify the causes of the convergence slowdown of CEECs. According to the results of the estimation, the low level of innovation in the countries under consideration was the main cause of both the slower TFP growth and the convergence slowdown.
Keywords
Growth, Convergence, TFP Determinants,Dynamic Panel Model
1. Introduction
The main aim of this paper is to identify the causes of the significant growth and convergence slowdown in the 2008-2014 period in Central Eastern Europe Countries (CEEC-8) - Poland, the Czech Republic, Slovakia, Hungary, Lithuania, Latvia, Estonia, Slovenia - in relation to both the EU and the OECD countries (non-EU members), for which noticeable if not significant divergent tendencies can also be observed.
The growth and convergence slowdown and even the divergence process are relatively new phenomena for the CEECs, and it has come as a surprise to many economists and experts in the field because it has emerged after a slow but steady real convergence growth, as observed since these countries’ successful systemic transformation following
1995, and especially due to their entry into the EU in 2004. Namely, due to these two extremely important factors (systemic transformation and the benefits derived from their access to the EU) the CEECs have moved up or converged from an average of approximately 40% of EU gross domestic product (GDP) per capita at purchasing power parity (PPP) in 1990 to 55% in 2007 (Czasonis, Quinn, [8]).
Though the literature devoted to growth determinants in the countries of Central and Eastern Europe is very extensive, there is still a gap that should be bridged. Most analyses concentrate on the period of convergence, neglecting the fact that after the outbreak of the global financial crisis, a slowdown in convergence was observed. Using data showing the problem of innovativeness levels in the countries of Central and Eastern Europe, we point out the most important reasons for their convergence slowdown. Additionally, we contribute to the existing literature by showing the differences between countries in terms of both TFP determinants and TFP growth, and conduct counterfactual analyses which could provide useful hints for economic policies in the CEE countries.
The paper is divided into two parts. The first is devoted to the analysis of the growth and convergence process in the CEEC-8 group as observed since the beginning of the systemic transformation process in 1995 until 2014. It consists of both statistical analyses of the convergence process and the testing of hypotheses concerning beta-convergence, especially after the year 2007/2008 when the initial significant growth and convergence process broke down. The convergence process is monitored and analyzed by dividing the period 1995–2014 into three sub-periods: 1995–2003 (systemic transformation phase), 2004–2007 (advantages of the EU membership), and 2008–2014 (post-crisis period).
determinants of the CEECs. We estimate the parameters of the dynamic panel model using the Blundell–Bond [5] systemic estimator in order to avoid the problem of endogeneity of some regressors.
2. Literature Review
The process of economic or real convergence has become a widely discussed issue, especially with reference to advances in the emerging economies, which have made considerable progress in catching up with the developed West and North in recent decades (see e.g. Kutan, Yigit [25]; Kutan, Yigit [26]; Matkowski, Próchniak [31]; Vojinovic, Oplotnik [39]; Gepper, Stephan [14]; Monastiriotis et al. [33]; Izumov, Vahaly [21]; Kushnirsky [24]).
The debate concerning middle-income economiesand the middle-income trap in particulararose somewhat later, a decade or so ago, when some middle-income countries evidently stopped developing, at least in terms of real convergence towards developed ones. A number of valuable research studies were undertaken in relation to some Latin American and East Asian countries (Yusuf and Nabeshima [41]; Felipe [12]). Much of the research work has been done and/or supported by international financial institutions, for example the Asian Development Bank (Felipe [12]), the World Bank Development Research Group and the Inter-American Development Bank (Yusuf and Nabeshima [41]), as well as by the OECD Development Centre (e.g., Jankowska, Nagengast, and Perea [22]).
The middle income trap is a theorized economic development situation, when a country attains a certain income but gets stuck at that level. A country in the middle income trap will have lost competitive edge because wages are on a rising trend and work productivity increases slowly. Such country is unable to keep up with more developed economies in the high-value-added market. In order to avoid the middle income trap, strategies to introduce new processes should be identified and new markets should be found to maintain export growth.
The problem has become especially interesting, if not intriguing, in view of the great success of other ambitious countries - the Republic of Korea, Taiwan, Singapore, and Hong Kong - which tried to catch up and successfully converged, proving that real convergence is possible in the real world, not only in theory, provided the country embarks on an intelligently structured industrial policy, and remains consistent and persistent for a certain, rather long time (Lee [27], Lee et al. [28]).
Though all countries of the CEEC-8 group are classified as high-income countries (WESP [40]), convergence of the Central and Eastern European countries with the developed World slowed down after the global financial crisis took hold, suggesting a typical situation in which the above group of countries has entered the “middle-income economy trap”. Indeed many economists from the countries under consideration warn about the middle income trap problem
(Radło [36]). As a result, an analysis of the convergence slowdown seems to be crucial and the identification of the causes may provide useful recommendations for economic policy.
Many studies have been devoted to analysing the determinants of the convergence of the CEECs. Baran [3] analysed determinants of the TFP growth of CEEC-4 countries (Poland, Czech Republic, Slovakia and Hungary) in the period 1995-2010. According to the results, TFP contributions to growth were very important in the CEEC-4 in 1995-2006. However, when the global crisis began, a significant slowdown in technological progress was recorded. According to the results obtained by Czasonis and Quinn [8], the countries of Central and Eastern Europe converged to the rich Western European countries very quickly before 2007. Kutan and Yigit [26] found convergence to Germany in industrial production for the new members of the European Union, in the 1993-2000 period. In contrast, Dogan and Saracoglu [10] did not find any evidence of convergence.
3. Analysis of the Convergence of the
CEEC-8
To analyze the phenomenon of the convergence over the whole period 1995-2014 and in three sub-periods, we compare the growth rates of GDP per capita for the group of CEEC-8 with the growth rates of different groups of OCED member states. We divide the entire period into three sub-periods. The first sub-period encompasses 1995-2003, before the analysed countries joined the European Union. The second sub-period (2004-2007) covers the years after joining the European Union and before the global financial and economic crisis started.
Table 1. Rates of growth of real GDP per capita (in US$) in Central and Eastern European countries and selected groups of countries over the whole period 1995–2014 and in sub-periods.
Country/group of countries 1995–2014 1995–2003 2003–2008 2008–2014
Poland 131% 21% 97% -3%1
Czech Republic 121% 43% 86% -17%
Hungary 50% 26% 43% -17%
Slovakia 145% 52% 65% -2%
Lithuania 362% 138% 85% 5%
Latvia 250% 92% 91% -4%
Estonia 232% 82% 75% 4%
Slovenia 23% -2% 48% -15%
CEE 111% 25% 83% -8%
EU-15 29% 16% 22% -9%
EU-Mediterranean (France, Spain, Portugal, Greece, Italy) 26% 17% 25% -14% EU-North (Germany, the Netherlands, Finland, Austria,
Denmark, Sweden, Luxembourg) 35% 17% 22% -6%
Non-EU OECD 26% 10% 10% 4%
Table 2. Testing beta-convergence. Estimates of the beta parameter. P-values for testing hypothesis that this parameter equals 0 are given in brackets.
Group of countries 1995–2014 1995–2003 2003–2008 2008–2014
EU-15 -0.015 (0.30) -0.004 (0.84) -0.048 (0.01) -0.007 (0.79)
EU-Mediterranean -0.018 (0.29) -0.005 (0.86) -0.050 (0.02) -0.016 (0.07)
EU-North -0.013 (0.35) -0.004 (0.83) -0.045 (0.02) -0.004 (0.89)
Non_EU OECD -0.016 (0.23) -0.005 (0.79) -0.069 (0.00) (0.82) 0.006
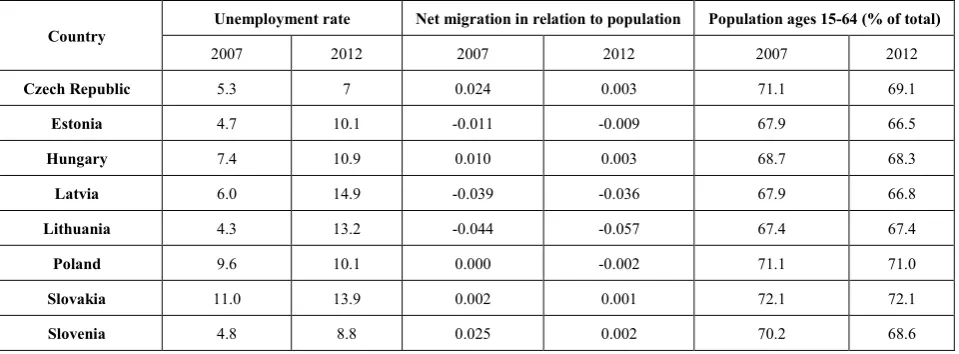
Table 3. Situation on the labor market and net migration in relation to population in the countries of the CEEC-8 group
Country Unemployment rate Net migration in relation to population Population ages 15-64 (% of total)
2007 2012 2007 2012 2007 2012
Czech Republic 5.3 7 0.024 0.003 71.1 69.1
Estonia 4.7 10.1 -0.011 -0.009 67.9 66.5
Hungary 7.4 10.9 0.010 0.003 68.7 68.3
Latvia 6.0 14.9 -0.039 -0.036 67.9 66.8
Lithuania 4.3 13.2 -0.044 -0.057 67.4 67.4
Poland 9.6 10.1 0.000 -0.002 71.1 71.0
Slovakia 11.0 13.9 0.002 0.001 72.1 72.1
Slovenia 4.8 8.8 0.025 0.002 70.2 68.6
[image:3.595.63.548.107.360.2] [image:3.595.66.548.384.487.2] [image:3.595.68.548.513.690.2]
The second period in the CEECs’ convergence process is symbolically marked by 2004, when the analyzed countries became EU members and so we define this phase the EU yield period. This is a symbolic distinction because the effects/benefits related to the CEECs’ membership started to take place even earlier (ca. 2000), when the pre-accession agreements indicated clearly that the countries had already embarked on the institutional convergence process with the EU (acquis communautaire), establishing a safe ground for international investors that resulted, ultimately, in both a significant FDI inflow into the CEEC-8 and the acceleration of growth.
The other obvious benefits of either expected or real EU membership included free access to EU markets for CEEC-8 exporters (e.g., Poland attained duty free access to EU markets when its accession agreement had been signed and approved by all EU member countries in 1994), EU assistance programs (which could be up to 4% of CEECs’ GDP), and the free movement of people. This latter benefit included systematically implemented legal work permits for the outflow of labor, easing thein some countries dramaticunemployment problem, as well as resulting in substantial money transfers remitted by emigrants to their mother countries. As an example, Poland has been receiving US$5–7 billion annually from such remittances since EU membership.
The positive effects of the above factors, in addition to the benefits coming from the increasingly mature systemic transformation process (mostly thanks to progressive privatization processes, open trade benefits, and on-going institutional adjustments), resulted in the significant acceleration of GDP growth in these countries. As can be seen from the Table 1, CEECs experienced an unprecedented rapid GDP growth in the period 2004–2007, leading them to be considered the group of “fast growing countries,” that is, countries with a GDP per capita average annual growth rate of 3.5% for seven or more years.
The problem is that the happy era of growth in the period 2000–2007, and in the 2004–2007 sub-period in particular, ended dramatically following 2007, bringing most of the CEECs’ convergence almost to a stop. This came as a surprise to economists, politicians, and experts alike (see EBRD, 2014). Over time, however, the negative tendency of growth in the CEECs started to be better recognized and understood when data showed that unemployment in the CEECs had started to grow (see Table 3). As a result of the slowdown in growth and investment, which brought a rise in unemployment, yet another plague started to be a problem, namely CEECs’ emigration began to grow rapidly. This trend has eased unemployment on the one hand, but it has a dangerous weak point, namely the age composition of the labor outflow consisting primarily of young and middle-aged educated people (see Table 3). The development of all these negative factors has resulted in a visible slowdown in the convergence of CEECs vis-à-vis the total EU. The CEECs’ declining GDP growth rates since
2008 have contributed to the convergence slowdown. Other factor making the CEECs’ convergence vis-à-vis the total EU easier to achieve has been the EU Mediterranean countries’ negative and/or relatively slow growth for most of the period 2008–2014. This phenomenon is in contrast to the relatively positive growth rates of most of the rest of the EU-15, which we can call the EU-North, comprising the Scandinavian countries, Austria, Germany, Belgium, the Netherlands, the UK, Ireland, and Luxemburg. As we can observe, the Mediterranean countries as a group, having had negative and/or very slow GDP growth rates over that period, are the only EU area against which the CEECs can claim a real convergence process (Table 1). As a result of the simultaneous development of the two opposite tendencies, namely relatively faster EU-North growth and negative and/or very slow growth in the Mediterranean countries (see Table 1), and given the visible slowdown in growth in the CEECs in that period, the CEECs’ convergence toward the total EU and EU-15 has been very low, with some minor positive differences with respect to Poland, Slovakia, and Estonia. By examining Non-EU OECD countries, we note that the total EU position has worsened vis-à-vis both OECD Anglo-Saxon countries overseas and most small and medium-sized OECD countries, such as Switzerland, Chile, Israel, and Turkey. Indeed GDP per capita differences have been growing in favor of OECD non-EU members, and the EU surplus position has diminished vis-à-vis Chile, Switzerland, Turkey, and Israel.
We can also see that the OECD non-EU members have been growing at faster pace than most of the countries in Central and Eastern Europe. Similar negative conclusions may be found comparing CEECs’ GDP growth rates with both OECD Anglo-Saxon countries and Switzerland, Israel, and Turkey, to mention but a few of the fast moving OECD non-EU members. As a result, we find that a divergence process has been well under way, rather than the convergence experienced by the CEECs’ before 2008. This may suggest that the CEECs have reached a kind of plateau in their developmental path as measured by the real convergence process and the progress. If the convergence process cannot be revived, we must admit that the CEECs have become stuck in the middle-income trap, as did many Latin American and some East Asian countries years before
.
Though all countries of the CEEC-8 group are classified as high-income countries (WESP [40]), convergence of the Central and Eastern European countries with the developed World slowed down after the global financial crisis took hold, suggesting a typical situation in which the above group of countries has entered the “middle-income economy trap”. Indeed many economists from the countries under consideration warn about the middle income trap problem (Radło [36]).
improve. Average growth rates for Estonia and Lithuania was below the EU-average. In the case of Latvia, Slovenia and Poland the GDP growth rate was a bit better and only in the case of Romania this indicator was satisfactory. However some high-income countries recorded very high growth rates in the analyzed period (e.g. Ireland, Iceland, Malta, Luxembourg), which means that the problem of divergence of some countries of the Central and Eastern Europe is still valid.
4. Econometric Analysis of the
Determinants of the Total Factor
Productivity (TFP) Growth Rate
According to the Solow growth accounting, the growth rate of output is decomposed into (Solow [36]): changes in the quantity of the physical capital, changes in the amount of labour, unexplained factor reflecting technological progress and called the “Solow residual” or “Total factor productivity”.
TFP accounts for a significant proportion of the differences in income across countries. Since obtaining a measure of TFP growth on an economy-wide level is a difficult task, two main alternatives are used: growth accounting and frontier analysis. According to the growth accounting approach, TFP growth is identified as the value of the residual of the production function after accounting for the contribution of the inputs’ changes to output growth. Therefore changes in the Total-Factor Productivity reflect both changes in the efficiency of production and technological progress, while the non-parametric (production-frontier) method enables this decomposition (see: Baran [3]). In the empirical research, we used the growth accounting approach to calculate the Total-Factor Productivity for all countries of the CEEC-8 group for the period 1996-2014.
Before the econometric model is specified, economic theories devoted to the determinants of TFP should be mentioned. The following groups of variables are distinguished (see: Barro, Sala-i-Martin [4]; Isaksson [20]; Herrendorf, Valentinyi [18]; Danquah, Moral-Benito, Ouattara, [9]): variables associated with the creation, transmission, and absorption of knowledge, variables associated with factor supply and efficient allocation, variables associated with institutions, integration, and invariants, variables associated with competition, social dimensions, and the environment.
An important factor for TFP growth is an effective innovation system. Through this means, research and development (R&D) is fostered and results in new products, processes, and knowledge. Therefore, the value of investment in R&D (or its stock) is very often used as an explanatory variable in models explaining TFP (see e.g. Gullec and Van Pottelsberghe de la Potterie [17]). As knowledge is created by a small number of countries and
most countries need state-of-the-art technology, they must acquire it from elsewhere. Foreign direct investment (FDI) is very often perceived as a key channel for the transfer of advanced technology from highly developed to developing countries. Moreover, it is believed that FDI generates positive externalities in the form of spillovers of knowledge to the domestic economy due to linkages with local clients and suppliers, learning from foreign firms, and employee training programs. Therefore, FDI is perceived as a factor that has a positive impact on productivity (see, e.g. Isaksson [20]).
Trade is also considered a carrier of knowledge and some authors argue that thanks to imports, advanced foreign technology is introduced into domestic production, which in turn positively affects TFP. On the other hand, technology adoption from abroad and the creation of good domestic technology require human capital. An improvement results in an increase in TFP. Therefore, trade openness is very often used as an explanatory variable in models explaining TFP (see, e.g. Danquah et al. [9]).
Good education and training help a society increase its ability to acquire and use relevant knowledge. Level of education, which is commonly used as a measure of human capital, has an important effect on TFP as it plays a very important role in shaping an economy’s capacity to carry out technological innovation and adopt new technology (see, e.g. Romer [37]). The level of health in a society influences growth in TFP directly through household wealth, and indirectly through labor productivity, investments, savings, and demography. Healthy workers are more productive and lower mortality rates result in larger savings (Danquah et al. [9]). Infrastructure plays an important role in expanding productive capacity by increasing resources and enhancing private capital productivity. Therefore, the stock of infrastructure is very often used as a factor influencing the level of productivity.
The privatization of enterprises therefore results in increased competition, as it reduces management slack. The relative inefficiency of state-owned enterprises might be due to political pressures, and the lack of separation between control and ownership. Another explanation for the lower efficiency of state-owned enterprises is the fact that they seldom try to maximize profits and have greater incentives to adopt anti-competitive behavior. All in all, variables associated with the state of privatization should also be considered in models explaining growth in TFP.
Some works devoted to the determinants of TFP highlight the role of the social dimension, which denotes income, wealth distribution, and the wealth level in an economy. It seems that the greater the difference between owners of capital and workers, the lower the motivation of workers and their productivity (e.g. Isaksson [20]). Therefore, measures associated with income inequality may also be used in regression analyses of TFP growth.
On the basis of data availability and the significance2 of variables in explaining technological change, we finally estimate the parameters of the following model:
it it it
GR
TFP_ =z α+ε (1) where zitconsists of explanatory variables as defined in
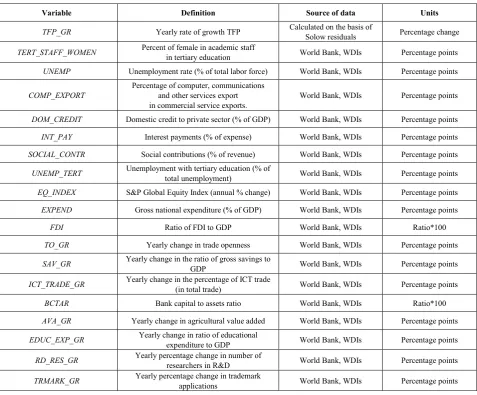
Table 4. Before we began estimation, panel unit root tests were conducted. The results of testing of the order of integration of time series are presented in Table 5. They indicate that the variables used in the specification (1) are stationary. In the case of non-stationary variables, we used differences. Therefore, we didn’t have any problems with spurious regression. We estimated the parameters of the model (1) using the Blundell-Bond systemic estimator (Blundell, Bond [5]). Use of this method results from the fact that we have the problem of endogeneity of certain variables in the equation (1). Frankel and Romer [13] show that trade is endogenous, while Dollar and Kraay [11] show that finance is also endogenous. The Blundell-Bond estimator solves the problem of endogeneity (Baltagi, [2]). Moreover, results of the Monte Carlo simulations indicate that this estimator is the most efficient among dynamic panel data estimators. A similar methodology in the same context was applied by, among others, Khan [23] for the African continent.
Due to availability of data, we can estimate the parameters of the dynamic panel model using yearly data for the period 1996–2014. Our sample covers Central and Eastern European countries that joined the EU in 2004, i.e., Poland, the Czech Republic, Hungary, Slovakia, Lithuania, Latvia, Estonia and Slovenia.
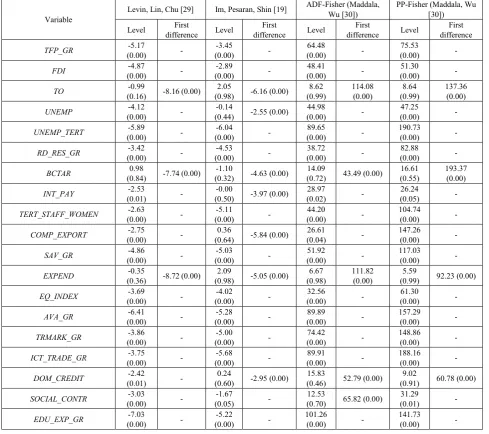
Table 5 presents the results of the estimation of the parameters of the dynamic panel model using Blundell and Bond’s [5] systemic estimator, as well as the results of validity testing for over-identifying restrictions and the presence of autocorrelation of order 2.
2 We drop insignificant variables
The positive and significant estimate of the parameter for the variable TFP_GRit-1 means that the growth rate of TFP is positively correlated with its lag. The positive estimate of the parameter for the variable SAV_GRit means that in the group of CEEC-8 increasing the ratio of savings to GDP had a greater chance of an increase in productivity in the years 2008–2013. A larger level of savings results in the accumulation of capital, which is necessary for buying new technology enabling the attainment of higher levels of productivity. The ratio of domestic credit to private sector to GDP turned out to have a negative impact on the rate of growth of TFP. This means that the “too much finance” hypothesis may be valid for the countries of the Central and Eastern Europe (Próchniak, Wasiak [35]; Grabowski, Maciejczyk-Bujnowicz [15], [16]).
Table 4. Definitions of variables used in the model.
Variable Definition Source of data Units
TFP_GR Yearly rate of growth TFP Calculated on the basis of Solow residuals Percentage change
TERT_STAFF_WOMEN Percent of female in academic staff in tertiary education World Bank, WDIs Percentage points
UNEMP Unemployment rate (% of total labor force) World Bank, WDIs Percentage points
COMP_EXPORT Percentage of computer, communications and other services export
in commercial service exports. World Bank, WDIs Percentage points
DOM_CREDIT Domestic credit to private sector (% of GDP) World Bank, WDIs Percentage points
INT_PAY Interest payments (% of expense) World Bank, WDIs Percentage points
SOCIAL_CONTR Social contributions (% of revenue) World Bank, WDIs Percentage points
UNEMP_TERT Unemployment with tertiary education (% of total unemployment) World Bank, WDIs Percentage points
EQ_INDEX S&P Global Equity Index (annual % change) World Bank, WDIs Percentage points
EXPEND Gross national expenditure (% of GDP) World Bank, WDIs Percentage points
FDI Ratio of FDI to GDP World Bank, WDIs Ratio*100
TO_GR Yearly change in trade openness World Bank, WDIs Percentage points
SAV_GR Yearly change in the ratio of gross savings to GDP World Bank, WDIs Percentage points
ICT_TRADE_GR Yearly change in the percentage of ICT trade (in total trade) World Bank, WDIs Percentage points
BCTAR Bank capital to assets ratio World Bank, WDIs Ratio*100
AVA_GR Yearly change in agricultural value added World Bank, WDIs Percentage points
EDUC_EXP_GR Yearly change in ratio of educational expenditure to GDP World Bank, WDIs Percentage points
RD_RES_GR Yearly percentage change in number of researchers in R&D World Bank, WDIs Percentage points
[image:7.595.68.546.94.489.2]Table 5. Results of testing order of integration for variables used in the model using panel unit root tests. Values of statistics and p-values (in brackets) are given.
Variable Levin, Lin, Chu [29] Im, Pesaran, Shin [19]
ADF-Fisher (Maddala,
Wu [30]) PP-Fisher (Maddala, Wu [30]) Level difference First Level difference First Level difference First Level difference First
TFP_GR (0.00) -5.17 - (0.00) -3.45 - (0.00) 64.48 - (0.00) 75.53 -
FDI (0.00) -4.87 - (0.00) -2.89 - (0.00) 48.41 - (0.00) 51.30 -
TO (0.16) -0.99 -8.16 (0.00) (0.98) 2.05 -6.16 (0.00) (0.99) 8.62 114.08 (0.00) (0.99) 8.64 137.36 (0.00)
UNEMP (0.00) -4.12 - (0.44) -0.14 -2.55 (0.00) (0.00) 44.98 - (0.00) 47.25 -
UNEMP_TERT (0.00) -5.89 - (0.00) -6.04 - (0.00) 89.65 - 190.73 (0.00) -
RD_RES_GR (0.00) -3.42 - (0.00) -4.53 - (0.00) 38.72 - (0.00) 82.88 -
BCTAR (0.84) 0.98 -7.74 (0.00) (0.32) -1.10 -4.63 (0.00) (0.72) 14.09 43.49 (0.00) (0.55) 16.61 193.37 (0.00)
INT_PAY (0.01) -2.53 - (0.50) -0.00 -3.97 (0.00) (0.02) 28.97 - (0.05) 26.24 -
TERT_STAFF_WOMEN (0.00) -2.63 - (0.00) -5.11 - (0.00) 44.20 - 104.74 (0.00) -
COMP_EXPORT (0.00) -2.75 - (0.64) 0.36 -5.84 (0.00) (0.04) 26.61 - 147.26 (0.00) -
SAV_GR (0.00) -4.86 - (0.00) -5.03 - (0.00) 51.92 - 117.03 (0.00) -
EXPEND (0.36) -0.35 -8.72 (0.00) (0.98) 2.09 -5.05 (0.00) (0.98) 6.67 111.82 (0.00) (0.99) 5.59 92.23 (0.00)
EQ_INDEX (0.00) -3.69 - (0.00) -4.02 - (0.00) 32.56 - (0.00) 61.30 -
AVA_GR (0.00) -6.41 - (0.00) -5.28 - (0.00) 89.89 - 157.29 (0.00) -
TRMARK_GR (0.00) -3.86 - (0.00) -5.00 - (0.00) 74.42 - 148.86 (0.00) -
ICT_TRADE_GR (0.00) -3.75 - (0.00) -5.68 - (0.00) 89.91 - 188.16 (0.00) -
DOM_CREDIT (0.01) -2.42 - (0.60) 0.24 -2.95 (0.00) (0.46) 15.83 52.79 (0.00) (0.91) 9.02 60.78 (0.00)
SOCIAL_CONTR (0.00) -3.03 - (0.05) -1.67 - (0.70) 12.53 65.82 (0.00) (0.01) 31.29 -
EDU_EXP_GR (0.00) -7.03 - (0.00) -5.22 - 101.26 (0.00) - 141.73 (0.00) -
Table 6. Estimation results for parameters of the dynamic panel model using the systemic Blundell–Bond [5] estimator.
Variable Estimate Standard error p-value
Cons 0.305 0.034 0.000
TFP_GRit-1 0.195 0.041 0.000
TERT_STAFF_WOMEN 0.0048 0.0022 0.029
UNEMP -0.0081 0.0025 0.001
COMP_EXPORT 0.0018 0.0009 0.047
ΔDOM_CREDIT -0.0005 0.0003 0.078
INT_PAY -0.0149 0.0063 0.020
SOCIAL_CONTR -0.0014 0.0008 0.076
UNEMP_TERT -0.0051 0.0025 0.038
EQ_INDEXit-1 0.0002 0.0001 0.024
ΔEXPEND -0.0106 0.0030 0.000
FDI 0.0012 0.0005 0.011
ΔTO -0.0023 0.0003 0.000
SAV_GR 0.0161 0.0041 0.000
ICT_TRADE_GR 0.0203 0.0068 0.002
BCTAR -0.0171 0.0032 0.000
AVA_GR -0.1930 0.0710 0.003
RD_RES_GR 0.2910 0.1170 0.013
TRMARK_GR 0.1980 0.0440 0.000
EDUC_EXP_GRit-2 0.0054 0.0013 0.000
Testing the presence of the autocorrelation of order 2 Statistic = 0.18 p-value = 0.85
Sargan test of over-identifying restrictions Statistic = 126.37 p-value = 0.20
Two more variables associated with the level of innovativeness of the economy turn out to be statistically significant, exerting a positive impact on the level of productivity in the group of countries analyzed. A) An upward change in the number of scientists in R&D positively affects the change in TFP. Therefore, governments should spend more money on research and concentrate on branches in which R&D is important. Instead of spending money on less skilled jobs and university faculties not associated with R&D, more money should be spent on faculties in which R&D is essential. B) A percentage change in trademark applications has a significant and positive impact on the change in TFP. An increase in trademark applications is associated with an increase in the range of products supplied. The provision of products new to the market requires the use of advanced technology, which ultimately leads to an increase in the level of productivity.
The positive and significant estimate of the parameter for the variable EDUC_EXP_GRit-2 means that the growth in expenditure on education positively affects productivity growth with a lag of two years. This result is in line with expectations, as an increase in educational expenditure leads to an improvement in human capital, which should lead to the higher productivity of workers. In addition, an increase in expenditure on tertiary education associated with
engineering and science faculties should lead to the development of new technologies and an increase in productivity. A change in the proportion of value added in agriculture to total output has a negative impact on the change in TFP. At the beginning of the transformation process, the share of employment in agriculture and the share of added value in agriculture were at relatively high levels in the Central and Eastern European countries. The decrease in the significance of agriculture started as a result of the process of transformation from centrally planned to market economies. Simultaneously, a decrease in the proportion of value added in agriculture to total output resulted in an increase of the significance of services and manufacturing. This might have led to the development of more innovative products in services and manufacturing, and to the increase in the change in TFP, which is in line with the estimate.
[image:9.595.67.546.89.444.2]This means that all citizens contribute to the innovativeness of their country.
Two variables associated with the situation on the labour market turned out to be statistically significant: the unemployment rate and percentage of unemployed with a tertiary education both have a significant negative impact on TFP growth. This means that the governments of the CEE countries should take special care of their labour markets, and introduce programmes that enable a reduction of the unemployment rate among new university graduates. If new graduates have problems finding appropriate jobs they emigrate, and so the percentage of well-educated citizens in the labour force decreases. Estimates of the parameters for the variables INTEREST_PAYMENT and EXPEND show that governments should look at their public finances, in order to reduce interest payments, and that the percentage of expenses in GDP should be reasonable. If a government does not look after its public finances, investors’ fears about debt sustainability are reflected in a higher level of treasury bond yields. Investors are then less prone to investing in their own countries, which leads to slower technological progress. A positive estimate of the parameter for the variable EQ_INDEX is in line with expectations. Countries recording an increase of equity prices are wealthier, and their citizens can invest more money in innovative technology.
A variable representing situation in the banking sector turned out to be statistically significant as well. The higher is the bank capital to assets ratio, the slower is TFP growth. This result is in line with Mero and Piroska [32]. These authors have found that banking and economic nationalism in the countries of the Central and Eastern Europe prevented economic development and better integration to EU structures.
It should also be noted that some variables turned out to be nonsignificant, and these variables were not included in the final specification. This especially concerns variables associated with female labor participation and the proportion of women in wage employment in non-agricultural sectors. Because of cultural aspects, women in Central and Eastern European countries quite frequently participate in the labor force (in some countries, female labor participation is greater than that of male labor participation). Therefore, changes in female labor participation do not have a significant impact on changes in TFP. Variables demonstrating inequality were not included in the final specification due to poor data availability. The results of testing for autocorrelation of order 2 confirm that including further lags of the dependent variable is not justified. The results of the Sargan test confirm that over-identifying restrictions are valid and the specification of the dynamic panel model is correct.
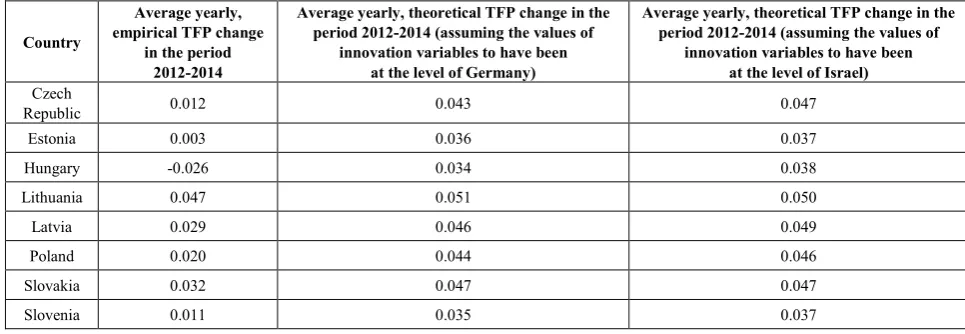
To identify the main reasons for convergence slowdown and weak change in Total-Factor Productivity, the performance of the main variable, as well as variables
reflecting the level of innovativeness will be analysed. Data for countries from the CEEC-8 group will be compared with data for highly-developed countries. Table 7 presents the average annual changes of Total-Factor Productivity and the performance of innovative variables in the period 2011-2014 in the countries under consideration, as well as in selected highly-developed countries. Results from table 7 indicate that the level of innovativeness in the countries of Central and Eastern Europe is much lower than in Germany and Israel. The number of R&D researchers and the percentage of ICT service exports are very low in comparison with highly-developed countries. Moreover, the trend in ICT exports and trademark applications is not optimistic for most of the CEEC-8 group, with the most pessimistic trend observed in Hungary. However, positive cases in this group can be identified as well. A relatively high level of innovativeness is recorded for the Baltic states (except Estonia), and Slovakia. Analysis of the results from tables 1 and 7 indicates that the countries of Central and Eastern Europe should make efforts to increase their level of innovativeness if they want to catch up. In the countries with the strongest divergence tendencies (the Czech Republic, Hungary, Slovenia), the level of innovativeness is low. Countries that recorded increases or only slight decreases of GDP per capita in the crisis period (Slovakia, Lithuania, Latvia) are outperforming the other countries of the analysed region in terms of innovativeness
.
Table 7. Average yearly TFP changes and performance of innovative variables in the countries of the CEEC-8 group and selected highly-developed countries.
Country Average yearly TFP change in the period 2012-2014
Change in the trademark applications in the period
2012-2014 (%)
Change in the ICT service export (% of service export) in the period 2012-2014 (in percentage points)
Researchers in R&D (per million people). Average value
from the period 2012-2014
Czech
Republic 0.012 -10 +0.94 3273
Estonia 0.003 -2 +0.14 3361
Hungary -0.026 +10.1 -1.02 2522
Lithuania 0.047 -2.8 +1.44 2836
Latvia 0.029 -12.5 +2.87 1867
Poland 0.020 -3.6 +0.17 1873
Slovakia 0.032 -2.4 +2.14 2752
Slovenia 0.011 -23.1 +0.65 4224
Germany 0.022 +9.4 +0.87 4386
[image:11.595.62.548.100.287.2]Israel 0.042 +4 +2.77 8255
Table 8. Empirical and theoretical (assuming the values of innovation variables to have been at the level of Germany and Israel) values of the TFP change
Country
Average yearly, empirical TFP change
in the period 2012-2014
Average yearly, theoretical TFP change in the period 2012-2014 (assuming the values of
innovation variables to have been at the level of Germany)
Average yearly, theoretical TFP change in the period 2012-2014 (assuming the values of
innovation variables to have been at the level of Israel)
Czech
Republic 0.012 0.043 0.047
Estonia 0.003 0.036 0.037
Hungary -0.026 0.034 0.038
Lithuania 0.047 0.051 0.050
Latvia 0.029 0.046 0.049
Poland 0.020 0.044 0.046
Slovakia 0.032 0.047 0.047
Slovenia 0.011 0.035 0.037
5. Conclusions
Though all countries of the CEEC-8 group are classified as high-income countries (WESP [40]), convergence of the Central and Eastern European countries with the developed World slowed down after the global financial crisis took hold, suggesting a typical situation in which the above group of countries has entered the “middle-income economy trap”. Therefore many economists from the countries under consideration warn about the middle income trap problem and identification of the causes of convergence slowdown seems to be important. The results of the analysis of the CEECs’ performance in terms of both GDP per capita growth and the convergence process, as well as the results of the estimation of the parameters of the TFP growth, show that the convergence of the Central and Eastern European countries with the world economy slowed down after outbreak of the global financial crisis in 2008, suggesting a typical situation in which the above group of countries has fallen into the “middle-income economy trap”.
In the first part of our analyses, based primarily on a in-depth statistical investigation, we find that although the countries under consideration had relatively high GDP
growth rates after 2000, and especially after their access to EU, soon after, in the period of the global financial crisis 2007–2008, their GDP slowdown was very significant. What is more, the slow convergence of the CEECs toward the total EU in the period 2008–2013 can be attributed predominantly to the very deep recession in part of the euro area, mostly in the Mediterranean countries, rather than to their good economic performance in absolute terms. Indeed, measuring the CEECs’ performance vis-à-vis EU-North, namely such countries as Germany or Sweden, during the period 2008–2014, a divergent process can even be observed. Similar negative results are observed after 2008, especially when comparing the CEECs’ growth results with those of other world economies, such as OECD non-EU member countries, for example the Anglo-Saxon countries, such as the USA, Canada, Australia, and New Zealand, and other OECD member states, such as Switzerland, Chile, Israel, and Turkey, not to mention the East Asian tigers such as the Republic of Korea and Taiwan, which show two or three times higher GDP growth rates two or three times higher than those of the CEECs over the 2008-2014 period.
[image:11.595.61.544.307.474.2]analyzed have predominantly been TFP-driven, we have implemented econometric modeling to estimate the significance of TFP factors in the development of CEECs’ GDP and convergence. In other words, we propose the estimation of parameters of the chosen dynamic panel model and the use of the Arellano–Bond [1] and Blundell– Bond [5] estimators. Using this dynamic panel model and the estimators, we come to the conclusion that the CEECs’ slowdown in convergence results from relatively low rates of growth in TFP in Central and Eastern Europe. This may be due to low investments generally and the low innovativeness of these countries (especially Poland). The numbers of patents and R&D expenditure are relatively low in the case of Central and Eastern European countries. This leads to slower growth in TFP and a slowdown in convergence. These countries’ competiveness has primarily been driven by low labor costs, which is not a sufficient condition for maintaining the long-term ability to compete. Although the human capital index increased very rapidly in these countries, the coefficient may give misleading information as higher education in CEECs was not adjusted to market requirements, resulting in a large percentage of people with university education but not the appropriate capabilities. To advance and avoid being stuck in the middle-income trap, these countries should spend less money on consumption and more money on investment and R&D. Policy makers in Central and Eastern European countries should concentrate more on adjusting the profiles of higher education to the new challenges of the modern world.
Moreover convergence slowdown in the countries under consideration was due to bad economic policy choices of CEECs governments to combat the crisis (Myant, Drahokupil, [34]). Banking and economic nationalism prevented economic development and better integration to EU structures (Mero, Piroska [32]).
The analyses showed differences within the CEEC-8 group. The strongest divergence tendencies were observed for the Czech Republic, Slovenia and Hungary, where increases in innovation were very slow. On the other hand, Lithuania, Latvia and Slovakia outperformed other countries in terms of innovativeness and converged faster than the highly-developed OECD countries. Analysis of the results across countries could contribute something to discussion of the choice of exchange rate mechanisms in the countries of Central and Eastern Europe. In general, the Baltic states and Slovakia – members of the EMU – perform better than the Czech Republic, Hungary and Poland, which have their own currencies. Large fluctuations in the EUR/PLN, EUR/HUF and EUR/CZK exchange rates might have resulted in a high level of uncertainty associated with doing business in Poland, Hungary and the Czech Republic. Therefore, enterprises in these countries made less innovative effort and used price levels as their main competitive tool. In the short-run, a positive GDP growth rate (in local currency) was recorded in the case of Poland at the beginning of the global financial
crisis. In the long-run, however the countries that entered the EMU and increased their innovative effort (Latvia, Lithuania, Slovakia) outperformed Poland.
Acknowledgements
The authors gratefully acknowledge the contribution of the anonymous reviewers whose comments have enabled a significant improvement in the earlier version of the paper. The paper was written with the financial support of National Science Centre, Poland, under grant No. 2015/19/D/HS4/03354.
REFERENCES
[1] M. Arellano, S. Bond. Some tests of specification for panel data: Monte Carlo evidence and an application to employment equations, Review of Economic Studies, Vol.58, 277-297, 1991.
[2] B.H. Baltagi. Econometric analysis of panel data, Wiley, London, 2008.
[3] K.A. Baran. The Determinants of Economic Growth in Hungary, Poland, Slovakia and the Czech Republic During the Years 1995-2010, Equilibrium. Quarterly Journal of Economics and Economic Policy, Vol.8, 7-26, 2013
[4] R.J. Barro, X. Sala-i-Martin. Economic growth, Mc Graw-Hill Inc.
[5] R. Blundell, S. Bond. Initial conditions and moment restrictions in dynamic panel data models, Journal of Econometrics, Vol. 87, 115-143, 1998.
[6] J.C. Brada, A.E. King. Is Private Farming More Efficient than Socialized Agriculture?, Economica, Vol. 60, 41-56. [7] J.C. Brada, A.E. King, C.Y. Ma. Industrial Economics of the
Transition: Determinants of Enterprise Efficiency in Czechoslovakia and Hungary, Oxford Economic Papers, Vol. 49, 104-127, 1997.
[8] M. Czasonis, M.A. Quinn. Income convergence in Europe: catching up or falling behind? Acta Oeconomica, Vol. 62 183-204, 2012.
[9] M. Danquah, E. Moral-Benito, B. Ouattara. TFP growth and its determinants: a model averaging approach. Empirical Economics, Vol. 47, 227-251, 2014.
[10] N. Dogan N, B. Saracoglu. Income Convergence of European Union and Candidate Countries: Are they All the Same? International Research Journal of Finance and Economics, Vol. 12, 160-164, 2007.
[11] D. Dollar, A. Kraay. Growth is good for the poor. Journal of Economic Growth, Vol. 7, 195–225, 2002.
[13] J.A. Frankel, D.H. Romer. Does Trade Cause Growth? American Economic Review, Vol. 89, 379-399, 1999. [14] K. Gepper, A. Stephan. Regional Disparities in the European
Union: Convergence and Agglomeration. Papers in Regional Science, Vol. 87, 193-217, 2006.
[15] W. Grabowski, I. Maciejczyk-Bujnowicz. Optimizing the level of bank credit to promote economic growth. Implications for Poland, Studia Naukowe Uniwersytetu Ekonomicznego w Katowicach, Vol. 269, 99-111, 2016. [16] W. Grabowski, I. Maciejczyk-Bujnowicz. Verification of the
hypothesis, Too much finance” in the polish economy, Central European Review of Economics and Finance, Vol. 12, 41-52, 2016.
[17] D. Gullec, B. Van Pottelsberghe de la Potterie. R&D and Productivity Growth: Panel Data Analysis of 16 OECD Countries, OECD Economic Studies, Vol. 33, 103-126, 2001. [18] B. Herrendorf, A. Valentinyi. Which Sectors Make Poor
Countries So Unproductive? Journal of the European Economic Association, Vol. 10, 323-341, 2012.
[19] K.S. Im, M.H. Pesaran, Y. Shin. Testing for unit roots in heterogeneous panels. Journal of Econometrics, Vol. 115, 53-74, 2003.
[20] A. Isaksson. Determinants of total factor productivity: a literature review. Research and Statistics Branch Staff Working Paper.
http://www.unido.org//fileadmin/user_media/Publications/R esearch_and_statistics/Branch_publications/Research_and_P olicy/Files/Working_Papers/2007/WP022007%20-%20Deter minants%20of%20total%20factor%20productivity.pdf, 2007.
[21] A. Izumov, J. Vahaly. Old Capital vs. New Investment in Post-Soviet Economies: Conceptual Issues and Estimates. Comparative Economic Studies, Vol. 50, 63-83, 2003. [22] A. Jankowska, A.J. Nagengast, J.R. Perea. The
Middle-Income Trap: Comparing Asian and Latin American Experiences. OECD Development Centre, Policy Insights 96, 2012, doi: 10.1787/20772599.
[23] F.A. Khan. Economic convergence in the African continent: Closing the gap, South African Journal of Economics, Vol. 82, 354-370, 2014.
[24] F. Kushnirsky. A Modification of the Production Function for Transition Economies Reflecting the Role of Institutional Factors. Comparative Economic Studies, Vol. 42, 1-30, 2001. [25] A.M. Kutan, T.M. Yigit. Nominal and Real Stochastic
Convergence of Transition Economies. Journal of Comparative Economics, Vol. 32, 23-36, 2004.
[26] A.M. Kutan, T.M. Yigit. Nominal and Real Stochastic Convergence: Are the New EU Members Ready to Join the Euro Zone? Journal of Comparative Economics, Vol. 33, 387-400, 2005.
[27] K. Lee. Schumpeterian Analysis of Economic Catch-up Knowledge, Path-Creation, and the Middle-Income Trap, Cambridge University Press, Cambridge, 2013.
[28] K. Lee, B-Y Kim, Y-Y Park, E. Sanidas. Big Business and Economic Growth: Identifying a Binding Constraint for for Growth with Country Panel Analysis, Journal of Comparative Economics Vol.41, 561-582, 2013.
[29] A. Levin, C.F. Lin, J.C. Chu. Unit root tests in panel data: Asymptotic and finite sample properties, Journal of Econometrics, Vol. 108, 1-24, 2002.
[30] G.S. Maddala, S. Wu. A comparative study of unit root tests with panel data and a simple new test, Oxford Bulletin of Economics and Statistics, Vol. 61, 631-652, 1999.
[31] Z. Matkowski, M. Próchniak. Economic Convergence between the CEE-8 and the European Union. Eastern European Economics 45: 59-76
[32] K. Mero, D. Piroska. Banking Union and Banking Nationalism – Explaining Opt-Out Choices of Hungary, Poland and the Czech Republic, International Business School Working Paper, 1/2016.
[33] V. Monastiriotis, D. Kallioras, G. Petrakos. The regional impact of European Union association agreements: an event-analysis approach to the case of Central and Eastern Europe. Regional Studies, doi:
10.1080/00343404.2016.1198472, 2016.
[34] M. Myant, J. Drahokupil. International integration, varieties of capitaslism, and resilience to crisis in transition economies, Europe-Asia Studies, Vol. 64, 1-33, 2012.
[35] M. Próchniak, K. Wasiak. The impact of the financial system on economic growth in the context of the global crisis: empirical evidence for the EU and OECD countries. Empirica. Doi: 10.1007/s10663-016-9323-9.
[36] M.J. Radło. Strzeżmy się tej pułapki,
http://www.forbes.pl/czy-polska-jest-w-pulapce-sredniego-d ochodu-,artykuly,194379,1,1.html, 2015.
[37] P.M. Romer. Endogenous Technical Change, Journal of Political Economy, Vol. 98, 71-102, 1990.
[38] R.M. Solow. Technological Change and the Aggregate Production Function, Review of Economics and Statistics, Vol. 39, 312-320, 1957.
[39] B. Vojinovic, Z.J. Oplotnik Real Convergence of GDP per Capita in the New EU Member States. Transformations in Business and Economics, Vol. 7, 89-103, 2008.
[40] WESP. World Economic Situation and Prospects, http://ww w.un.org/en/development/desa/policy/wesp/wesp_current/20 14wesp_country_classification.pdf, 2014
![Table 6. Estimation results for parameters of the dynamic panel model using the systemic Blundell–Bond [5] estimator.](https://thumb-us.123doks.com/thumbv2/123dok_us/8778696.902930/9.595.67.546.89.444/table-estimation-results-parameters-dynamic-systemic-blundell-estimator.webp)