Intelligent Activity Awareness Systems - New
Classification Method and Comparison Study
Yiming Ji
∗,
Lee Fair
Computational Science, University of South Carolina Beaufort, Bluffton, South Carolina, United States ∗Corresponding Author: [email protected]
Copyright c⃝2014 Horizon Research Publishing All rights reserved.
Abstract
Research in mobile activity awareness has attracted much attention lately due to the lack of mechanisms to guide individuals to engage in health-promoting life styles, including diet and exercise. In fact, several studies have successfully proposed activity classifiers in order to develop intelligent activity awareness systems using off-the-shelf mobile devices such as smart phones. However, most exist-ing research applies customized sensors (i.e., with a much higher data sampling rate) from multiple sensor technologies (such as GPS, cellular or WiFi radio, accelerometer, digital compass, and others). They are not practical and therefore this research uses only an ordinary accelerometer sensor from a commercial phone device. It first applies the Gabor filter to this activity recognition field and then it studies the effectiveness of this new method against several existing classifiers, including nearest neighbors, support vector machines, and linear discriminant analysis. Results from this work show that with appropriate data sampling windows and feature vectors, a classification accuracy of over 90% is a realistic goal for the Gabor and most existing classifiers.Keywords
Activity Awareness, Mobility Detection, Fea-ture Analysis, Classification, Smart Health1
Introduction
Recently, considerable amount of attention in mobile com-puting has been given to fundamental technical and scien-tific issues that would support much needed transformation of healthcare from reactive and hospital-centered to preven-tive, proacpreven-tive, evidence-based, person-centered and focused on wellbeing rather than disease. The high degree of com-plexity and broad range of the problems require multidisci-plinary effort to identify and address barriers of understand-ing of quality of life, activity behavior, and other aspects of wellbeing. Fundamental technological advances also include research to understand the impediments that prevent people from engaging in health-promoting life styles including diet and exercise and from participating in their healthcare deci-sions. For example, in order to build long-term health and wellbeing, medical studies have suggested that walking is a perfect low-impact, aerobic exercise, and walking 30-60 min-utes daily will help lower blood pressure, manage weight, reduce risk of type II diabetes, and stay strong and fit.
How-ever, most individuals do not have a mechanism that could guide (or help push) them to conduct physical exercises. Av-erage amount of physical activities for each individual could be different and is not the focus of this study, but it will be extremely valuable to provide users a daily activity summary from their mobile phones. With this statistical summary (and optional recommendations), users may be encouraged to take the initiative and select a health-promoting life style.
Mobile phones have long been recognized as an ideal platform for pervasive computing. Using data collected from common phone embedded sensors such as GPS, cel-lular or WiFi radio, accelerometer, and/or digital compass, researchers have designed prototype mechanisms to enable users to understand statistical activity behaviors for their daily lives. However, there still exist considerable challenges, including data fusing of multiple sensor technologies, power consumptions, activity feature analysis, data sampling ratio, and classification methods. The goal of this research is to study the conditions and effectiveness of classifiers in or-der to precisely determine user activity mode using only ac-celerometer in commercial off-the-shelf phones. It applies the Gabor filter, for the first time, to the field of the activ-ity recognition. Then it evaluates the performance of this and several other classification methods using feature vec-tors and data sampling windows suggested in [1]. The re-search does not demand special environment (indoor or out-door) and phone usage or placement, nor does it rely on other sensor technologies or measurements such as location or biomedical signatures that may threat personal privacy. The result from this project will provide valuable informa-tion for researchers in the development of future intelligent activity awareness systems. As more people are becom-ing health-conscious in terms of lifestyle and physical ac-tivity, this research would provide a unique mechanism for health-promoting activities. These activities would support the much needed transformation of life patterns to preven-tive and wellbeing-centered rather than reacpreven-tive or medical-centered, and thus the research would improve the quality of life for the public [2, 3, 4, 5, 6].
2
Related Research
Much research has been carried out in order to obtain activ-ity statistics for a mobile user. As summarized by Consolvo
representative research has used either commercial products or experimental and customized devices for the activity de-termination process.
Experimental and customized devicesoffer the capability to experimentally combine multiple sensor technologies in order to obtain high resolution measurements and thus better performance. These sensor technologies could include GPS, accelerometer, cellular radios, WiFi signals, and even micro-phone. For example, Marmasse et al. [8] and Reddy at el. [2] used GPS and accelerometer to determine walking, run-ning, and driving. Similarly, Anderson et al. [9] and Sohn et al. [10] applied GSM and Mun et al. [11] combined GSM with Wifi for the classification purpose. The issue is that these mechanisms depend on GPS or the deployment of other radio technologies. Consequently, for indoor applications, these methods will not work correctly. In addition, power consumption is also an issue for mobile phone if GPS data has to be collected all the time. Researchers have reported that GPS consumes approximately 6 times more battery than GSM communication radios [12].
Other customized hardware such as barometer, biosensor, microphone, and special fitness sensing platform [6, 7, 13, 14] have also been adopted to classify human motion activi-ties. For example, Froehlich et al. [6] used signal strength from cellular towers to estimate user’s location and thus speed. Lester et al. [13] used accelerometer, audio, and baro-metric pressure to determine a user’s activity.
With customized hardware devices, researchers have also exploited different ways to fulfill user’s needs. For example, Sunget al. [15] attached multiple sensor devices to various places of a user, such as arms, waist, chest, ankles, and other places in order to particularly trace the user’s activity. On the contrary, Leeet al.[16] designed a smart home environment, with sensors attached to floors and walls, in order to capture footstep vibration signals and thus estimate user’s physical activity.
These experimental methods are usually very expensive. It is inconvenient and time consuming to deploy sensor devices (on human bodies or inside buildings) in order to particu-larly trace the activity information. Moreover, extra caution may be required in order to fully integrate involved hardware components. Consequently, they may not be applicable for general users.
Commercial devices, on the other hand, offer a simple method to capture data for further analysis. Earlier research has mainly focused on pedometer [7, 14] and related prod-ucts such as Fitbit [17] and GoWear Fit [18]. Pedometer is able to estimate step counts and traveled distance, and thus software systems may to developed estimate activity statis-tics. Typically, hardware devices require special operation mode such as orientation and positions on the body. For ex-ample, the device may be required to be worn on the upper arm or be placed in a sport wallet around the waist. Con-sequently, while research in this direction used widely avail-able commercial devices, they are not convenient because the closed form of the device would prevent direct usage of out-put information with advanced software systems. In other words, researchers may have to manually enter pedometer readings (i.e., step count and distance) into software system [7]. In addition, because of operational requirement (for ex-ample, orientation), these commercial devices may only pro-vide rough estimation of user’s activity, thus this method may not be valuable if fine grained information is necessary.
Recently, because of the fast-growing mobile phone in-dustry and particularly the Google introduced open-source Android mobile operating system, nearly all smart phones (including other customized mobile devices) are configured with Wi-Fi, BlueTooth, a digital camera, an accelerometer, a digital compass, and a popular mobile operating system in which custom applications can be run. Consequently, mo-bile phones have been recognizes as an ideal platform for pervasive computing. For example, the CenceMe project by Miluzzo et al. [3] used sensors (accelerometer, GPS, wireless radios including WiFi and BlueTooth, camera, and micro-phone) from mobile phones to enable users to share presence within a social network. And the FreeMobility project by Ji and Sproul [19] also used mobile phones (acceleromenter and cellular radios) to estimate user’s location.
Mobile phones have also been used in activity sensing. Earlier research, such as UbiFit [7], combined external sen-sors (for example, on-body sensing devices) with mobile phones to infer physical activity with daily lives, but lately, mobile phones have been used independently in activity recognition process. For example, Reddyet al.[2] have used embedded GPS and accelerometer from a mobile phone to es-timate user’s activity. However, GPS does not work indoors. Consequently, this project analyzes an effective method to determine a user’s activity statistics in both indoor and out-door environments, consequently we use only phone embed-ded accelerometer, i.e., it does not rely on any other sensors. Note that there are existing research activities that use phone-embedded accelerometer for activity estimation. For example, the work by Kwapisz et al. [20] analyzed ac-celerometer data collected from mobile phones placed in user’s front pant leg pocket. in addition, Sunet al. [21] and Henpraserttae et al. [22] conducted research with varying phone positions and orientations. This research is different from existing work in that: 1) we use an existing accelerom-eter sensor from a commercial off-the-shelf mobile phone, which presents a much lower sampling rate than sensors by previous research, 2) we evaluate the size of data window that is effective for the classification process, and 3) we also adapt one new classifier (i.e., Gabor filter (GBR)) in activity esti-mation process, and we compare the estiesti-mation performance with other existing classifiers such as support vector machine (SVM) [21], nearest neighbor (NN), and linear discriminant analysis (LDA) methods. In this research, we also do not restrict the phone positions and orientations.
3
Activity Analysis and Recognition
Framework
Activity
Samples FFTFilter
Feature Vectors
Realtime
Measurements FFTFilter
Classifier
walking
[image:3.595.56.275.54.241.2]jogging other activities ...
Figure 1.Recognition Framework
motion samples, for each activity category, at those represen-tative locations. These motion samples will then be used as base patterns in the classification process.
We typically put mobile phones in waist or arm phone-holders, hand bags, (jacket or pant) pockets, or even in hands. Certainly, a phone could be in a number of different orienta-tions, also the phone may change its orientation during an ac-tion, but still these orientations are very limited [21]. There-fore, a user will be able to collect a set of motion samples, according to his/her habits and routine life activities, and la-bel these samples accordingly.
Consequently, we design our activity recognition frame-work, as shown in Figure 1, as a two-phase recognition pro-cess.First, motion or activity sample collection phase, where motion samples will be collected at representative body loca-tions. These training samples will be labeled under different activity categories and feature vectors will be extracted ac-cordingly. The feature vectors include a set of key patterns that are unique to the associate activity and will be used as “standard” fingerprints in order to determine user’s activity. We will discuss feature vectors in next section. Second, ac-tivity recognition phase, where realtime measurements will be compared against base feature vectors and user’s activ-ity will be recorded and statistical results will be displayed. The “FFT filter” in Figure 1 is a filter that uses faster fourier transform to remove noises from activity signals.
4
Feature Vectors and Data Sampling
Windows
4.1
Feature Vectors
Common activity features, such as mean and standard de-viation, have been popularly adopted in previous research. Other features have also been proposed as well, for example, Kwapisz et al. [20] also used time between (neighboring) peaks, and binned distribution. Raviet al. [23] introduced energy and correlation. Reddyet al. [2] utilized energy and speed form GPS. And Sunet al. [21] applied correlation, energy and frequency-domain entropy.
“Time between peaks” [20] measures the average time be-tween three successive highest peaks. This feature could
−10 0 10 20 30
0 0.1 0.2 0.3
Acceleration along x axis (ax)
−10 0 10 20 30
0 0.1 0.2 0.3
Acceleration along y axis (ay)
−10 0 10 20 30
0 0.1 0.2 0.3 0.4 0.5
Probability of occurrences
Acceleration along z axis (az)
−10 0 10 20 30
0 0.1 0.2 0.3 0.4 0.5
[image:3.595.306.534.60.329.2]Maganitude of acceleration (|a|)
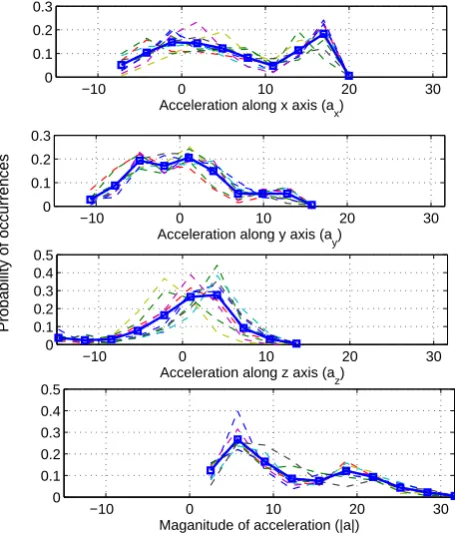
Figure 2.Probability of distribution for jogging
be valuable for certain activities such as jogging when clear repetitive activity pattern is available. However, we found that this time is not stable and could vary significantly be-cause of local optimal (minimal or maximal) values. “Corre-lation” [23, 21] is used to compare acceleration along a pair of same axes, when phone orientation changes, this correla-tion could generate false conclusion. Even if only the mag-nitude, which combines measurements from all three axes, is considered, signal synchronization may still be necessary for better pair-wise correlation comparison. “Binned distribu-tion” determines the fraction of instances that accelerometer measurements appear in a set of equal-sized bins within the value range. It was mentioned in [20] but the authors did not explain the usage of this feature.
Consequently, we followed the study in [1] and focus on five features: mean, standard deviation, range, signal energy, and probability of distribution, as given in Equation (1):
f eature=f(mean, standard deviation, range,
signal energy, angles) (1) For a given signal measurementf(t),Signal energyof an acceleration signalEabetween timeT1andT2is defined as:
Ea= t=T∑2
t=T1
|a(t)|2·∆t (2)
where∆tis the time between continuous measurement. Angles between the accelerometer vector (⃗a=ax⃗i+ay⃗j+ az⃗k) and an axis can be determined (for example,⃗x= 1⃗i+ 0⃗j+ 0⃗k) by the dot product of these two vectors:
θ=cos−1((⃗a)·(⃗x)
|⃗a| · |⃗x|) (3)
Note that the orientation of the device (phone) is usually dynamic during an activity. For example, we typically put mobile phones in a phone-wallet, pockets, or even in hands during an activity, the motion of the arm and the body may constantly change the phone orientations. But a user may still be able to collect a set of meaningful motion samples [21], according to his/her habits and routine life activities, and to label these samples accordingly.
4.2
Data Sampling Windows
Data sampling window determines the total amount of real-time data that will be used to compare with activity fea-tures in the classification process. Earlier research has sug-gested a small and fixed data window (such as 1.0 sec) [2], however, we believe that size of the data window does need to be dynamic because of its close relation to the data sampling rate. If a common sensor with a lower sampling rate has to be used (with most existing embedded sensors in phones, or with the consideration of data processing or data storage), a smaller data window will not be sufficient. Basically, there is not enough data to produce meaningful features that will be used to match an activity. We therefore vary the data sam-pling windows from 1 second to 5 seconds in experiments, and we evaluate its impact on the performance of common classifiers.
5
Classifiers
The objective of a classifier is to evaluate (real-time) mea-surements against base feature vectors and assign the activity to a known category. The difficulty of the classification de-pends on the variability in the feature values for objects in the same category relative to the difference between feature val-ues from other categories. The variability of feature valval-ues in the same category (say walking) may be the result of mea-surement noises and complexity of body activity. In general, a good classifier is able to minimize the difference among feature values from the same category while at the same time to maximize the feature variance between categories.
For the feature vector defined in Equation (1), a preferred classification output is exemplified in Figure 3. The two
10 12 14 16
20 22 24 26 28 30 32 34
jogging walking
20 30 40 50
4.5 5 5.5 6 6.5 7 7.5 8
jogging walking
Classification based on standard deviation and signal power
[image:4.595.322.538.59.243.2]Classification based on mean and range
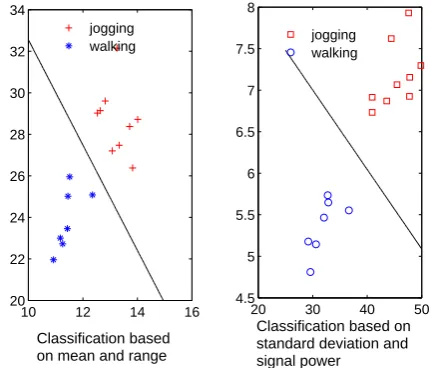
Figure 3.Feature Classification
sub-figures demonstrate clear differences between the two considered activities (i.e., jogging and walking) using four features. The left sub-figure was based mean and range
while the right sub-figure used standard deviation and sig-nal power.
5.1
Existing Classifiers
For many years, a lot of classic classifiers have been adopted and evaluated for activity recognition. Representa-tive classifiers may include
• Nearest Neighbors (NN), an instance-based learning technique that is based on closest training examples in the feature space [24]. This method computes the dis-tance or similarity between each test sample (measured features)fand all training samples (i.e., “standard” fea-ture fingerprints) D to determine its nearest-neighbor list Df. Accordingly, test sample may be classified based on rules such as the majority class of its nearest neighbors:
activity=V oting
| {z }(fi∈Df) (4)
• Support Vector Machine (SVM), a supervised learning method to distinguish feature categories in a hyperplane with a clear gap [21, 25]. An example of the support Vector Machine is given in Figure 3, where the straight line in the sub-figure shows the boundary of two classes. If the line is given by
f(x) =w·x−b (5)
thenf(x)would determine the classification result. If we assume a secure margin, say “1”, for decision pro-cess, then f(x) ≥ 1 would mean that the considered test sample belongs to the class above the line. Conse-quently, the optimization would become:
minimize(w, b), subject to f(xi)≥1, i= 1, ..., n
• Linear Discriminant Analysis (LDA), by Ronald A. Fisher, is a method to find a linear combination of fea-tures which characterizes or separates two ore more classes of objects [26]. Ifµiandsirepresent mean and variance of a feature classDfi, for two feature classes, Fisher’s linear discriminant is to maximize the criterion function:
J = |µ1−µ2| 2 s2
1−s22
(7)
• Others classifiers such as K-Mean Clustering [2, 23], Decision Table/Trees (C4.5 or J48) [23, 20], Neural Net-works [27, 20], and Hidden Markov Model which as-sumes the knowledge of the underlying density function [2].
In this work, we adapted Gabor filter [28, 29], a traditional image processing method for edge detection and feature ex-traction, for activity recognition.
5.2
Gabor Filter (GBR)
Gabor filter was named after Dennis Gabor, the Nobel Prize winner of Physics in 1972. It can be modeled as:
Gλ,θ,ψ,σ,γ(x, y) =exp(−x
′2+γ2y′2
2σ2 )cos(2π x′
λ +ψ) (8)
wherex′ = xcosθ+ysinθ andy′ = −xsinθ+ycosθ,λ
represents the wavelength of the sinusoidal factor, θ is the orientation of the normal to the parallel stripes of a Gabor function,ψis the phase offset,σis the sigma of the Gaussian envelope, andγis the spatial aspect ratio.
Gabor filter has a unique property to identify differences along the boundary between two (image) objects with mini-mal uncertainty.
In this study, we applied the Gabor filter to a pair of fea-ture vectors. A comparison study using jogging and walk-ing is given in Figure 4. In the figure, the x axis gives two continuous activity instances, jogging on the left (<10sec) and walking on the right(>10sec), y axis shows the Gabor outputs for four considered features. It can be seen that the Gabor filter is able to distinguish the changes between the two activities. It is obvious that feature values for different activities could exhibit a natural difference by themselves, for example, signal power values for jogging and walking are different. However, most feature values (such asmean,
standard deviation, andrange) between many activities may not demonstrate a clear variance. Consequently, Gabor filter could be a good candidate classifier for the activity recogni-tion.
We will compare the classification performance from Ga-bor filter (GBR) with three other representative classifiers, in-cluding: Nearest Neighbors (NN), Support Vector Machines (SVM), and Linear Discriminant Analysis (LDA).
6
Experiments and Results
6.1
Considered Activities
Many activities could be considered with phone embed-ded accelerometer, and in order to evaluate proposed Gabor and other classifiers, this study particularly considered the following major activities: walking, jogging, climbing stairs
3 4 5 6 7 8 9 10 11 12 13 14 15 16 17 1
1.5 2 2.5 3 3.5 4 4.5 5 5.5
A pair of feature vectors after Gabor filter
Feature variance
mean range
[image:5.595.305.522.63.258.2]stadard deviation signal power
Figure 4.Gabor filter for activity classification
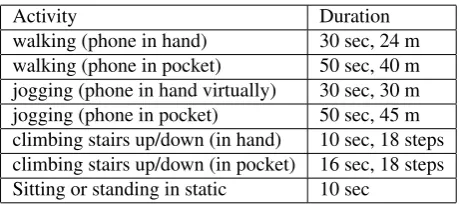
Table 1.Activity Data Collection
Activity Duration
walking (phone in hand) 30 sec, 24 m walking (phone in pocket) 50 sec, 40 m jogging (phone in hand virtually) 30 sec, 30 m jogging (phone in pocket) 50 sec, 45 m climbing stairs up/down (in hand) 10 sec, 18 steps climbing stairs up/down (in pocket) 16 sec, 18 steps Sitting or standing in static 10 sec
(both up and down), and sitting or standing in static (i.e., without motion). With each activity, users may either hold phones in hand or place the phones in a pocket. When a user holds a mobile phone in hand during an activity, the phone is typically facing up and points to the user’s moving direction. For example, the user may read or send text message, watch-ing a video clip, or simply check time while havwatch-ing a walk. If the user determines to place the phone to his/her pocket, then no specific orientation would be assumed in this study.
6.2
Collection and Processing of Activity
Sam-ples
All considered activities were performed in multiple rounds over a period of two academic semesters (from Fall 2012 to Spring 2013), where more than 100 samples have been collected for each considered activity. Table 1 gives collection details for all training samples used in this study.
As illustrated in Figure 1, all activity data were processed by a FFT filter in order to remove noise signals from the real activity. In addition, in order to minimize potential interfer-ence from human operations, for all training samples, we ne-glect a portion of data from all samples, roughly 10 seconds each at the beginning and the end of the measurements. We expect that feature vectors extracted from training samples will better represent the activity for the experimental subject.
6.3
Software and Hardware used in the Study
[image:5.595.302.532.320.422.2]Table 2.Feature Combination
Option Combination Option Combination
1 [1 0 0 0 0] 4 [1 0 1 1 0]
2 [1 1 0 0 0] 5 [1 1 0 1 0]
3 [1 0 0 0 1]
50% 60% 70% 80% 90% 100%
1 2 3 4 5 1 2 3 4 5 1 2 3 4 5 1 2 3 4 5 1 2 3 4 5
Option1 Option2 Option3 Option4 Option5 NN
Figure 5.NN classification using different feature vectors and time windows
phone has a maximum data sampling rate of 20 Hz (or 0.05s per data sample). In addition, a sportline GoWalking digi-tal stopwatch was used to measure time during the collection of training samples. To display and collect sensor data from embedded sensor (i.e., accelerometer), this study used An-droSensor (version 1.9.4.3), which is a free and all-in-one diagnostic tool for Android systems [30]. For each activ-ity, AndroSensor recorded sensor data and exported it to a comma-separated values (CSV) file, this plain text file was saved in a SD card for further processing.
6.4
Feature Combinations
As suggested in [1], for five total features ([|a|,|ax|,|ay|,|az|, angle]) considered in this study
(see Equation 1), we will particularly focus on five different combinations indicated in Table 2. |a| is the magnitude of accelerometer and “|ax|,|ay|,|az|” are accelerometer
components in three axes. Each of which accelerometer categories includes mean, range, signal power, and standard deviation. The “angles” feature includes the mean, stan-dard deviation, and range of all three angles betweem the accelerometer vector and three axes.
7
Evaluation Results
With proposed feature vectors and data sampling windows, a complete set of evaluation results are given in Figures 5, 6, 7, and 8. These results are the combination of all experiments using all considered activities. In all figures, the x axes rep-resent the size of data sampling window (in seconds) at each
50% 60% 70% 80% 90% 100%
1 2 3 4 5 1 2 3 4 5 1 2 3 4 5 1 2 3 4 5 1 2 3 4 5
Option1 Option2 Option3 Option4 Option5
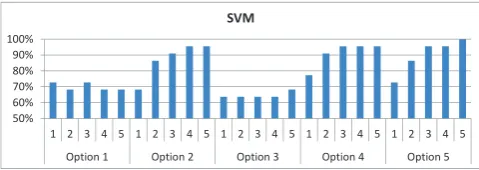
[image:6.595.59.301.69.222.2]SVM
Figure 6.SVM classification using different feature vectors and time win-dows
50% 60% 70% 80% 90% 100%
1 2 3 4 5 1 2 3 4 5 1 2 3 4 5 1 2 3 4 5 1 2 3 4 5
Option1 Option2 Option3 Option4 Option5
[image:6.595.313.557.197.284.2]LDA
Figure 7. LDA classification using different feature vectors and time win-dows
50% 60% 70% 80% 90% 100%
1 2 3 4 5 1 2 3 4 5 1 2 3 4 5 1 2 3 4 5 1 2 3 4 5
Option1 Option2 Option3 Option4 Option5
GBR
Figure 8. GBR classification using different feature vectors and time win-dows
corresponding feature options, the y axes show the classifica-tion accuracy (in percentage of all more than 100 test cases for all activities). As readers can see, the method of support vector machine (SVM) delivers slightly worse classification results; on the contrary, the methods of Gabor (GBR), near-est neighbors (NN), and linear discriminant analysis (LDA) present the better classification results (Figure 5 and 7).
For all considered feature vectors, the options of 1 and 3 appear to be less effective to capture key properties of con-sidered activities. As a result, all three classifiers (SVM, NN, and GBR) demonstrate a worse classification results under these feature options. This appears to suggest that: 1) the magnitude feature of accelerometer by itself is not sufficient for activity recognition, and 2) the angle feature does not contribute to the classification process. The reason could be because human body (and thus the phone orientation) is dy-namic during activities, and therefore the angle information does not characterize well the differences among different ac-tivities.
Although earlier research (including [2]) has suggested that a small and fixed data window (such as 1.0 sec) is suf-ficient for activity recognition purpose, research results here do recommend a slight larger data window. As we have ad-dressed earlier, the size of data window is closely related to the sensor’s data sampling rate, and so with different sensor technology, this data window size should be dynamic.
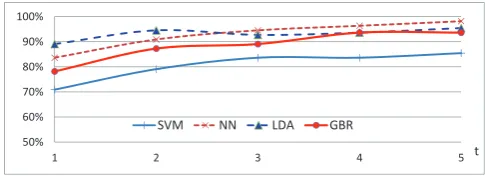
[image:6.595.59.299.683.768.2]50% 60% 70% 80% 90% 100%
1 2 3 4 5 t
[image:7.595.43.286.54.144.2]SVM NN LDA GBR
Figure 9.Average classification performance for all feature vectors
3.0 sec.
Research results from Figure 9 clearly indicates that a large data window helps the recognition accuracy for all consid-ered methods. This suggests that data sampling rate is a key factor in activity recognition. The applied Samsung phone in the study is an old model (SCH-1500, 2010) and the en-closed sensors may not be ideal for the purpose of activity recognition.
8
Conclusion
In this research, we adapted the Gabor filter in the field of activity recognition. Using a commercial off-the-shelf phone device that has a maximum data sampling rate of only 20 Hz, this research collected data various activities (with dif-ferent phone position combinations) over the period of two academic semesters (from fall 2012 to spring 2013), experi-mental results proved that the Gabor filter is effective in ac-tivity classification, and it delivers over 90% accuracy when the data sampling window is lgreater than 3.0 seconds.
This research also compared the Gabor filter with three other existing classifiers (including nearest neighbors (NN), linear discriminant analysis (LDA), and support vector ma-chines (SVM)), the results show that the Gabor filter works similar to NN and LDA, and it performs much better than SVM.
Evaluation results suggested that the angle feature is not effective in the classification process, the reason could be be-cause the phone device is dynamic during activities and thus phone orientation (and thus angle information) do not dis-tinguish well among different activities. In addition, research also showed that the magnitude alone is not a good feature. In stead, it should be combined with at least another accelerom-eter component along an axis.
Moreover, this research also suggested that a larger data sampling window is necessary when ordinary sensors (with lower data sampling rate) are used in activity recognition sys-tems. For the sensor used in this study (with 20 Hz maximum sampling rate), the effective data window should be 3.0 sec-onds. Future study will evaluate the impact of data sampling rate on the performance of activity recognition, and different sensors (with various sampling rates) will be used in experi-mental studies.
This research did not study complex (or composite) activ-ities, which usually include a set of continuous motions with dynamic but very short durations. For example, basketball playing may include simple activities such as running, jump-ing, dribbljump-ing, passjump-ing, blockjump-ing, and shooting. The features and required data sampling windows for these activities could be very different from simple activities included in this paper. Future research will focus on them in detail.
Acknowledgements
This material is based upon work supported by the Na-tional Science Foundation/EPSCoR under Grant No. EPS-0903795, the National Science Foundation/NeTS Grant No. CN0916012, and the National Science Foundation S-STEM grant No. 1259283.
REFERENCES
[1] Y. Ji and L. Fair, Sensor feature analysis - a study of mobile activity awareness for smart health and well being, in the 2013 International Conference on Electrical Engineering and Com-puter Science (EECS), Dec. 2013.
[2] S. Reddy, M. Mun, J. Burke, D. Estrin, M. Hansen, and M. Srivastava, Using mobile phones to determine transportation modes, ACM Trans. Sen. Netw., vol. 6, no. 2, pp. 13:113:27, Mar. 2010. [Online]. Available: http://doi.acm.org/10.1145/1689239.1689243.
[3] E. Miluzzo, N. D. Lane, K. Fodor, R. Peterson, H. Lu, M. Musolesi, S. B. Eisenman, X. Zheng, and A. T. Camp-bell, Sensing meets mobile social networks: the design, implementation and evaluation of the cenceme application, in Proceedings of the 6th ACM conference on Embed-ded network sensor systems, ser. SenSys 08. New York, NY, USA: ACM, 2008, pp. 337-350. [Online]. Available: http://doi.acm.org/10.1145/1460412.1460445.
[4] S. Consolvo, P. Klasnja, D. W. McDonald, D. Avra-hami, J. Froehlich, L. LeGrand, R. Libby, K. Mosher, and J. A. Landay, Flowers or a robot army?: encour-aging awareness and activity with personal, mobile dis-plays, in Proceedings of the 10th international conference on Ubiquitous computing, ser. UbiComp 08. New York, NY, USA: ACM, 2008, pp. 54-63. [Online]. Available: http://doi.acm.org/10.1145/1409635.1409644.
[5] M. Mun, S. Reddy, K. Shilton, N. Yau, J. Burke, D. Estrin, M. Hansen, E. Howard, R. West, and P. Boda, Peir, the personal environmental impact report, as a plat-form for participatory sensing systems research, in Pro-ceedings of the 7th international conference on Mobile sys-tems, applications, and services, ser. MobiSys 09. New York, NY, USA: ACM, 2009, pp. 55-68. [Online]. Available: http://doi.acm.org/10.1145/1555816.1555823.
[6] J. Froehlich, T. Dillahunt, P. Klasnja, J. Mankoff, S. Consolvo, B. Harrison, and J. A. L, Ubigreen: Investigating a mobile tool for tracking and supporting green transportation habits, 2009.
[7] S. Consolvo, D. W. McDonald, T. Toscos, M. Y. Chen, J. Froehlich, B. Harrison, P. Klasnja, A. LaMarca, L. LeGrand, R. Libby, I. Smith, and J. A. Landay, Activity sensing in the wild: a field trial of ubifit garden, in Proceed-ings of the twenty-sixth annual SIGCHI conference on Hu-man factors in computing systems, ser. CHI 08. New York, NY, USA: ACM, 2008, pp. 1797-1806. [Online]. Available: http://doi.acm.org/10.1145/1357054.1357335.
[8] N. Marmasse, C. Schmandt, and D. Spectre, Watchme: Com-munication and awareness between members of a closely-knit group, 2004, pp. 214-231.
[10] T. Sohn, A. Varshavsky, A. LaMarca, M. Y. Chen, T. Choud-hury, I. Smith, S. Consolvo, J. Hightower, W. G. Gris-wold, and E. de Lara, Mobility detection using everyday gsm traces, in Proceedings of the 8th international conference on Ubiquitous Computing, ser. UbiComp06. Berlin, Heidel-berg: SpringerVerlag, 2006, pp. 212-224. [Online]. Available: http://dx.doi.org/10.1007/11853565 13.
[11] M. Y. Mun, D. Estrin, J. Burke, and M. Hansen, Parsimonious mobility classification using gsm and wifi traces. hot-emnets, in Proceedings of the 5th Workshop on Embedded Networked Sensors (HotEmNets)., 2008.
[12] I. Constandache, S. Gaonkar, M. Sayler, R. Choudhury, and L. Cox, Enloc: Energy-efficient localization for mobile phones, in INFOCOM 2009, IEEE, 2009, pp. 2716-2720.
[13] J. Lester, T. Choudhury, and G. Borriello, A practi-cal approach to recognizing physipracti-cal activities, in Pro-ceedings of the 4th international conference on Per-vasive Computing, ser. PERVASIVE06. Berlin, Heidel-berg: Springer-Verlag, 2006, pp. 1-16. [Online]. Available: http://dx.doi.org/10.1007/11748625 1.
[14] S. Crouter, P. Schneider, M. Karabulut, and D. J. Bassett, Validity of 10 electronic pedometers for measuring steps, distance, and energy cost. in Med Sci Sports Exerc., 2003. [Online]. Available: http://www.ncbi.nlm.nih.gov/pubmed/12900704.
[15] M. Sung, C. Marci, , and A. Pentland, Wearable feed-back systems for rehabilitation, in Journal of Neuro- En-gineering and Rehabilitation, 2005. [Online]. Available: http://www.jneuroengrehab.com/content/2/1/17.
[16] H. Lee, J. W. Park, and A. Helal, Estimation of in-door physical activity level based on footstep vibration sig-nal measured by mems accelerometer in smart home en-vironments, in Proceedings of the 2nd international con-ference on Mobile entity localization and tracking in GPS-less environments, ser. MELT09. Berlin, Heidelberg: Springer- Verlag, 2009, pp. 148-162. [Online]. Available: http://dl.acm.org/citation.cfm?id=1813141.1813155.
[17] Fitbit. [Online]. Available:
http://www.fitbit.com/product/features#activity.
[18] BodiaMedia. [Online]. Available:
http://www.bodymedia.com/Learn-More/What-is-BodyMedia-FIT.
[19] Y. Ji, G. Sproul, and S. Biaz., FreeMobility: Dynamic Lo-calization using GIS, in IEEE Wireless Communications and Networking Conference (WCNC08), Las Vegas, USA, March 31-April 3 2008.
[20] J. R. Kwapisz, G. M. Weiss, and S. A. Moore, Activity recognition using cell phone accelerometers, SIGKDD Ex-plor. Newsl., vol. 12, no. 2, pp. 7482, Mar. 2011. [Online]. Available: http://doi.acm.org/10.1145/1964897.1964918.
[21] L. Sun, D. Zhang, B. Li, B. Guo, and S. Li, Activity recognition on an accelerometer embedded mobile phone with varying positions and orientations, in Proceedings of the 7th international conference on Ubiquitous intel-ligence and computing, ser. UIC10. Berlin, Heidelberg: SpringerVerlag, 2010, pp. 548-562. [Online]. Available: http://dl.acm.org/citation.cfm?id=1929661.1929712.
[22] A. Henpraserttae, S. Thiemjarus, and S. Marukatat, Accurate activity recognition using a mobile phone regardless of device orientation and location, in Body Sensor Networks (BSN), 2011 International Conference on, 2011, pp. 41-46.
[23] N. Ravi, N. Dandekar, P. Mysore, and M. L. Littman, Activity recognition from accelerometer data, in Pro-ceedings of the 17th conference on Innovative applica-tions of artificial intelligence Volume 3, ser. IAAI05. AAAI Press, 2005, pp. 1541-1546. [Online]. Available: http://dl.acm.org/citation.cfm?id=1620092.1620107.
[24] P.-N. Tan, M. Steinbach, and V. Kumar, Introduction to Data Mining. Pearson Addison Wesley, ISBN: 0321321367, 2006.
[25] R. O. Duda, P. E. Hart, and D. G. Stork, Pattern Classification. Wiley, ISBN: 0471056693, 2001.
[26] R. Fisher, The use of multiple measurements in taxonomic problems, Annals Eugen, pp. 179-188, 1936.
[27] C. Randell and H. Muller, Context awareness by an-alyzing accelerometer data, in Proceedings of the 4th IEEE International Symposium on Wearable Com-puters, ser. ISWC 00. Washington, DC, USA: IEEE Computer Society, 2000, pp. 175. [Online]. Available: http://dl.acm.org/citation.cfm?id=851037.856514.
[28] Y. Ji, K. H. Chang, and C.-C. Hung, Efficient edge detection and object segmentation using gabor filters, in Proceedings of the 42nd annual Southeast regional conference, ser. ACM-SE 42. New York, NY, USA: ACM, 2004, pp. 454-459. [Online]. Available: http://doi.acm.org/10.1145/986537.986651.
[29] J. G. Daugman, Complete discrete 2d gabor transform by neural networks for image analysis and compression, IEEE Transaction on Acoustics, Speech, and Signal Processing, vol. 36, no. 7, pp. 1169-1179, 1988. [Online]. Available: http://citeseer.nj.nec.com/context/16741/0.