2019 International Conference on Computational Modeling, Simulation and Optimization (CMSO 2019) ISBN: 978-1-60595-659-6
Topological Connectivity Analysis on Freight Transportation Networks
Xi-sheng SHEN
1, Xiao-fang WANG
2,*, Lian-yi ZHANG
3and Xi-fu WANG
11School of Traffic and Transportation, Beijing Jiaotong University, Beijing 100044, China
2School of Business, Renmin University of China, Beijing 100872, China
3Science and Technology on Space System Simulation Laboratory, Beijing Simulation Center,
Beijing 100854, China *Corresponding author
Keywords: Topological connectivity, Degree distribution, Betweenness, Freight transportation networks.
Abstract. The connections between nodes in Freight Transportation Networks (FTNs) are highly complex. With the topological modelling of real world FTNs, this paper introduces quantitative indicators, such as degree distribution and edge/node betweenness centrality, to analyze the topological connectivity. The exponential laws of degree distribution and edge/node betweenness centrality are shown by numerical results on the coal transportation network in Shanxi, China.
Introduction
Freight transportation networks (FTNs) consists of a mass of nodes (i.e., demanders, providers, railway stations, highway transport hubs and ports et al), and the connections between nodes are seriously complex. Because there are many kinds of transportation, such as railways, waterways, highways et al, and goods are distributed from origins to destinations, going through different types of nodes and transport ways. Thus, it is very important to reveal the topological connectivity and its strength of FTNs, since properties such as robustness against damages are nontrivial consequences of their topological structure.
Recently, research on topological structure of complex networks has focused on many areas, such as electric power grids, social networks, biological networks, urban traffic networks, maritime freight networks and airline networks. Crucitti et al [1] and Albert et al [2] investigate the topological properties of electric power grid, and the structural vulnerability of the Italian GRTN power grid and the North American power grid respectively. Chasman and Siahpirani et al [3] consider complex biological systems of cellular function under changing environmental conditions and propose network-based computational approaches to gain a global understanding of cellular function under changing environmental conditions. Andrade and Espindola et al [4] apply complex networks indexes to the topologies to reveal structural patterns of interactions between marine plankton organisms. Atay and Koc et al [5] analyze community detection from biological and social networks by several methods containing a modularity optimization approach. For a complex weighted network of travel routes on the Singapore rail and bus transportation systems, Soh and Lim et al [6] show that the dynamical associativity of the bus networks differ from its topological counterpart. D’Lima and Medda [7] propose a quantitative measure of resilience using a mean-reverting stochastic model and apply this model to the case of the London Underground. Fremont [8] presents a number of different strategies for linking the different regions of the world and study the route structure, port situation and development trend of Maersk's shipping network. Lee and Choo [9] present a bi-level modeling approach for capturing hierarchical relationships among major carriers and finding carrier decision-making processes in maritime freight networks.
transportation network in Shanxi, China are given to testify the exponential laws of degree distribution and edge/node betweenness centrality.
Topological Model of Freight Transportation Networks
In this section, we model the topological networks of real world FTNs by graph theory. There are many kinds of nodes in FTNs, such as demanders, providers, highway transport hubs, railway stations and ports et al. They are denoted by 𝑣𝑖s, and the collection of these nodes is 𝑉 = {𝑣1, 𝑣2, … , 𝑣𝑛}.
The connections between nodes in FTNs are highly complex, such as railways, highways, waterways and other means of transportation. As shown in Fig.1, the travelling of goods from the origin to the destination, generally needs to go through different types of nodes and the coordination among different transport ways. Let 𝑒𝑖𝑗 be the connection between nodes 𝑣𝑖 and 𝑣𝑗. The collection of these edges is 𝐸 = {𝑒𝑖𝑗| There is an edge between the pair of nodes (𝑣𝑖, 𝑣𝑗) ∈ 𝑉 × 𝑉, 𝑖 ≠ 𝑗}.
Origin Port Port Destination
Railway station
Highway Waterway Railway Highway
Figure 1. The travelling of goods from the origin to the destination.
Weight 𝑤𝑖𝑗 of an edge 𝑒𝑖𝑗 represents the attributes of transportation between the pair of nodes
(𝑣𝑖, 𝑣𝑗), such as mileage, vehicle speed, passing capacity, shipping cost and delivery time et al. For
simplicity, this paper only considers the mileage attribute. The collection of weights is denoted by
𝑊 = {𝑤𝑖𝑗|𝑒𝑖𝑗∈ 𝐸}. Thus, FTNs can be modelled as a graph 𝐺 = (𝑉, 𝐸, 𝑊). Let 𝑛 × 𝑛 matrix 𝐴 be the adjacency matrix of the graph 𝐺, with elements 𝑎𝑖𝑗= 1 only if there is some ways of transportation
between the pair of nodes (𝑣𝑖, 𝑣𝑗), otherwise 𝑎𝑖𝑗 = 0. If the graph 𝐺 is undirected, the existence of a link implies that 𝑎𝑖𝑗= 𝑎𝑗𝑖, and the adjacency matrix 𝐴 = 𝐴𝑇 is a real symmetric matrix. It is assumed that the graph 𝐺 does not contain self-loops, that is, 𝑎𝑖𝑖 = 0.
Topological Connectivity Indicators
In this section, we introduce some quantitative indicators to analyze the topological connectivity of FTNs, including degree distribution and betweenness centrality as follows.
Degree Distribution. For a node in the FTN, the number of its links with other nodes is its basic structural property, since the larger the number is, the more important the node is in the sense of topological structure. We can analyze the topological connectivity of FTNs by the number of these links between its nodes. For a node 𝑣𝑖 ∈ 𝑉, the total number of its adjacent edges is called its degree
𝑘𝑖, that is, 𝑘𝑖 = ∑𝑛𝑗=1𝑎𝑖𝑗. And the average of all node degrees is called the average degree < 𝑘 >,
which is equal to ∑𝑛𝑖=1𝑘𝑖/𝑛. The probability that a randomly selected node has exactly 𝑘 adjacent edges is called degree distribution function 𝑝(𝑘), which can be evaluated by the fraction of nodes in the FTN that have degree 𝑘, that is, 𝑝(𝑘) = 𝑛𝑘/𝑛, where 𝑛𝑘 is the number of nodes with degree 𝑘. In order to reduce the statistical fluctuation, we can use the cumulative degree distribution function 𝑃(𝑘) instead, which is defined by the probability that the degree is greater than or equal to 𝑘,
𝑃(𝑘) = ∑ 𝑝(𝑙)
𝑙≥𝑘
.
For an edge 𝑒𝑖𝑗∈ 𝐸, the fraction of shortest paths that pass through 𝑒𝑖𝑗 is called edge betweenness centrality 𝐵e(𝑒𝑖𝑗), that is, 𝐵e(𝑒𝑖𝑗) = ∑𝑘≠𝑙∈𝑉𝜎𝑘𝑙(𝑒𝑖𝑗)/𝜎𝑘𝑙, where 𝜎𝑘𝑙 is the total number of shortest paths from node 𝑘 to node 𝑙, and 𝜎𝑘𝑙(𝑒𝑖𝑗) is the number of those shortest paths that pass through 𝑒𝑖𝑗.
The probability that the betweenness centrality of a randomly selected edge is greater than or equal to
𝑏, is called cumulative edge-betweenness distribution function 𝑃e(𝑏), which can be calculated by the
fraction of the number of 𝐵e(𝑒𝑖𝑗) ≥ 𝑏,
𝑃e(𝑏) = 𝑚e(𝑏) 𝑚e ,
where 𝑚e is the number of all 𝐵e(𝑒𝑖𝑗), and 𝑚e(𝑏) is the number of 𝐵e(𝑒𝑖𝑗) ≥ 𝑏.
Similarly, for a node 𝑣𝑖∈ 𝑉, the fraction of shortest paths that pass through 𝑣𝑖 is called node betweenness centrality 𝐵n(𝑣𝑖), that is, 𝐵n(𝑣𝑖) = ∑𝑘≠𝑙∈𝑉𝜎𝑘𝑙(𝑣𝑖)/𝜎𝑘𝑙, where 𝜎𝑘𝑙(𝑣𝑖) is the number of those shortest paths that pass through 𝑣𝑖. The cumulative node-betweenness distribution function
𝑃n(𝑏) is
𝑃n(𝑏) =
𝑚n(𝑏)
𝑚n ,
where 𝑚n is the number of all 𝐵n(𝑣𝑖), and 𝑚n(𝑏) is the number of 𝐵n(𝑣𝑖) ≥ 𝑏.
Numerical Results
In this section, numerical results are presented to illustrate the effectiveness of the introduced quantitative indicators to evaluate the topological connectivity of FTNs. We conduct numerical experiments by R based on the data of the coal transportation network in Shanxi, China (CTNS) [10]. We first investigate the topological connectivity of the CTNS by its cumulative degree distribution
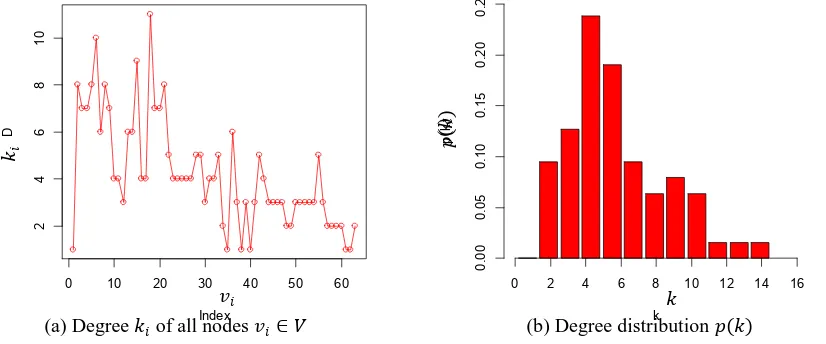
𝑃(𝑘). The degree 𝑘𝑖 for all nodes and the degree distribution 𝑝(𝑘) are shown in Fig.2. The average
degree < 𝑘 >= 4.22. Fig.2 (b) shown that the degree distribution 𝑝(𝑘) contains a single peak at value < 𝑘 > and declines sharply away from the peak value.
[image:3.595.98.511.475.647.2]
(a) Degree 𝑘𝑖 of all nodes 𝑣𝑖∈ 𝑉 (b) Degree distribution 𝑝(𝑘)
Figure 2. Degree 𝑘𝑖 and degree distribution function 𝑝(𝑘) for the CTNS.
The cumulative degree distribution 𝑃(𝑘) for the CTNS are shown in Fig.3 in the single/double logarithmic coordinates. Fig.3 (a) shows that in the linear-log plot, the cumulative degree distribution falls on a straight line nearly. This indicates that the cumulative degree distribution decreases exponentially, since the full line is an exponential fit to the data. In contrast, Fig.3 (b) shows that in the log-log plot, the cumulative degree distribution rejects to fall on a straight line, which is a power law fit to the data, and the tail of the cumulative degree distribution decreases even faster than a power law would. The cumulative degree distribution for the CTNS satisfies an exponential law rather than a power law, that is, 𝑃(𝑘) ∝ 𝑒−𝜆𝑘, where 𝜆 is the scaling exponent. Thus, the CTNS is a single scale network and the scaling exponent is 𝜆 ≈ 0.386.
0 10 20 30 40 50 60
2
4
6
8
10
Index
D
𝑣𝑖
𝑘𝑖
k
p
k
0.00
0.05
0.10
0.15
0.20
0.25
0 2 4 6 8 10 12 14 16 𝑘
𝑝(
[image:4.595.90.505.75.249.2]
(a) Linear-log plot of 𝑃(𝑘) (b) Log-log plot of 𝑃(𝑘)
Figure 3. The cumulative degree distribution 𝑃(𝑘) for the CTNS in the single/double logarithmic coordinates.
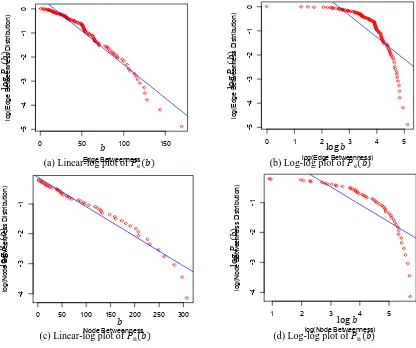
Next, we study the property of the connectivity strength of the CTNS by its edge/node betweenness distribution. The cumulative edge/node-betweenness distribution 𝑃e(𝑏) and 𝑃n(𝑏) for the CTNS are shown in Fig.4. Fig.4 (a) and (c) show that in the linear-log plot, the cumulative edge/node-betweenness distributions scatter around a straight line. That is, both the cumulative edge/node-betweenness distributions seem to decay exponentially. On the contrary, Fig.4 (b) and (d) show that in the log-log plot, the cumulative edge/node-betweenness distributions deviate significantly from a power law one, and their tails appear to decay faster than a power law would. Thus, the cumulative edge/node-betweenness distribution for the CTNS also satisfy an exponential law rather than a power law. For the CTNS, the edge/node scaling exponents are 𝜆e ≈ 0.028 and
𝜆n ≈ 0.010.
(a) Linear-log plot of 𝑃e(𝑏) (b) Log-log plot of 𝑃e(𝑏)
(c) Linear-log plot of 𝑃n(𝑏) (d) Log-log plot of 𝑃n(𝑏)
Figure 4. The cumulative edge/node-betweenness distribution 𝑃e(𝑏) and 𝑃n(𝑏) for the
CTNS in the single/double logarithmic coordinates.
2 4 6 8 10 12
-4 -3 -2 -1 0 k log P(k) 𝑘 log 𝑃 (𝑘 ) log 𝑃 (𝑘 )
0.0 0.5 1.0 1.5 2.0 2.5
-4
-3
-2
-1
0
节点的度D
累
积度分布
log
(DFC)
log 𝑘
0 50 100 150
-5 -4 -3 -2 -1 0 Edge Betweenness log (Edg e Be twee nn ess Distri bu tion ) 𝑏 log 𝑃e (𝑏 )
0 1 2 3 4 5
-5 -4 -3 -2 -1 0 log(Edge Betweenness) log (Edg e Be twee nn ess Distri bu tion ) log 𝑏 log 𝑃e (𝑏 )
0 50 100 150 200 250 300
-4 -3 -2 -1 Node Betweenness log (Nod e Be twee nn ess Distri bu tion ) 𝑏 log 𝑃n (𝑏 )
1 2 3 4 5
[image:4.595.90.506.415.763.2]Conclusion
In this paper, we investigate the topological connectivity for FTNs on the base of the topological modelling. Quantitative indicators, such as degree distribution and edge/node-betweenness centrality, are introduced. Numerical results on the coal transportation network in Shanxi, China are given to show that: (i) The cumulative degree distribution for the CTNS satisfies an exponential law rather than a power law with the scaling exponent 𝜆 ≈ 0.386, and the CTNS is a single scale network. (ii) The cumulative edge/node-betweenness distribution for the CTNS also satisfy an exponential law rather than a power law, with the edge/node scaling exponents 𝜆e ≈ 0.028 and 𝜆n ≈ 0.010.
Acknowledgement
Xiao-fang Wang is the corresponding author. This work was supported in part by the following grants: National key R&D program of China No. 2017YFC0820100.
References
[1] P. Crucitti, V. Latora, M. Marchiori. A topological analysis of the Italian electric power grid. Physica A, 2004, 338(1-2): 92-97.
[2] R. Albert, I. Albert, G. L. Nakarado. Structural vulnerability of the North American power grid. Physical Review E, 2004, 69(2): 025103(R).
[3] D. Chasman, A. F. Siahpirani, S. Roy. Network-based approaches for analysis of complex biological systems. Current Opinion in Biotechnology, 2016, 39: 157-166.
[4] L. P. Andrade, R. P. Espindola, G. C. Pereira, et al. Exploring complex networks in the plankton. IEEE Latin America Transactions, 2016, 14(8): 3838-3846.
[5] Y. Atay, I. Koc, I. Babaoglu, et al. Community detection from biological and social networks: A comparative analysis of metaheuristic algorithms. Applied Soft Computing, 2017, 50: 194-211.
[6] H. Soh, S. Lim, T. Zhang, et al. Weighted complex network analysis of travel routes on the Singapore public transportation system. Physica A: Statistical Mechanics and its Applications, 2010, 389(24): 5852-5863.
[7] M. D’Lima, F. Medda. A new measure of resilience: An application to the London underground. Transportation Research Part A, 2015, 81: 35-46.
[8] A. Fremont. Global maritime networks: The case of Maersk. Journal of Transport Geography, 2007, 15(6): 0-442.
[9] H. Lee, S. Choo. Optimal decision making process of transportation service providers in maritime freight networks. Ksce Journal of Civil Engineering, 2016, 20(2): 922-932.