2017 2nd International Conference on Software, Multimedia and Communication Engineering (SMCE 2017) ISBN: 978-1-60595-458-5
A Tag-based Recommendation Algorithm Integrating
Short-term and Long-term Interests of Users
Rui LI and Xin ZHANG
*School of Information Science and Engineering, Hunan University, Changsha, 410082 China
*Corresponding author
Keywords: Tag-based, Recommendation algorithm, Interests of users.
Abstract. In the collaborative tagging system, tags of users contain rich information on personalized preference, and time stamps of users show their interest changes. Users’ interest has the varied timeliness, but the existing recommendation algorithm fusing time information only emphasizes the short-term interest of users but fails to dig into the long-term stable interest of users and thus presents the low recommendation precision. In this paper, we propose a tag-based recommendation algorithm integrating short-term and long-term interests of users. The algorithm first builds the short-term and long-term interest characteristics of users based on tags according to the use frequency, time decay, life cycle and volatility; then it maps the characteristics to the resources tagged by the user to form a user-resource pseudo-scoring matrix. Finally, it calculates the set of the nearest neighbors of user with the matrix to give recommendations. The verification on the delicious data set shows that the algorithm improves recommendation precision and diversity compared with other classical algorithms.
Introduction
With the rapid development of internet and web technologies, people have stepped from the times lacking information to the times with overloaded information. To reduce the information burdens on users and enhance users’ online experience, the personalized recommendation service has been widely applied in main e-commerce, news and social websites. The personalized recommendation system infers the interest preference of users from the historical behavior data recorded and then finds the content users are interested in actively.
The collaborative filtering recommendation algorithm is the most successful one in recommendation algorithms [1], the algorithm can find the set of the most similar users for the target user and then make recommendations to the target user with the recourses preferred by the users in the set. However, the traditional collaborative filtering algorithm judges the similarity of users according to the scoring or clicking information of users alone but fails to fully acquire the interest preference of user and is not good for capturing the user’s interest changing with time.
In the times of Web 2.0, users produce webpage content continuously rather than only browsing webpage passively. As one of Web 2.0’s characteristics, the collaborative tagging system is popular in websites of social resources, because it offers users simple and efficient resource management. Users’ tags construct the bridge between the user and the resource. The tags used by the user show the user’s preference for some types of resources, and the time stamps for tags reflect the user’s interest changes [2]. Therefore, researching users’ tagging behaviors, researchers can excavate users’ interest and the dynamic changes of interest with time accurately.
builds the short-term and long-term interest characteristics of users based on tags according to the use frequency, time decay, life cycle and volatility; then it maps the characteristics to the resources tagged by the user to form a user-resource pseudo-scoring matrix. Finally, it calculates the set of the nearest neighbors of user with the matrix to give recommendations. The verification on the delicious data set shows that the algorithm improves recommendation precision and diversity compared with other classical algorithms.
Related Work
The recommendation system finds the content users are interested in massive data using the historical behavior data of users. In various recommendation technologies, the collaborative filtering technology is used most widely. The collaborative filtering technology is generally divided into the method based on neighborhood and the method based on model [1]. The collaborative tagging is also called folksonomy [3], with which users can tag favorite resources freely for subsequent management and searching. Users describe resources with tags, so tags are the ties between users and resources. How to improve the quality of personalized recommendation application using the tag information of users is a focus in the research on recommendation systems. Ma et al., [4] integrated the scoring, tags and social network information into the user-based collaborative filtering algorithm which predicted the interest of no-tag users with the tags of friends and thus not only improved the quality of recommendation but also alleviated the cold start problem of users. Touhid et al., [5] constructed the trust network of users with the tag information of users and expanded the range of neighbor user through the trust transfer mechanism and thus obtained good recommendation results.
How to capture users’ interest changes with time accurately is a huge challenge faced by recommendation systems currently. Ding et al., [6] proposed that the more recent scoring data of users can help better predict current interest of users, so he clustered resources and calculated the weight of each user’s score to each kind of resource with the time decay function. Introducing the time decay function, Yu et al., [7] constructed users’ preference for resources according to users’ tagging information and tagging time for resources.
The recommendation algorithm needs to take the short-term and long-term behavior rules into consideration evenly, trying to make recommendation results reflect the interest changes of users according to the recent behaviors of users and also avoid the excessive influence from short-term behaviors to ensure the diversity and continuity of recommendation list’s prediction on users’ interest. The tagging behaviors of users can capture the laws above, so the paper fully characterizes users’ short-term and long-term interests from the perspective of user tags to improve the quality of recommendation system.
Proposed Recommendation Algorithm
Description on Tagging System: The data model of collaborative tagging system can be described as
F: =(U, T, R, t) in which U represents the set of m users, R represents the set of n resources, T
represents the set of p tags, and t is the time information of tagging. Define the quaternary relationship
Y U T R t in F as the set of tagging relationship. For each element in Y, y= (Ui, Tj, Rk, tl),
meaning user Uitags resource Rk with tag Tjat the time of tl.
Tag-based User Interest Model: Generally speaking, some short-term interest of user will change with time or under the influence of external environment, and recent tags of users can better reflect current interest of users. Therefore, similar to the self-adaptive exponential decay function proposed by Cheng et al. [8], the short-term interest is defined as
, exp
ln 2
,
short u
w u t decline u t halflife . (1)
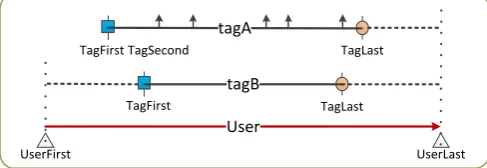
Figure 1 shows the time stamps for tags of a user and the time is calculated by day. In equation (1),
,u
UserLast , the last tagging time of user u, and TagLastu t, , the last time user u uses tag t. halflifeu is the half life cycle of user, which decays slowly for the users using the system for a long time because these users are familiar with the system and have more stable interest, and decays fast for new users because these users are not familiar with the system, browse content widely and use tags unstably [9]. According to equation (1), wshort, the tag recently used by the user has the big weight while the tag hasn’t been used for a long time has the small weight, according to which, the model of user’s recent interest can be characterized.
UserFirst UserLast
TagFirstTagSecond TagLast
TagFirst TagLast
[image:3.595.175.419.183.267.2]User tagB tagA
Figure 1. Time stamps for tags of User.
Some long-term and stable interest of user won’t change over time or under the influence of external environment easily. The bigger the different between the user’s first tag and the last tag is, the more continuous the user’s interest in this field is. Furthermore, if in the duration, the user’s time stamps for the tag distribute evenly and the user uses the tag frequently, it means the user has stable interest in this field. Therefore, the long-term interest is defined as
, , ,, , ,
, ,
1
u t u t u t
long
u t u t u t
TagLast TagFirst Freq
w u t
UserLast UserFirst CV
(2)
where Frequ t, is the normalized frequency of tag t of user u:
, ,
,
, max
u t u t
u j j T u
Num Freq
Num
(3)
where Numu t, is the frequency user u uses tag t, and the minimum counting unit is day, i.e. no matter how many times user u uses tag t in one day, it is only considered that u uses tag t once.
,
maxj T u Numu j is the use frequency of the tag most frequently used in all tags T(u) of user u. CVu t,
is the variable coefficient of time interval for user u using tag t. The variable coefficient is the ratio of standard deviation to mean value, and like the standard deviation, it is also the absolute value reflecting dispersion degree of data, but it can eliminate the influence from the greater difference of units or mean values on data comparison. According to equation (2), the longer the life cycle of a tag used by the user is, the more frequently the user uses the tag in the life cycle, and the more evenly the time intervals of use distribute, the bigger the weight, wlong, is and the longer and the more stable the user’s interest in this field is. For instance, in Figure 1, the life cycle of tag A is bigger than that of tag B. Tag A has been used for 7 times with 6 time interval values in the life cycle, while tag B is only used twice. For the stability of tag B, we assume that the user uses tag B in the first and last stamps, so there are totally three time interval values. Because the tag used only once can’t reflect the long-term interest of user, its weight, wlong, is defined to be 0.
Considering the short-term and long-term interest of user comprehensively, we weigh the values of two kinds of interest of users’ tags
, short
, 1
long
, ,w u t w u t w u t (4)
where
0,1 is the weight regulatory factor. The influence of on experimental results shall be(4). If we use the matrix to calculate the similarity of users, the calculation results shall be affected due to the sparsity of the user-tag matrix and the polysemy, synonymy, part of speech and other semantic problems of tags [10]. Therefore, in the paper, we use tag weight w u t
, to build a user-resourcepseudo-scoring matrix to calculate the similarity of users. Considering that the resources tagged by the user with the same tag have the similarity and the user will give more tags to the resources he is more interested in and more emphasizes [11], the pseudo score given by user to the resource can be defined as
, ,
, ,i i
t T u r
w u r
w u t (5)where T(u,r) is the set of all tags used by user u in resource r, and w u t
, i is the weight of user u’sinterest in tag ti. Equation (5) reflects the short-term and long-term interest of user in the resources tagged by the user according to the weight of tags of user, and the part of resources interested in by the user recently or for a long time have higher pseudo scores. The user-resource pseudo-scoring matrix obtained from equation (5) fully reflects the timeliness of the user’s interest in the resource, so the matrix can be used to calculate the similarity of users to get relatively accurate personalized recommendations.
Produce Recommendation: There are many methods used to calculate the similarity of users according to the user scoring matrix, such as the Pearson’s correlation coefficient, Spearman correlation coefficient, included angle cosine and Jaccard similarity [12]. The paper uses the common included angle method. The similarity between user u and user v is defined as
, , ,
2 2
, ,
, i R u v u i v i ,
u i v i
i R u i R v
w w
u v sim u v
u v w w
(6) where R(u) is the set of resources tagged by user u, R(v) is the set of resources tagged by user v, R(u, v) is the set of resources tagged by both user u and user v, and wu i, represents user u’s pseudo score toresource i. Equation (6) shows that the more the common resources tagged by two users are and the
more similar the pseudo scores given by the two users to the common resources are, the bigger the value of similarity between the two users is. We can get the k users nearest to target user with equation (6). Finally, from the set of resources interested in by k nearest neighbor, n resources the most interested in by the target user is predicted with equation (7) [13]:
, ,
, ,
,
v r v Neighbor u
v Neighbor u
w sim u v
predict u r
sim u v
(7) where Neighbor(u) is the set of the nearestk neighbors of user u.Experiments and Analysis
The data set used in the experiment comes from Delicious.com which is a social bookmarking website allowing users to tag the bookmarks collected or shared [14], and we only retain the user tag data from 2008 to 2011 in the data set but delete the users who have tagged less than five bookmarks. The final data set includes 1517 users, 23086 bookmarks and 23414 tags. 20% of users are selected randomly as test users and the remaining 80% of users are considered as training users. In the bookmarks of test users, according to the timeline, the first 80% of bookmarks are considered to be the training set and the rest, the 20% of bookmarks, is considered as the test set. The experiment shall be made repeatedly for five times. The final experimental result is the average value of five results.
Re
, Re
u U
c u R u
Precision U
c u
(8)
Re
, R
u U
c u R u
Recall U
u
(9)where Rec(u) represents the set of resources recommended to user u, R(u) represents the set of test resources of user u, and U represents the set of all test users.
Users’ interest has the diversity, so if the recommendation list offers multiple content covering the most interest fields of user, it can not only enhance the probability for the user to find interested resources but also meet different types of interest of the user. Therefore, the diversity of recommendation system is also an important evaluation index. The diversity of recommendation list
Rec(u) of user u and the overall diversity of recommendation system are defined as [13]:
, Re , ,
Re 1 ,
1
Re Re 1
2
i j c u i js i j
Diversity c u
c u c u
(10)
Re
,u U
Diversity
Disversity c u U (11)where s i j
,
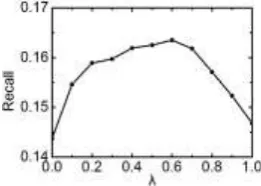
0,1 defines the similarity of resource i and resource j. The paper uses the resource-user 0-1 matrix to calculate the collaborative filtering similarity of resources.Selection of Parameter : in equation (4) is the regulatory factor of short-term interest and long-term interest and it shows different characteristics for different data. In the experiment, we set k,
the number of the nearest neighbors of user as 50, and n, the number of recommendation resources as
40, to test the influences of different values of on experiment results. As shown in figure 2, when
the value of is 0.6, the precision rate and recall rate of algorithm both reach the maximum values, indicating in the data set selected in the paper, the short-term and long-term interests and preference
of user are equally important, so the paper chooses 0.6 for the subsequent comparison
experiment.
[image:5.595.343.474.483.576.2]
Figure 2. Impact of to recommendation result.
Comparison of Results from Different Recommendation Algorithms: In the paper, we choose four recommendation algorithms for the comparison with the algorithm proposed in the paper: a) the collaborative filtering algorithm based on user-resource 0-1 matrix (user-resource-cf); b) the collaborative filtering algorithm based on tag frequency similarity [4]; c) the collaborative filtering algorithm only considering the short-term interest of user (short-only-cf); d) the collaborative filtering algorithm only considering the long-term interest of user (long-only-cf). We set k, the number of
nearest neighbors of each algorithm, to be 50, and n, the number of recommended resources, to be in
Figure 3. Precision and recall of five algorithms.
As shown in Figure 3, the precision rates of five recommendation algorithms all improve as n, the
number of recommendation resources, increases, and reach the maximum when n is 50 or 60, and then
present a decline trend while n goes on increasing; the recall rate increases as n increases and levels off after n reaches 70. The short-only-cf or the long-only-cf capture the changes of interest of users using the time stamps for tags of users and map the interest preference indicated by user tags in the user-resource matrix to calculate the similarity of users and thus have no problems of polysemy, synonyms or part of speech of tags. The two algorithms improve the precision rate and recall rate by 30.02%~45.11% and 17.88%~26.78%, respectively. When taking both short-term and long-term interest of users into consideration and adjusting the weight factor of them, the algorithm shall improve the precision rate and recall rate by 23.91%~36.27% and 10.11%~13.81%, respectively, indicating users’ interest has the varied timeliness and the changes of interest can be captured from the tagging behaviors of users for the purpose of performance improvement of recommendation system.
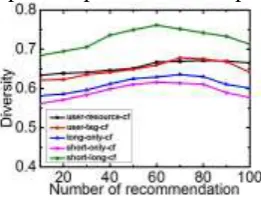
[image:6.595.298.470.71.176.2]Figure 4. Diversity of five algorithms.
Figure 4 shows the diversity index of five recommendation algorithms. The short-only-cf and the long-only-cf lay particular stress on some interest of users in a given period of time and thus have simple recommendation lists and the diversity lower than that of classical algorithm. The collaborative filtering algorithm integrating the short-term interest with the long-term interest of users fully considers the timeliness of interest of users and thus offers recommendation system with the highest index of diversity, further verifying the effectiveness of the algorithm proposed in the paper.
Summary
In the recommendation system, the interest of users has the varied timeliness and some interest preference changes over time but other interest preference may be persistent and stable. The recommendation system must track the temporal dynamic changes of users’ interest preference to improve recommendation performance. In the collaborative tagging system, the tagging behaviors of users can reflect the interest preference of users and the dynamic changes of interest preference with time, so the paper proposes an algorithm which can fully excavate the short-term and long-term interest preferences of users with the using frequency, time decay, life cycle and volatility of tags of users. The comparison experiment shows that the algorithm proposed can improve the quality of recommendation system.
Acknowledgement
[image:6.595.232.363.366.467.2]No, 61202102; 61173036) and the Science-Technology Foundation of Hunan province, China (Grant No, 2015GK3010).
References
[1] Choi, Keunho, and Y. Suh. A new similarity function for selecting neighbors for each target item in collaborative filtering. Knowledge-Based Systems 37, 1(2013), pp. 146-153.
[2] Larrain, Santiago, et al. Good times bad times: a study on regency effects in collaborative filtering for social tagging. ACM Recsys ACM, 2015, pp. 269-272.
[3] Godoy, Daniela, and A. Corbellini. Folksonomy-based recommender systems: a state-of-the-art review. International Journal of Intelligent Systems 31, 4(2016), pp. 314-346.
[4] Ma, Tinghuai, et al. Social network and tag sources based augmenting collaborative recommender system. IEICE Transactions on Information & Systems 98.4(2015), pp. 902-910.
[5] Bhuiyan, Touhid, et al. Developing Trust networks based on user tagging information for recommendation making. Web Information Systems Engineering – WISE 2010. Springer Berlin Heidelberg, 2010, pp. 357-364.
[6] Ding, Yi, and X. Li. Time weight collaborative filtering. ACM CIKM International Conference on Information and Knowledge Management, Bremen, Germany, 2005, pp. 485-492.
[7] Yu, Hong, and Z. Li. A Collaborative filtering method based on the forgetting curve. International Conference on Web Information Systems and Mining IEEE, 2010, pp. 183-187.
[8] Cheng, Yuan, et al. Model bloggers' interests based on forgetting mechanism. International Conference on World Wide Web, WWW 2008, Beijing, China, 2008, pp. 1129-1130.
[9] Xiang, Liang, et al. Temporal recommendation on graphs via long- and short-term preference fusion. ACM SIGKDD International Conference on Knowledge Discovery and Data Mining ACM, 2010, pp. 723-732.
[10] Naeen, Hossein Monshizadeh, M. Jalali, and A. M. Naeen. A trust-aware collaborative filtering system based on weighted items for social tagging systems. Intelligent Systems IEEE, 2014, pp. 1-5.
[11] Chatti, M. A, et al. Tag-Based Collaborative Filtering Recommendation in Personal Learning Environments. IEEE Transactions on Learning Technologies 6.4(2013), pp. 337-349.
[12] Bobadilla, Jesús, et al. A balanced memory-based collaborative filtering similarity measure. International Journal of Intelligent Systems, 27.10(2012), pp. 939-946.
[13] Adomavicius, Gediminas, and A. Tuzhilin. Toward the next generation of recommender systems: a survey of the state-of-the-art and possible extensions. IEEE Transactions on Knowledge & Data Engineering, 17.6(2005), pp. 734-749.